The Apache County Arizona Land Cover Map makes one contrast immediately clear: most of this long northeastern Arizona county is mapped as shrubland, while forest becomes much more prominent toward the south and in several eastern patches. The 2025 summary lists shrubland at 72.87% and forest at 23.44%, with grassland, developed land, barren ground, water, wetlands, and agriculture occupying much smaller shares.
Four views are included on this page: general land cover, forest and farmland, impervious surface and developed land, and a 1985–2025 class-difference map. The four original JPG maps are also available in one download. They work well for county-scale reference, lessons, presentations, and broad environmental comparisons, but they are not parcel maps, zoning maps, ownership maps, or substitutes for site-specific field information.
Table of Contents
A long county dominated by shrubland
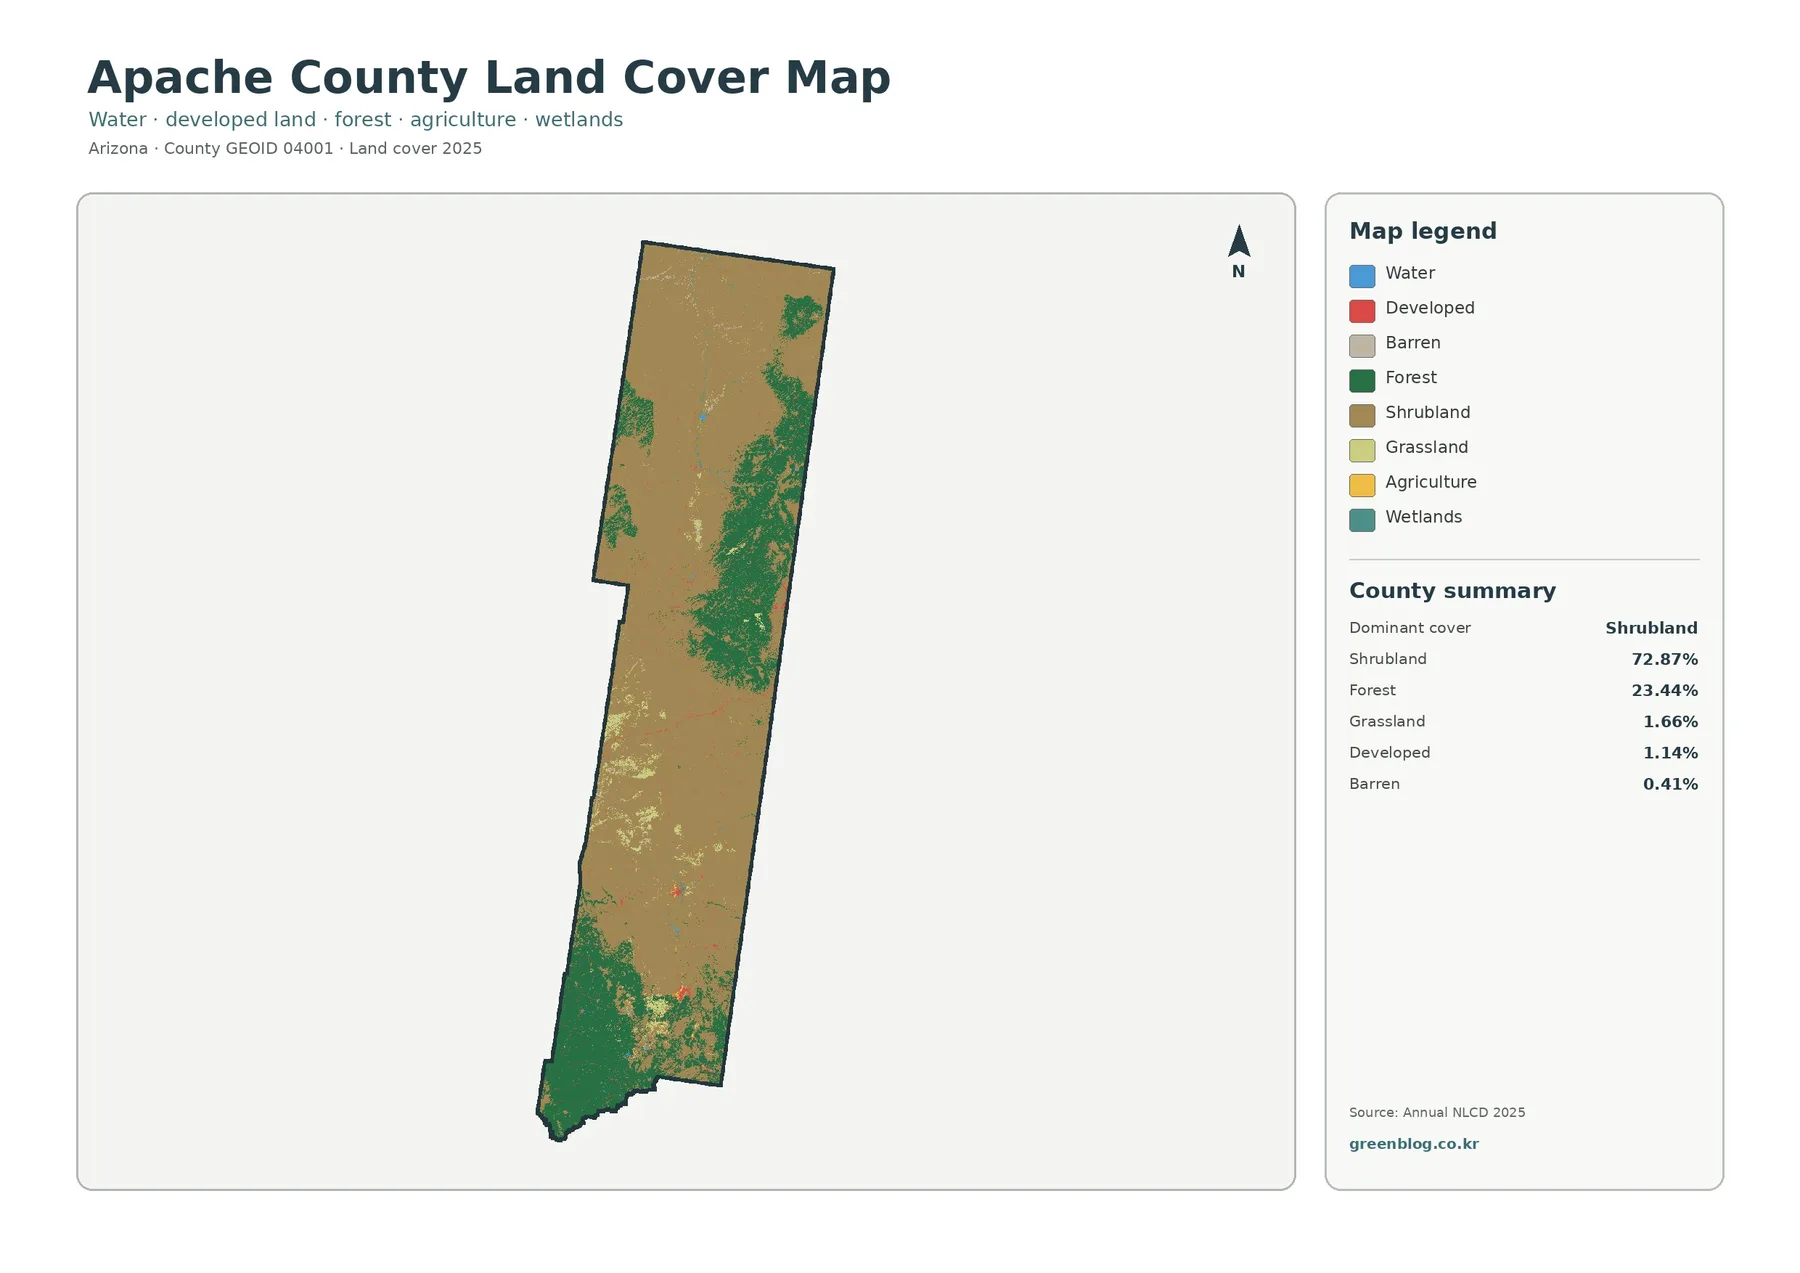
Apache County is unusually elongated. The county’s official visitor page describes it as running about 211 miles from the Utah state line to just south of Alpine, Arizona. That north–south reach matters when reading a countywide land-cover image because a feature that looks small on the page may still cover a large local area, and the northern and southern ends can have very different surface conditions. The map’s broad tan-brown shrubland field extends through most of the northern and central county, while dark green forest expands sharply near the southern end.
Very little of the county is strongly impervious
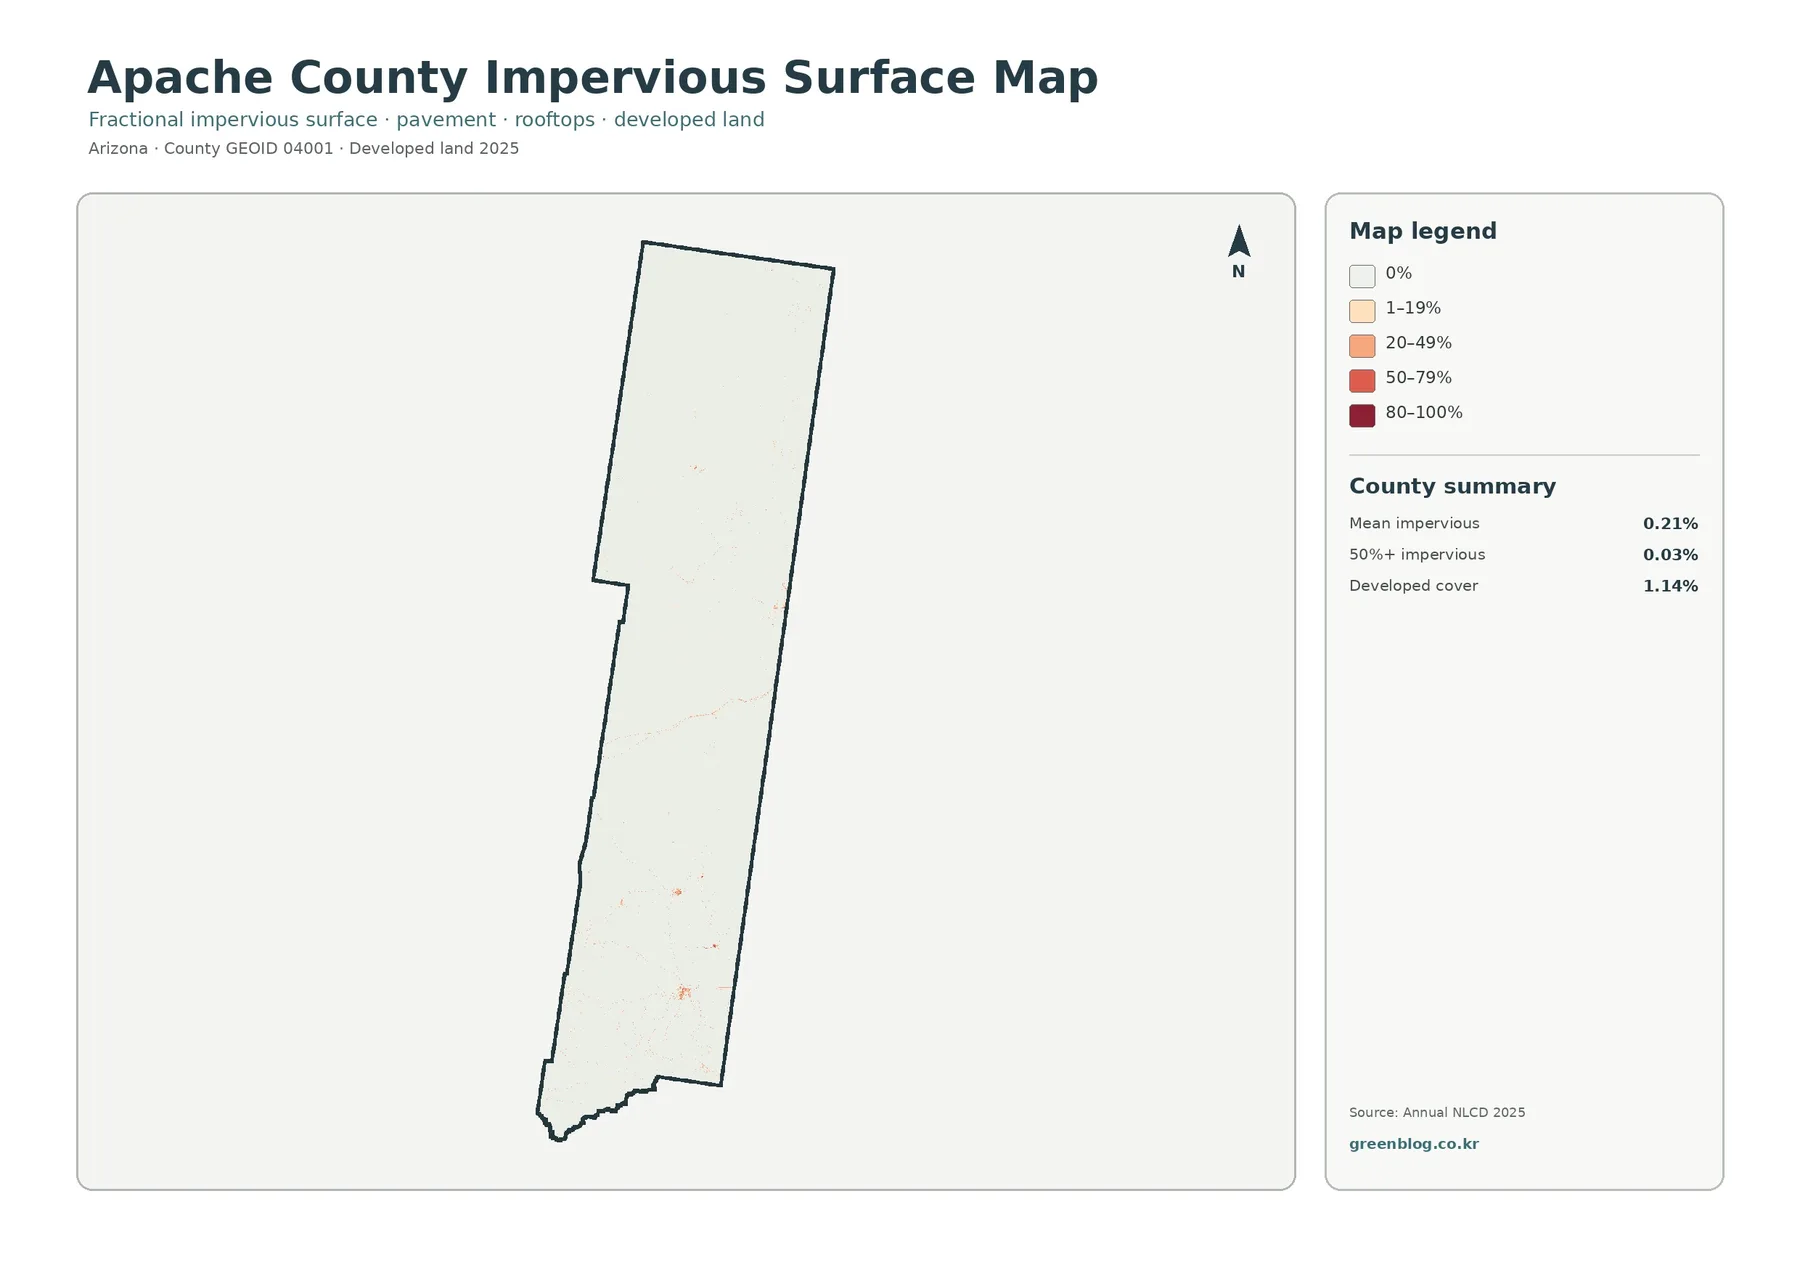
The impervious-surface map is visually much quieter than the general land-cover map. Most of the county is nearly white, with small colored clusters and thin traces appearing mainly in the southern half and at scattered locations farther north. Impervious surface means pavement, rooftops, and similar surfaces that shed water rather than allowing it to soak readily into the ground. The countywide mean is only 0.21%, and the share mapped at 50% or greater imperviousness is 0.03%.
Developed land cover is listed separately at 1.14%. That value should not be substituted for the impervious percentage. A developed land-cover class can include vegetation, yards, bare ground, and other non-paved surfaces mixed with buildings and roads, especially in lower-density settings. The impervious product measures the fraction of hard surface within mapped cells, while the developed class is a categorical land-cover label. Reading the two together gives a better sense of how limited strongly paved surfaces are across this very large county.
Forest and farmland occupy very different shares
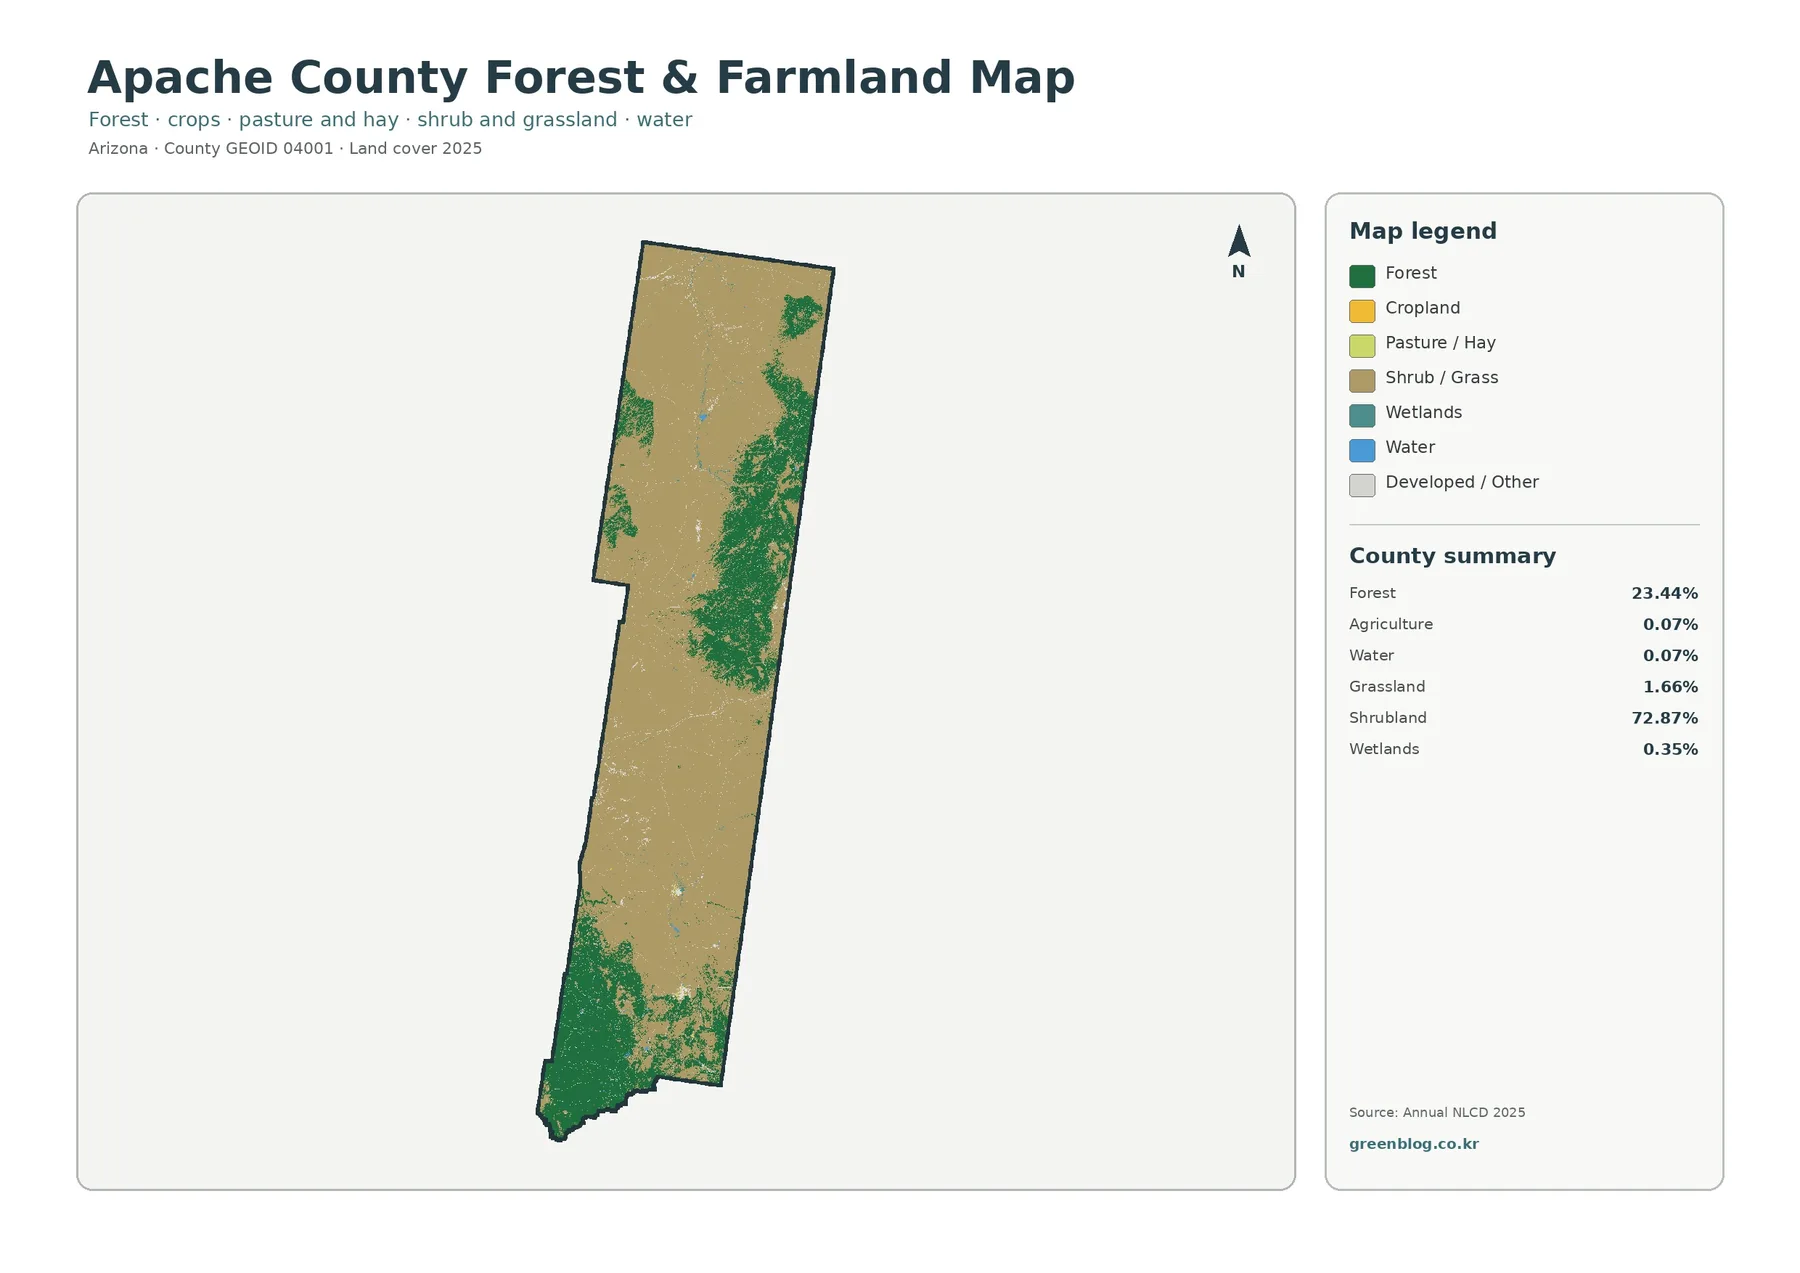
The forest-and-farmland view simplifies the comparison by emphasizing forest, cropland, pasture or hay, shrub and grass cover, wetlands, water, and remaining developed or other surfaces. Its summary lists forest at 23.44%, agriculture at 0.07%, water at 0.07%, grassland at 1.66%, shrubland at 72.87%, and wetlands at 0.35%. Agriculture and water are therefore difficult to see at county scale even though both can be locally important.
A tiny countywide agriculture percentage should not be read as “no agriculture.” Apache County’s own visitor information notes that Navajo families farm and raise livestock in Canyon de Chelly. Local agricultural areas can be meaningful on the ground while still representing only a small fraction of a county that stretches more than two hundred miles north to south. At 30-meter raster resolution, narrow fields, small pastures, and mixed surfaces may also be generalized into the dominant class within a grid cell.
What the 1985–2025 difference map actually measures
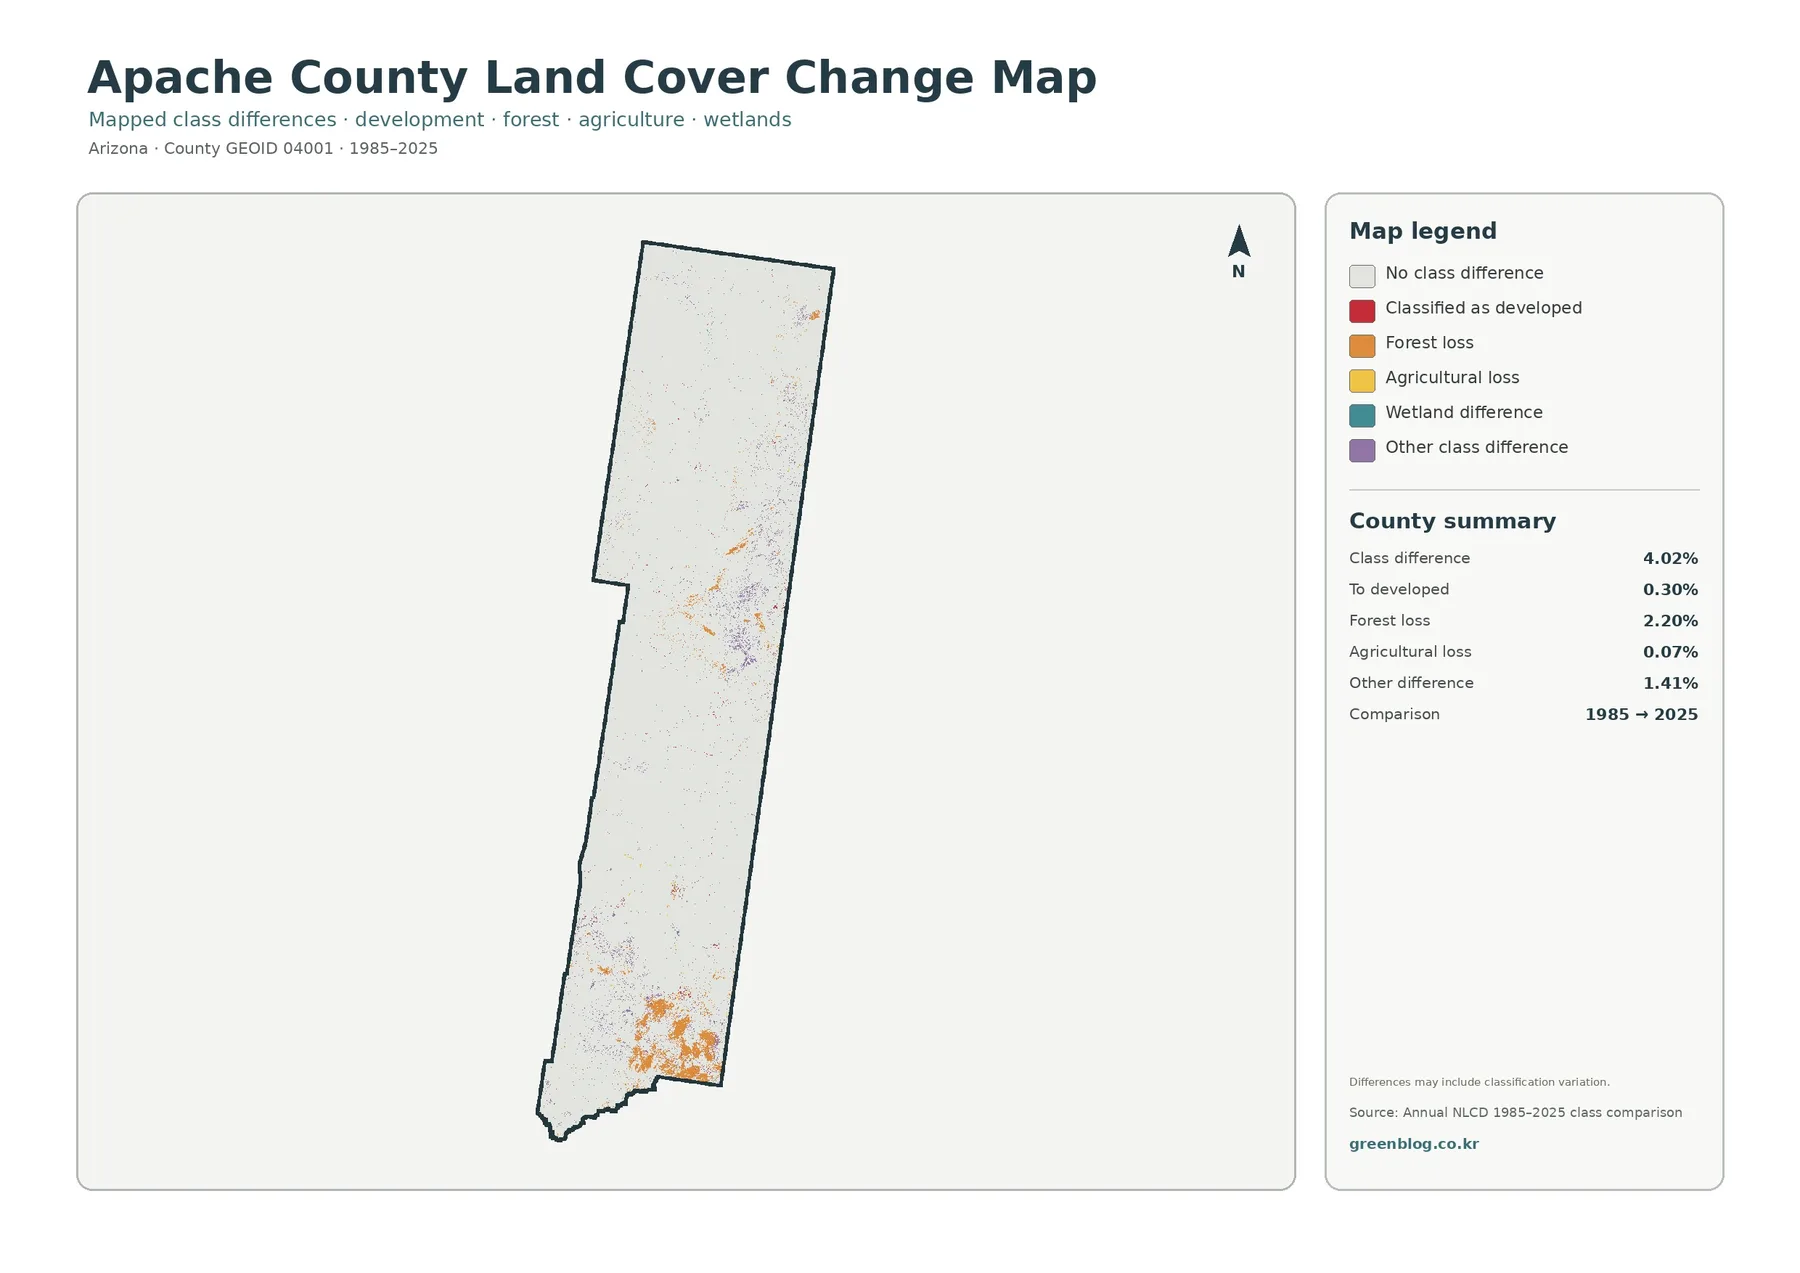
The 4.02% class-difference value is not a development rate. It is the share of cells whose mapped class differs between the 1985 and 2025 comparison. The summary separately identifies 0.30% as “to developed,” 2.20% as forest loss, 0.07% as agricultural loss, and 1.41% as other class difference. Those categories make clear that the comparison contains several types of change rather than one simple expansion of developed land.
Orange forest-loss marks are especially visible in the southern forested part of the county, with smaller scattered differences appearing farther north. The map does not say why a cell changed class. Fire, timber treatment, vegetation succession, drought effects, classification uncertainty, and other processes would require additional evidence before they could be attached to a particular patch. The preview itself warns that differences may include classification variation, so a colored cell should be treated as a place to investigate rather than as a complete explanation.
Using local geography without confusing cover and ownership
The county’s southern forest concentration is easier to understand when the White Mountains are added as geographic context. The Apache-Sitgreaves National Forests include extensive White Mountains country, and the Forest Service notes a wide elevation range across the forests. Those facts help explain why the southern portion of the county is useful to compare with the shrub-dominated north, but the land-cover colors should still be treated as surface classification, not as a map of Forest Service jurisdiction.
A practical way to compare all four map views
For a quick regional reading, start with the general land-cover map and locate the broad shrubland field and southern forest block. Move next to the impervious map to see how little of the county is dominated by hard surfaces. Then use the forest-and-farmland view to separate forest from the very small agriculture, water, and wetland shares. Finish with the change map, looking for places where the 1985 and 2025 classifications differ. This sequence moves from the current landscape to a narrower developed-surface question, then to natural and agricultural detail, and finally to change through time.
- Classroom geography: compare dry shrubland with forested high country inside one unusually long Arizona county.
- Environmental presentations: pair the broad land-cover pattern with impervious-surface information without implying a parcel-level assessment.
- Watershed or habitat context: use the maps as a starting layer before adding streams, topography, wildlife, or management boundaries from appropriate sources.
- Change screening: identify colored difference areas and then investigate those locations with other years, imagery, fire history, or land-management records when a cause matters.
Keep the legends visible when the maps are used in slides or printouts. The general land-cover colors describe current classes, while the change-map colors describe differences between two years. Orange on the change map, for example, marks forest loss rather than a current “orange” land-cover type. Leaving the legend attached prevents a common error in which the same visual color is assumed to mean the same thing across different map products.
Download the four original JPG maps
The WebP images in the article are viewing copies. The download archive contains the four original JPG maps: general land cover, forest and farmland, impervious surface and developed land, and the 1985–2025 class-difference map. Each JPG is 2480 × 1754 pixels. The supplied asset manifest specifically marks these files as not meeting its A3 high-resolution reference, so check the intended print size and output quality before using them for a large-format print.
Scale, date, and classification limits
Because Annual NLCD uses 30-meter raster cells, boundaries are generalized. A cell can contain a mix of roof, road, soil, grass, shrubs, and trees but still receive one dominant land-cover class or a fractional impervious value. That is useful for county-scale statistics, yet it is not precise enough for a property survey, a building plan, a drainage design, or a determination of legal land use. Those tasks require parcel data, professional surveys, engineering information, or current zoning records.
Frequently Asked Questions
Does 72.87% shrubland mean that 72.87% of the county has the same legal land use?
No. The percentage describes surface cover classified as shrubland in the 2025 Annual NLCD data. Zoning, ownership, grazing status, protected areas, and other legal or management categories must be checked in separate official records.
Is the 4.02% class difference the amount of new development?
No. The 4.02% figure covers all mapped class differences between 1985 and 2025. The summary identifies only 0.30% as a transition to developed, while forest loss, agricultural loss, and other differences are listed separately.
Why is developed cover 1.14% when mean impervious cover is only 0.21%?
They measure different things. Developed land is a categorical land-cover class that can include vegetation and open surfaces, while fractional impervious cover estimates the share of hard surfaces such as pavement and rooftops within the mapped cells.
What is included in the download ZIP?
The archive contains four 2480 × 1754 JPG files: the general land-cover map, forest-and-farmland map, impervious/developed-land map, and 1985–2025 land-cover-change map. The WebP article previews are separate from those original JPG files.
Map File Information
Apache County Land Cover Map Files
- Printable Size: 2480 × 1754 pixels each
Related Maps
- From Mohave to Cochise: Reading an Arizona State Map
- Albany County Land Cover Map
- Allegany County New York Land Cover Map
Sources
- MRLC Annual NLCD Data — Annual land-cover and related products
- USGS Annual NLCD Collection 1.2 Land Cover — 30-meter raster product and 2025 coverage
- U.S. Census Bureau TIGER/Line Shapefiles — county boundary data
- Apache County Visitors — official county geography and local context
- USDA Forest Service: Apache-Sitgreaves National Forests — White Mountains and forest context
Green Map creates custom-edited map images using open geographic data sources such as geoBoundaries, Natural Earth, OpenStreetMap, and government open data.
These maps are edited visual materials, not raw data files, and are provided for education, documents, presentations, and graphic reference.