This page brings together four map views of Cumberland County: the county and road network, city connections, waterways, and elevation. Crossville is the easiest place to begin, and the download box later on the page provides an A3 high-resolution JPG ZIP containing all four maps.
Crossville sits near the center of the mapped road network, while Pleasant Hill lies to the west, Crab Orchard to the southeast, Fairfield Glade to the east, and Lake Tansi to the southwest. The water and elevation views add an important second layer: the Obed River system cuts through the plateau, and the eastern and southeastern part of the county rises into much higher ridges than the broad ground around Crossville.
Table of Contents
Crossville at the center of the county road network
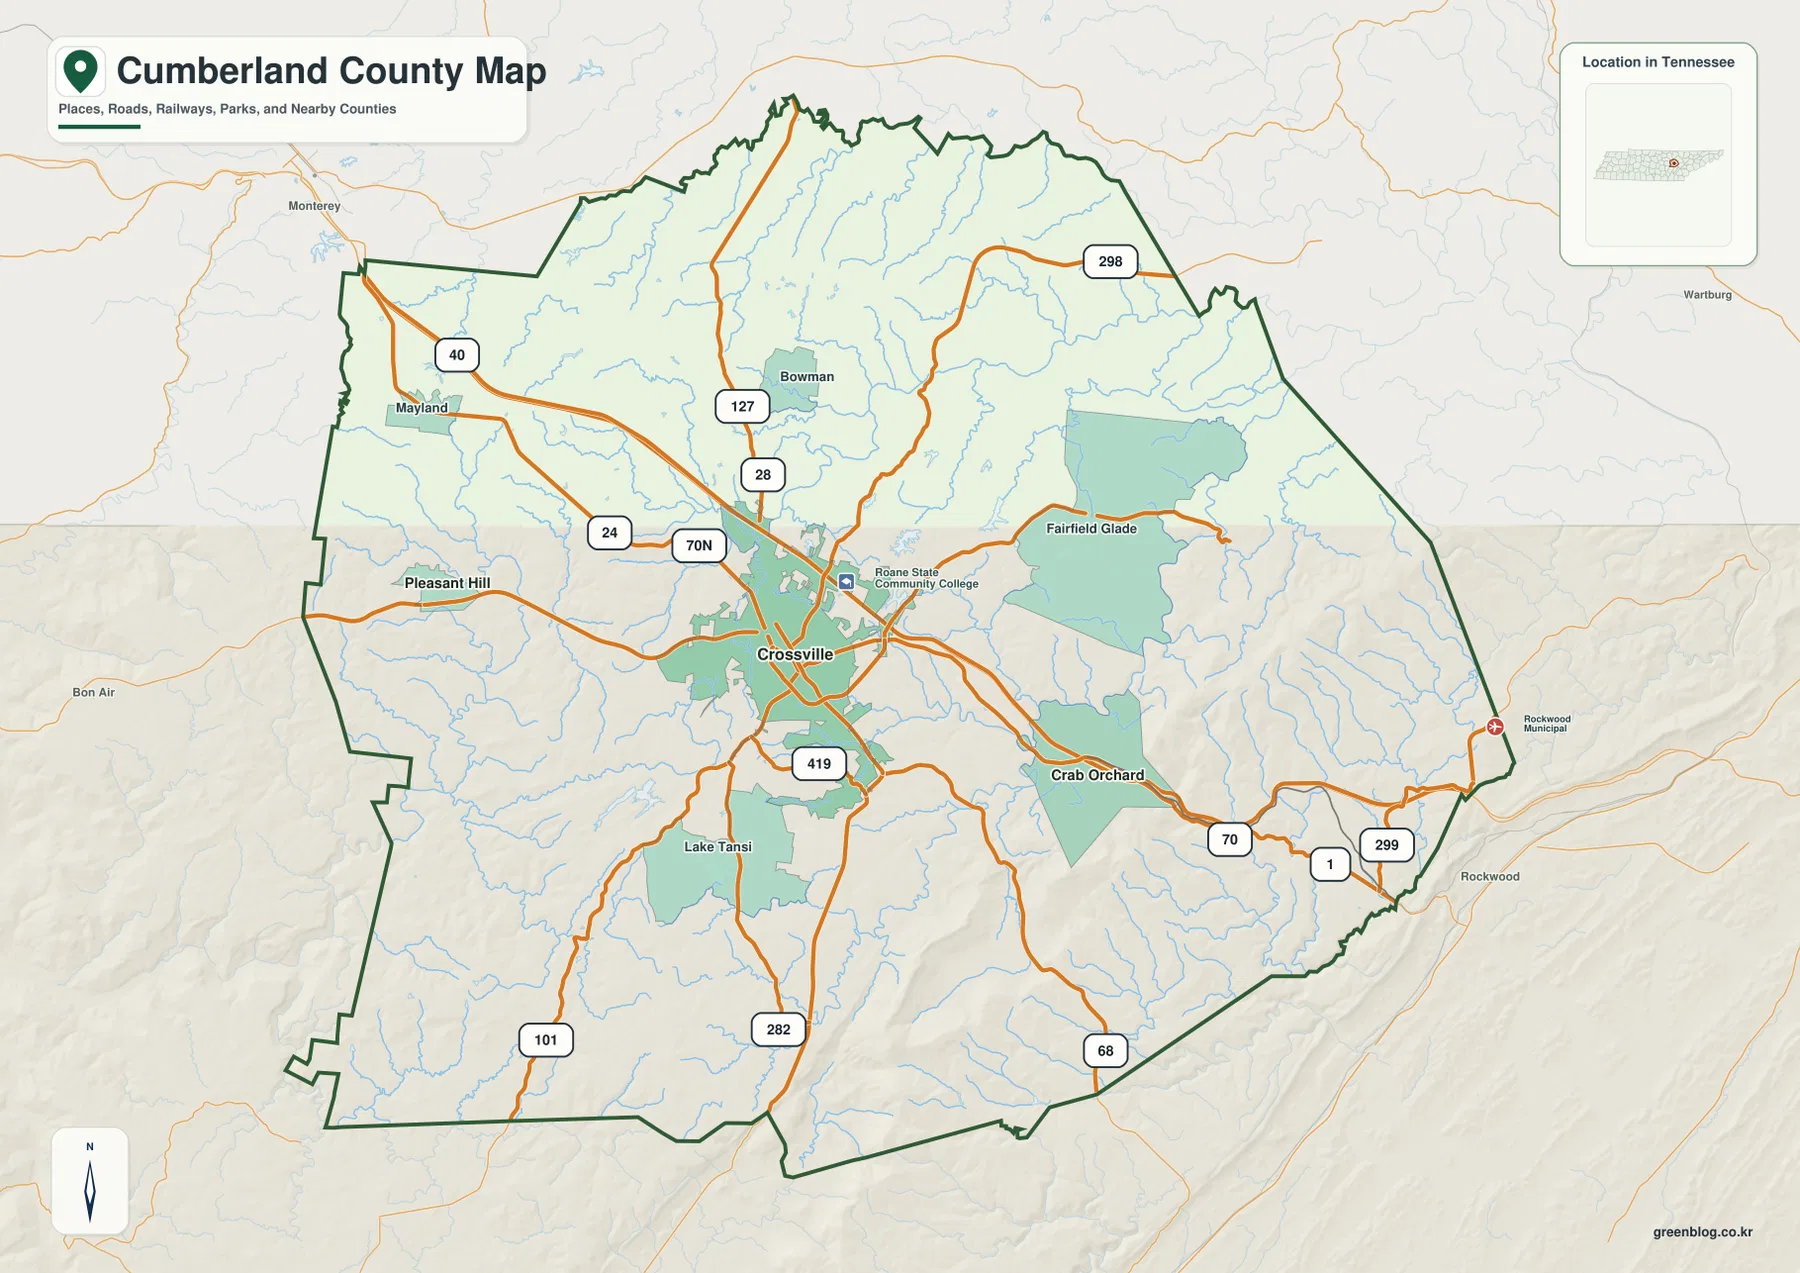
The county map makes Crossville the clearest starting point because several major routes converge there. I-40 runs across the county from west to east, US 127 provides a strong north-south line, and US 70N and US 70 also pass through the central part of the county. Additional numbered routes such as 68, 282, 298, 299, and 419 branch toward outer communities and the county boundary.
The surrounding labels show that the county is not simply a compact circle around Crossville. Pleasant Hill is west of the seat, Mayland is farther northwest, Fairfield Glade lies to the east, and Crab Orchard occupies the southeastern side. Lake Tansi appears southwest of Crossville. Those positions are useful when comparing a route or water feature because each outer area connects to a different part of the county.
Crab Orchard and Pleasant Hill from Crossville
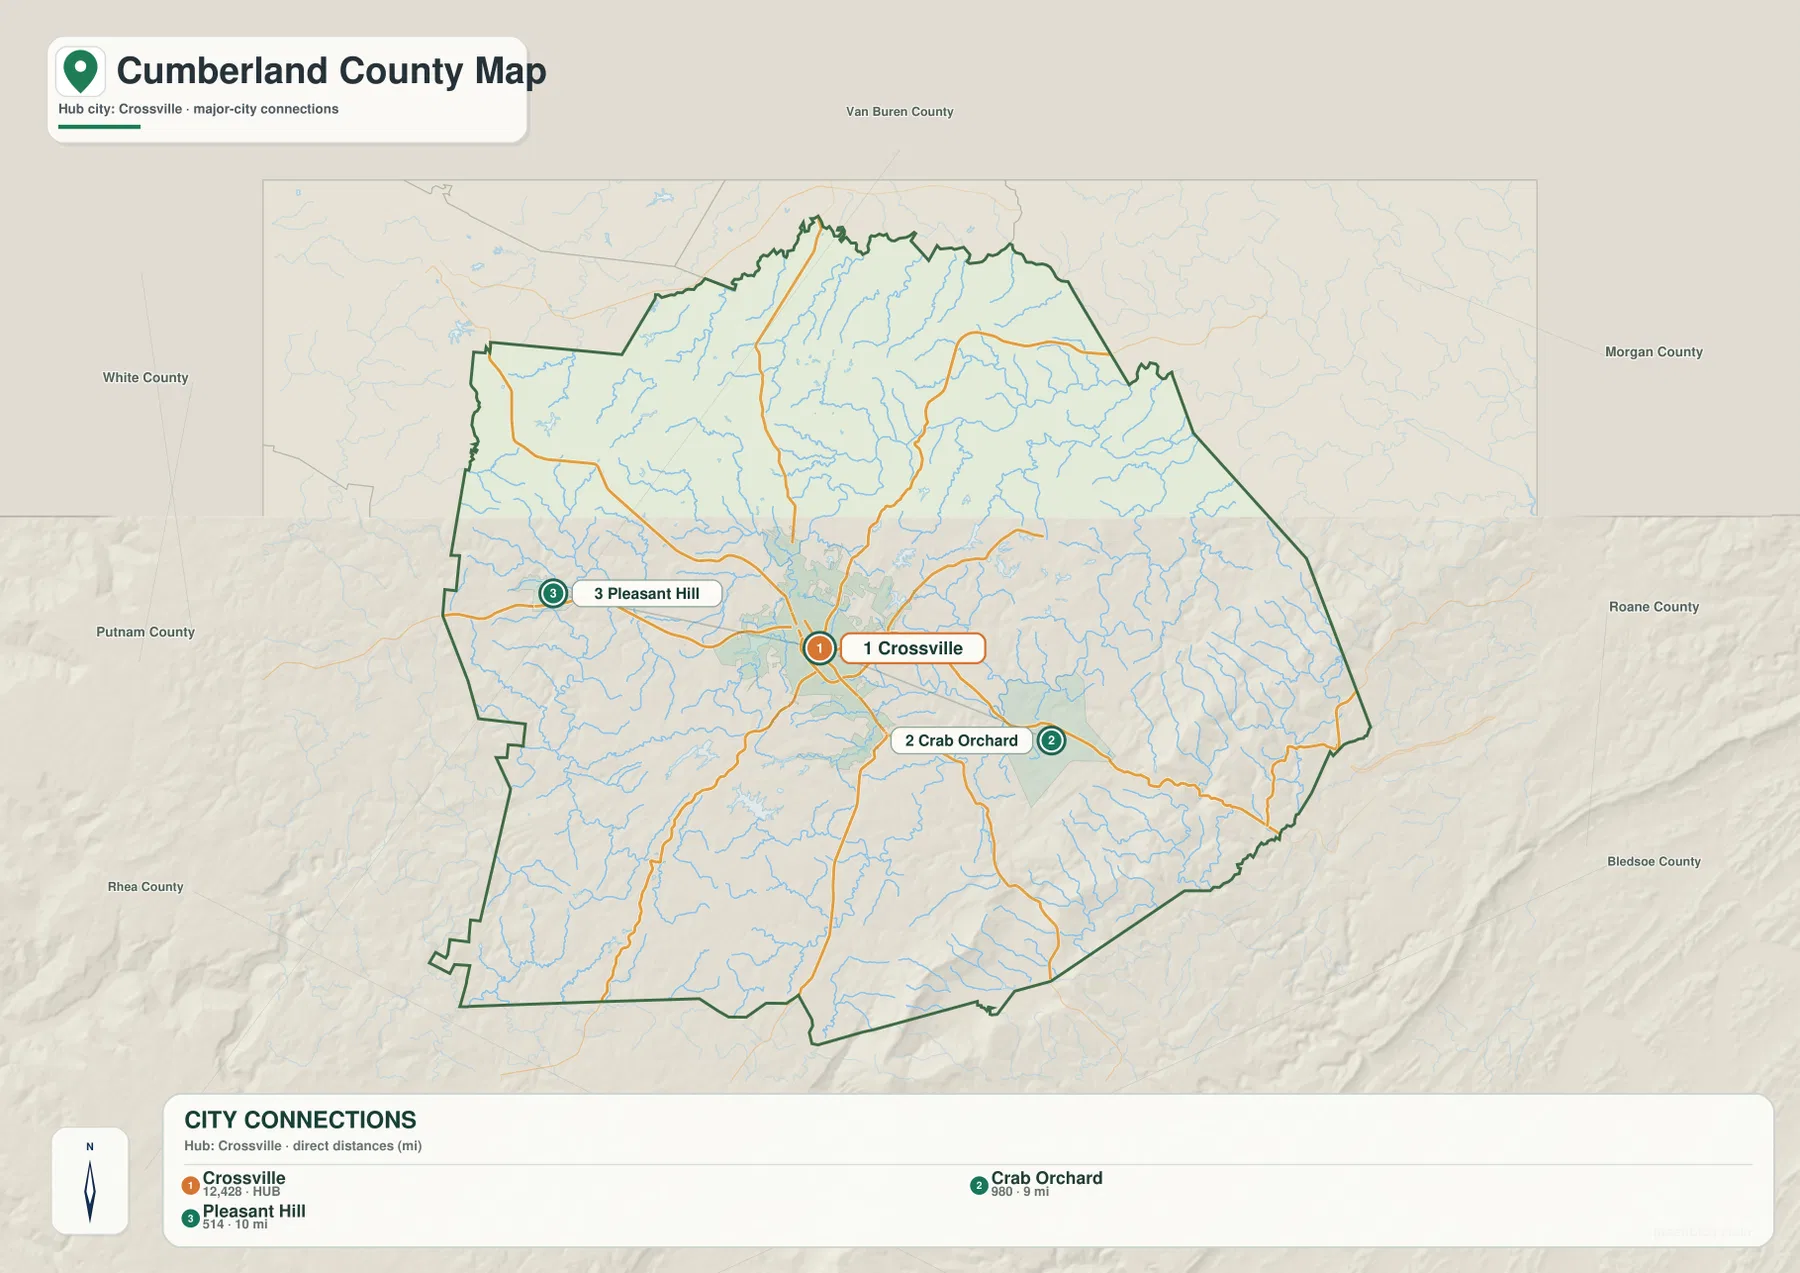
The city-connections map simplifies the county to three labeled places so their directions are easy to compare. Crab Orchard is shown about 9 miles southeast of Crossville, while Pleasant Hill is about 10 miles to the west. These are direct, straight-line distances from the hub city rather than driving distances, so a road trip between the same points can be longer.
The similar distance figures hide a useful geographic difference. The route toward Crab Orchard approaches the higher eastern terrain, while Pleasant Hill sits on the broader western side of the county. This is why the same number of miles can represent very different surroundings. The city map works best when it is viewed beside the road and elevation maps rather than as a substitute for a navigation map.
Obed River, creeks, and a chain of small lakes
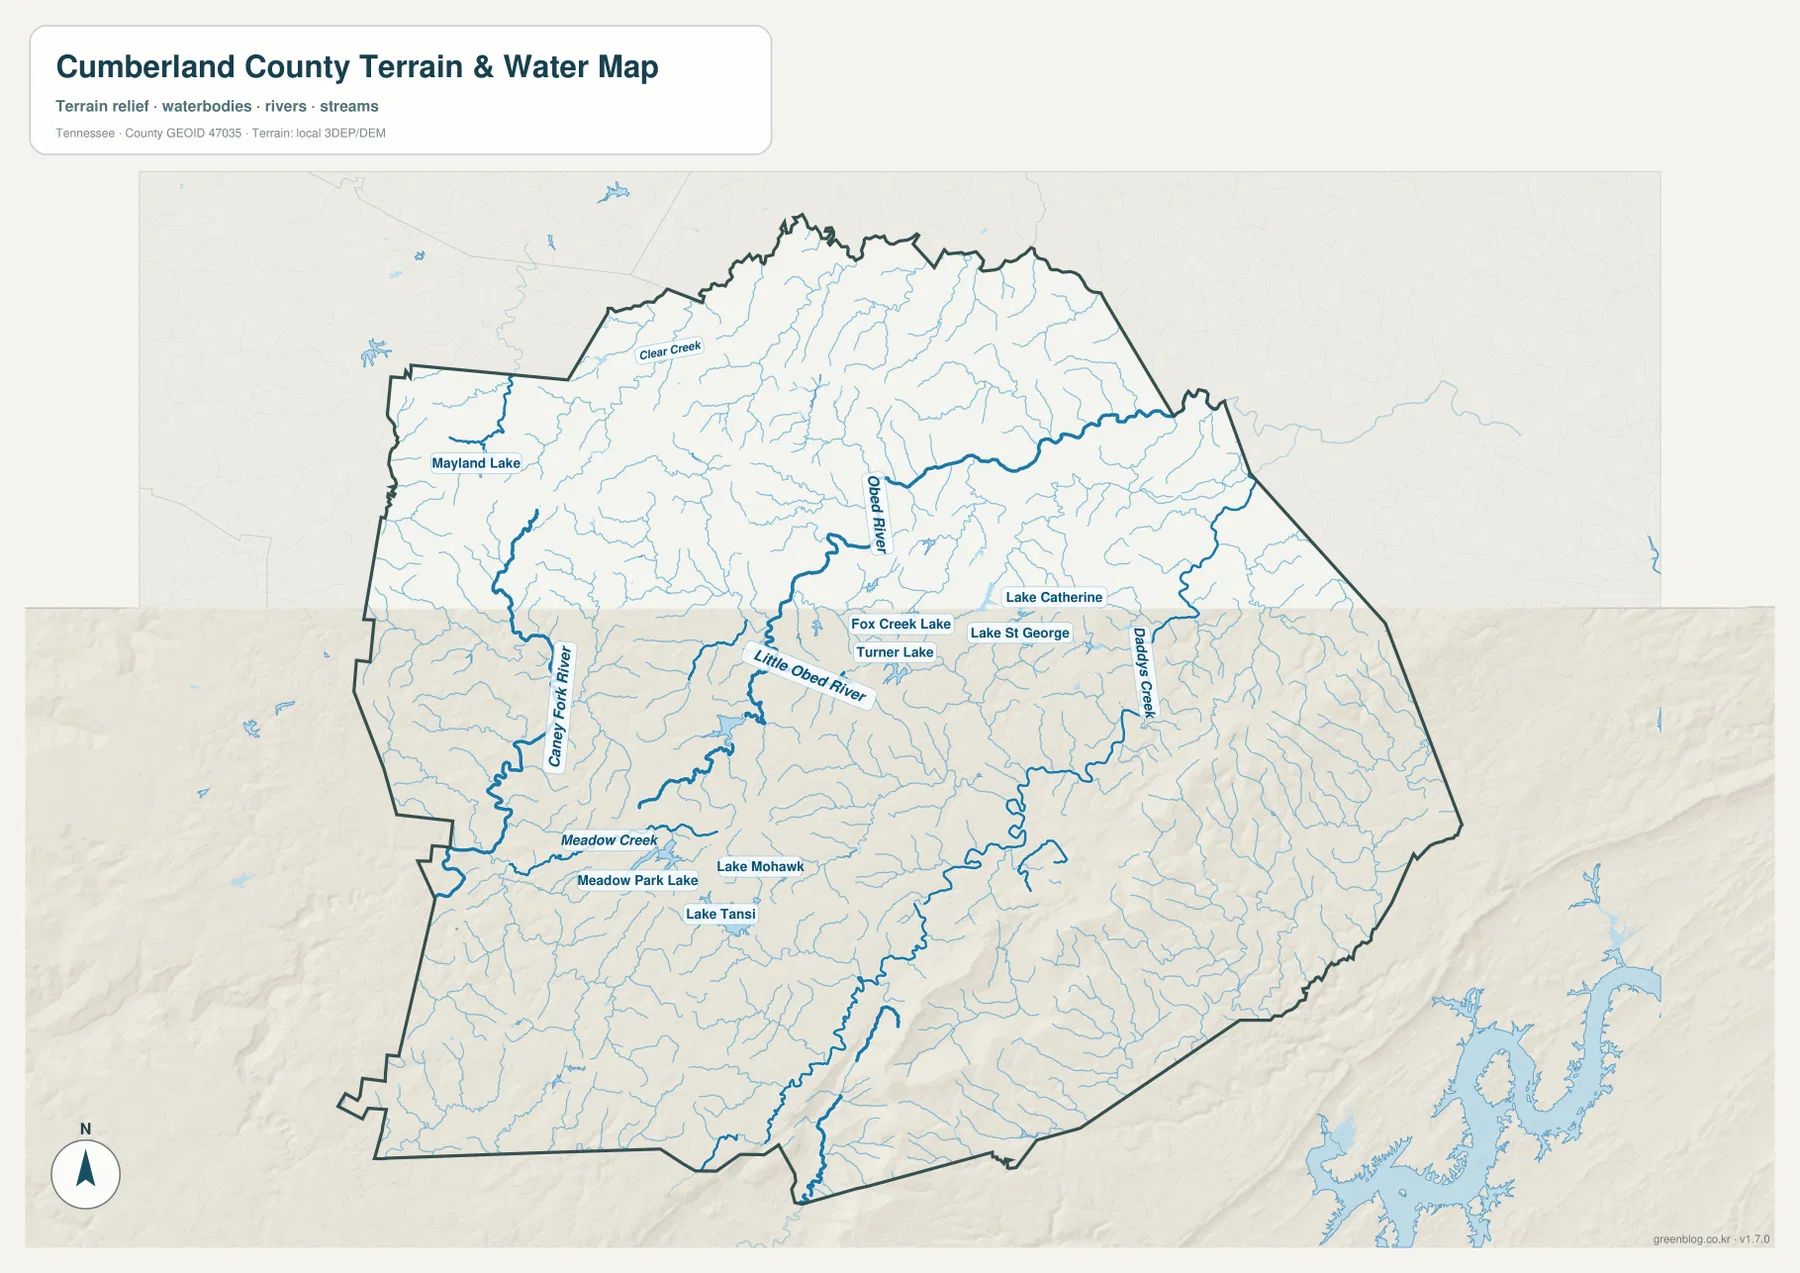
The water map is especially detailed around the middle of the county. The Obed River runs through the central and northern area, with the Little Obed River joining the network near Crossville. Daddy’s Creek follows the eastern side, while the Caney Fork River and Meadow Creek occupy the western and southwestern part of the map. Clear Creek is labeled farther northwest. Together, these streams show a county divided by many valleys rather than by one dominant river channel.
Several lakes provide useful local landmarks. Mayland Lake appears in the northwest, Fox Creek Lake and Turner Lake are close to the Crossville area, and Lake Catherine and Lake St George sit farther east. Meadow Park Lake, Lake Mohawk, and Lake Tansi form another group in the southwest. Their distribution matters because two places that look close on the road map may sit on opposite sides of a creek valley or lake basin.
This water layer is a location reference, not a flood, navigation, or parcel map. Shorelines and water levels can change, and the image does not provide depth, current boating conditions, property boundaries, or real-time flood information. Those uses require current information from the responsible agencies.
From the plateau surface to 926-meter ridges
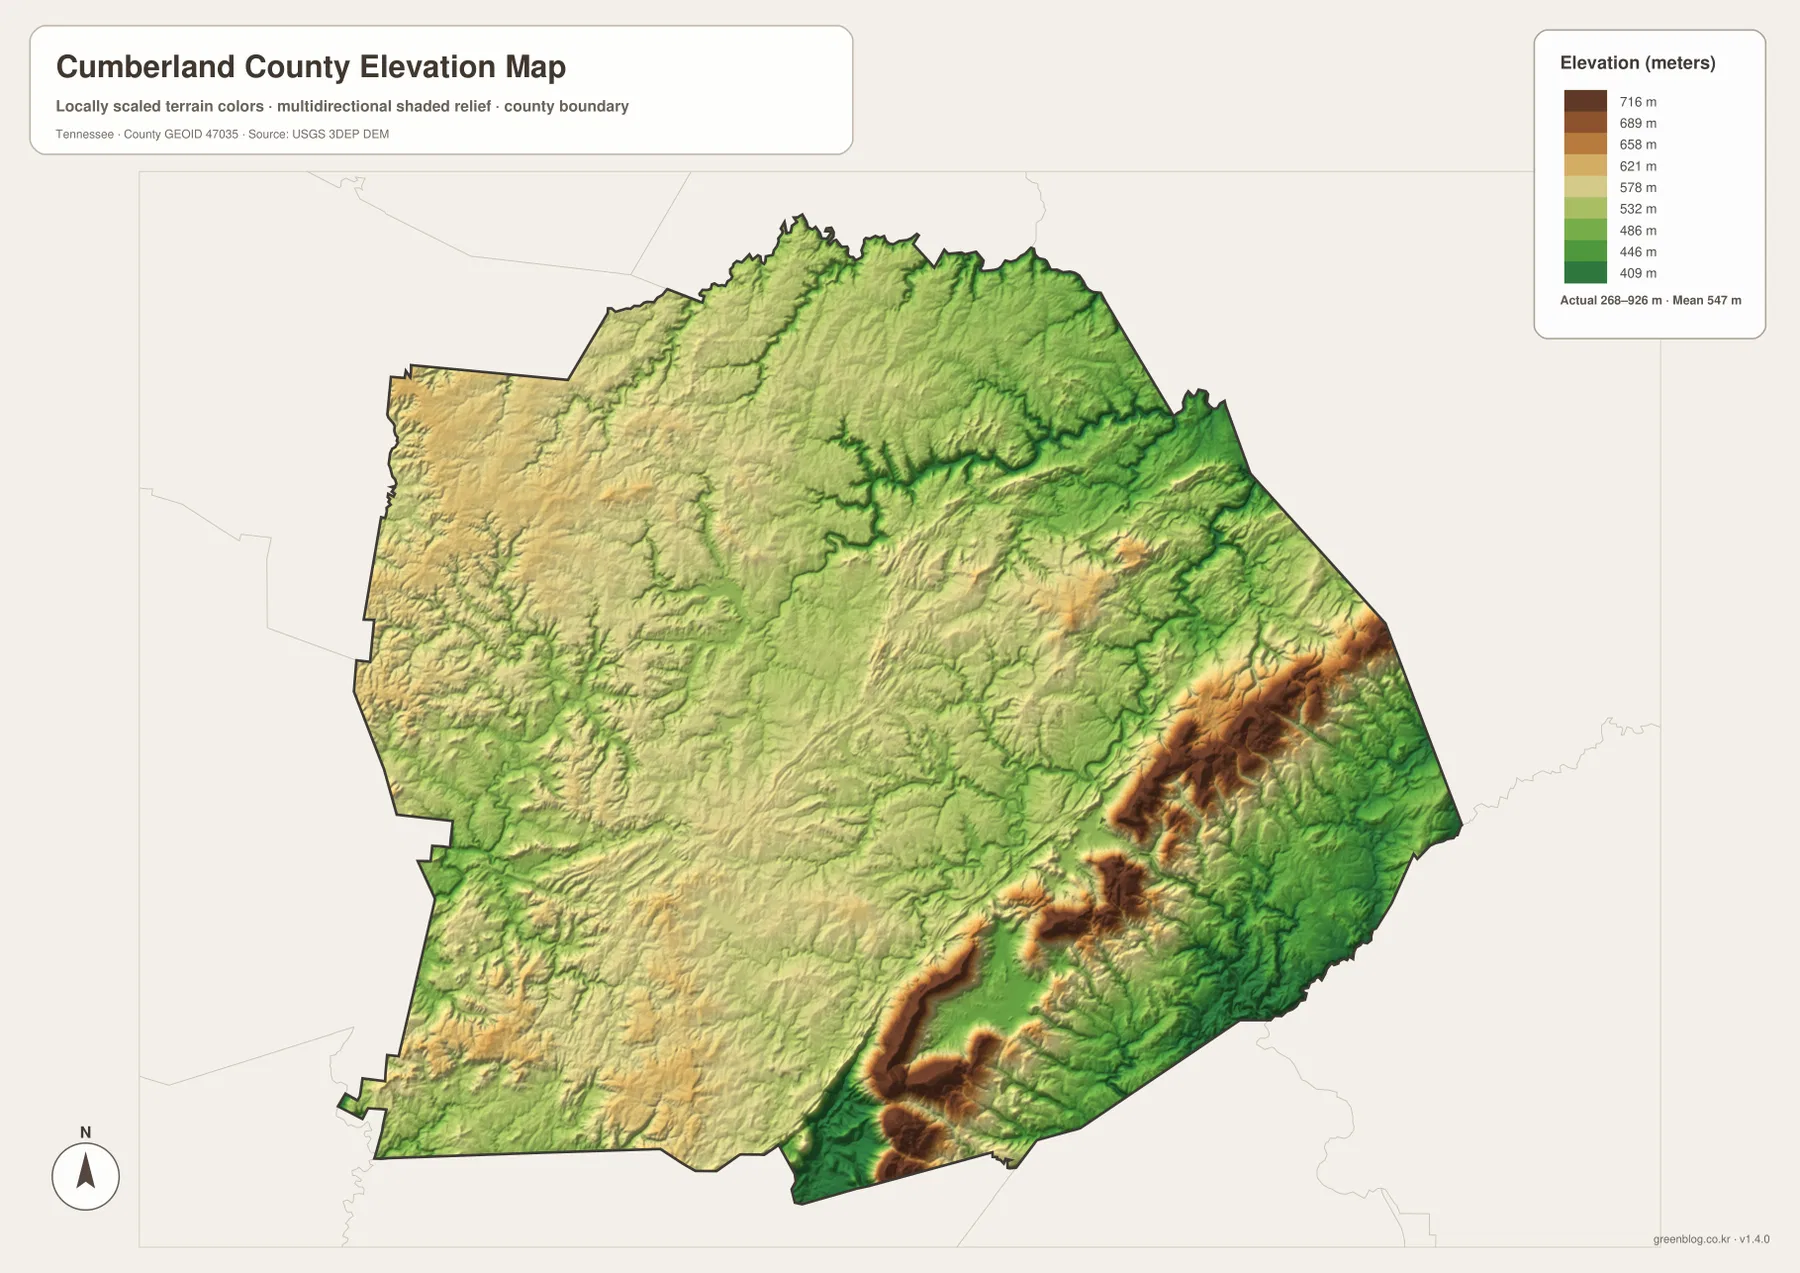
The elevation map records an actual county range of about 268 to 926 meters, with a mean elevation near 547 meters. Much of the central and northern county appears as broad plateau terrain, but the eastern and southeastern side changes sharply. Long brown and tan ridges rise well above the surrounding green valleys, especially east and southeast of the Crossville-Crab Orchard area.
Lower ground often follows the drainage network. Narrow valleys trace the Obed River and its tributaries, and similar cuts appear between the higher ridges on the eastern side. The contrast is important because a countywide mean cannot describe both the relatively open plateau around Crossville and the steep high ground near the eastern boundary. Looking at the full relief map makes that difference much clearer.
The shaded elevation surface is intended for county-scale comparison. It should not be treated as a survey, engineering plan, or site-specific slope measurement. Detailed construction, parcel, or field work requires the original elevation data or a professional survey at the appropriate scale.
How roads, water, and relief change across the county
Travel directions from Crossville look different once the water and terrain layers are considered. Going east on I-40 brings the route toward Fairfield Glade and the higher terrain near Crab Orchard, while western approaches toward Pleasant Hill and Mayland stay within a broader, less sharply ridged landscape. Southbound travel on US 127 moves toward Lake Tansi and the southern drainage network. The road map therefore becomes more informative when the valleys and ridges are visible at the same time.
The water and elevation maps also explain why the county contains many small, distinct local areas. The Obed River system cuts a lower corridor through the center and north, Daddy’s Creek occupies a separate eastern drainage, and the Caney Fork River and Meadow Creek define another set of valleys to the southwest. The resulting pattern is not a single flat plateau surface; it is a broad upland broken by rivers, lakes, and higher ridge belts.
Population and area in map context
The supplied county material lists 61,145 residents in the 2020 census and a Census Bureau estimate of 66,300 for July 2025. It also gives 681.3 square miles of land and 3.5 square miles of water. Those figures establish the scale of Cumberland County, but they do not show where residents are concentrated inside the boundary.
The mapped settlement and road pattern gives that total more meaning. Crossville has the strongest concentration of major routes, while Fairfield Glade, Crab Orchard, Pleasant Hill, Lake Tansi, Mayland, and other labels are spread into different parts of the county. High ridges and incised stream valleys also limit where the landscape looks and functions like the flatter ground around the county seat. Countywide density should therefore be understood as an average, not as a description of every community or rural area.
Choosing the most useful map file
Use the county map when you need roads, boundaries, and community names in one view. The city-connections map is better for quickly comparing Crossville with Crab Orchard and Pleasant Hill. The water map is the clearest choice for the Obed River system, Daddy’s Creek, Caney Fork River, and the named lakes, while the elevation map is useful for comparing the broad plateau with the much higher eastern ridges.
For printing, classroom use, local presentations, or your own annotations, the A3 versions provide more room than the on-page previews. The ZIP below contains the same four subjects as high-resolution JPG files.
Frequently Asked Questions
Are the 9-mile and 10-mile city distances driving distances?
No. The city-connections map labels Crab Orchard at about 9 miles and Pleasant Hill at about 10 miles from Crossville using direct straight-line distance. Actual driving mileage depends on the road used and can be longer.
Where does the largest elevation change appear in Cumberland County?
The highest relief is concentrated in the eastern and southeastern ridge belt, while lower valleys follow the Obed River and other streams. The elevation map shows an overall range of about 268 to 926 meters and a mean near 547 meters.
Can the water map be used for flood or boating decisions?
No. It is a county-scale reference showing rivers, creeks, and lakes. It does not provide real-time water levels, flood forecasts, depth, navigation hazards, or access rules, so current agency information is still needed for those decisions.
Map File Information
The ZIP contains high-resolution A3 JPG versions of the county, city-connections, water, and elevation maps for Cumberland County.
- Included Files: 4 high-resolution A3 JPG map files shown in this article
- File Type: JPG files in a ZIP archive
- Intended Use: Printing, education, presentations, and map-based projects
Related Maps
Sources and references
County boundaries and base geography can be checked with the U.S. Census Bureau TIGER/Line files. Population and county figures are available through U.S. Census Bureau QuickFacts and the Census Gazetteer Files.
For local background, see the Tennessee State Library and Archives Cumberland County fact sheet. The USGS 3D Elevation Program is also a useful reference for elevation data.
Green Map creates custom-edited map images using open geographic data sources such as geoBoundaries, Natural Earth, OpenStreetMap, and government open data. These maps are edited visual materials, not raw data files, and are provided for education, documents, presentations, and graphic reference.