The Winston County Alabama Land Cover Map set is built around a simple visual fact: forest covers most of the county, while farms, developed areas, and water break that forest into smaller patterns. The 2025 summary assigns 67.02% of the county to forest. A branching water system stands out in the southeast, and developed cover appears in several compact clusters rather than as one broad urban block.
Four complementary views are included on this page: general land cover, forest and farmland, impervious surface, and mapped class differences between 1985 and 2025. The four original JPG files are available together in one download near the end of the article. Each JPG is 2480 × 1754 pixels. The WebP images in the article are lighter previews intended for on-screen reading.
Table of Contents
A forested county with water concentrated toward the southeast
Forest is the dominant 2025 land-cover class at 67.02%. Agriculture accounts for 12.92% and developed cover for 8.07%, followed by grassland at 4.21% and shrubland at 3.56%. The distribution matters as much as the percentages. Dark green forms broad connected areas across the north and center, while agricultural colors become more frequent toward parts of the west, southwest, and east. Water is not evenly scattered; the most obvious blue pattern is a long, branching system in the southeastern part of the county.
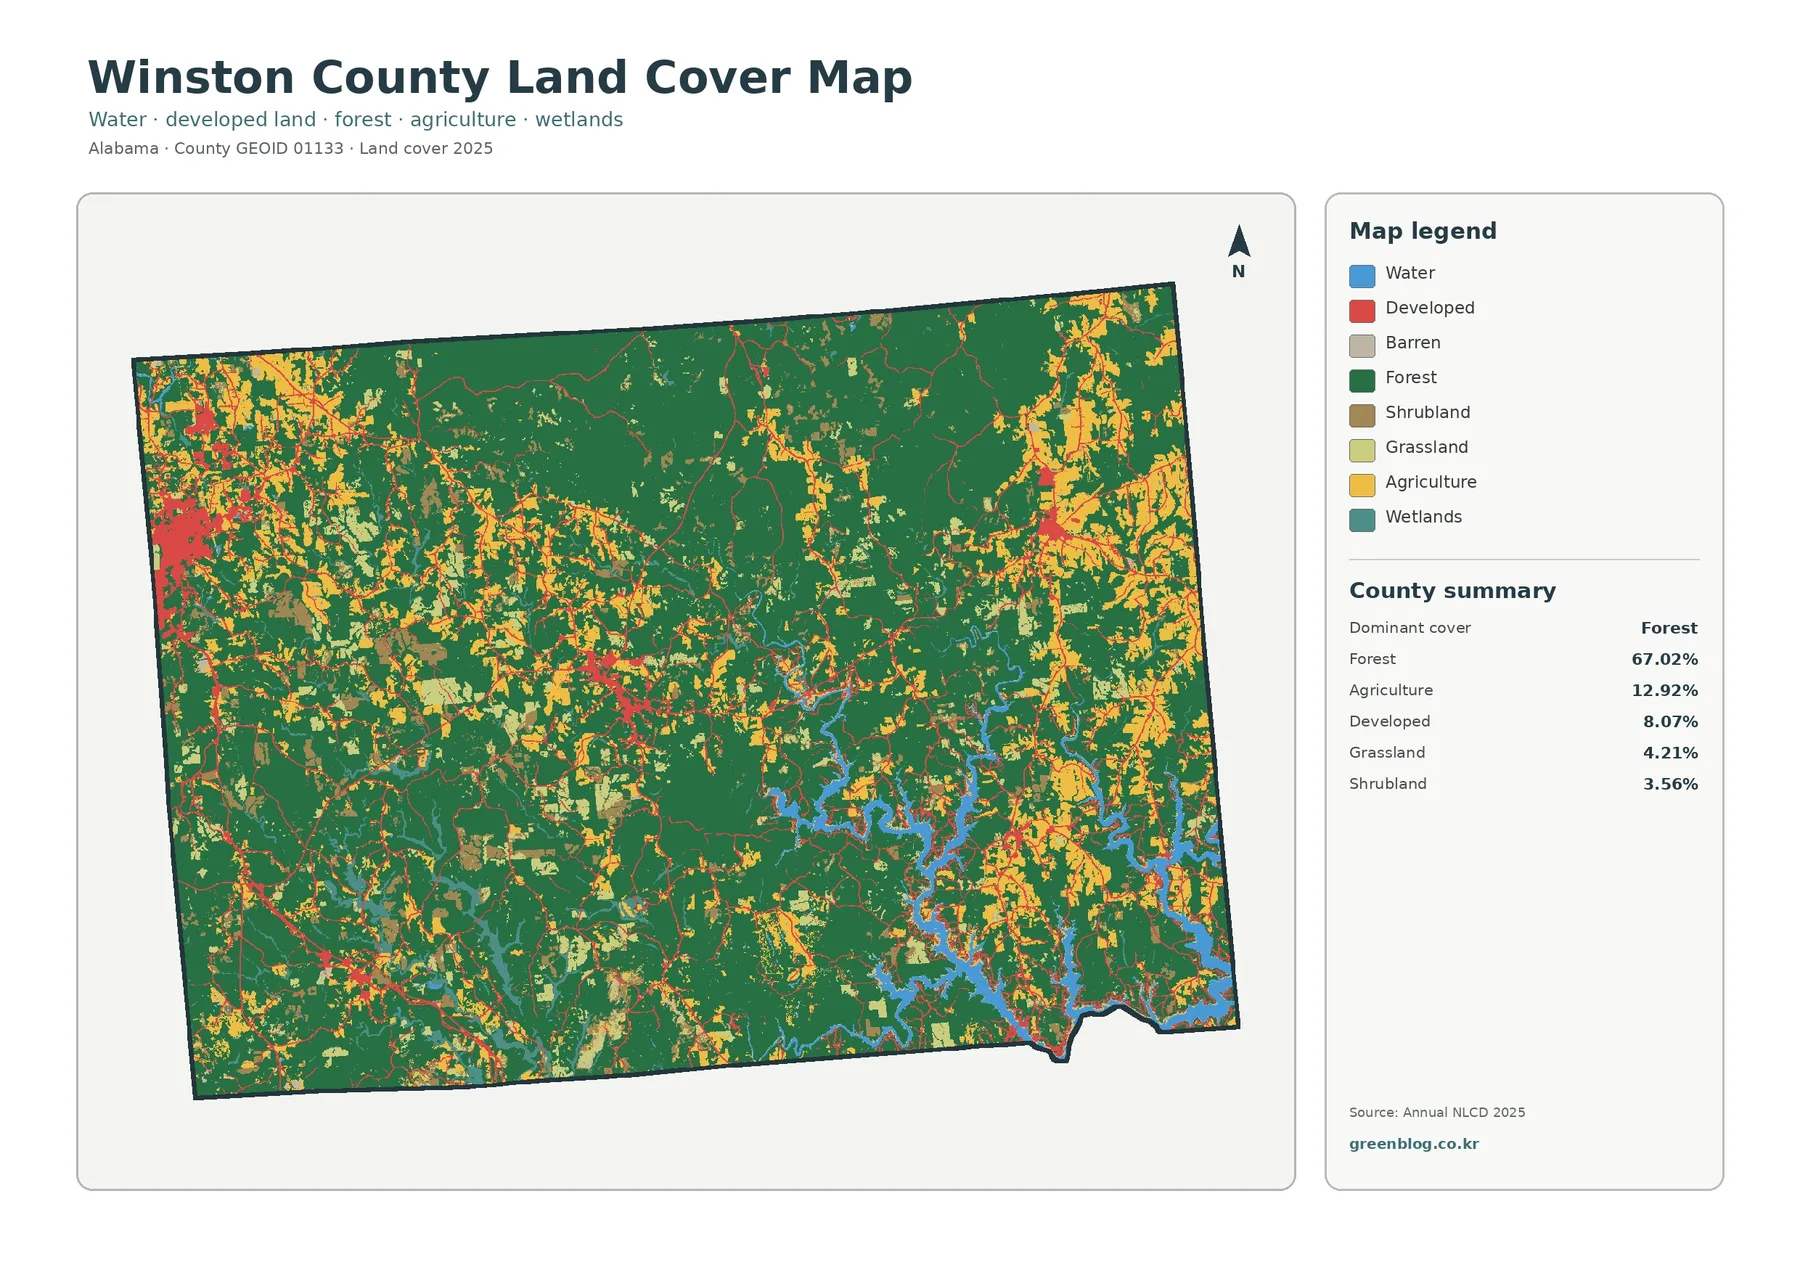
This is a land-cover map, not a zoning or ownership map. A green cell means that forest was the predominant surface class assigned to that raster cell; it does not tell the reader whether the land is public, private, protected, or available for development. Likewise, a developed class does not identify a commercial district or municipal boundary. The map is most useful for seeing broad surface patterns across the county, especially when it is compared with the more specialized views below.
Winston County also has a useful real-world reference for its large forest share. The U.S. Forest Service identifies Bankhead National Forest as lying in Winston, Lawrence, and Franklin counties. Forest Service material describes the Bankhead landscape as dissected plateaus with an extensive stream network. That information helps explain why forest and water are important geographic contexts here, although the supplied land-cover map does not draw the boundary of the national forest and should not be used to infer land ownership.
Impervious cover remains small at the county scale
Impervious surface means pavement, rooftops, parking areas, and similar surfaces that prevent or sharply reduce water infiltration. The countywide mean in the supplied 2025 map is 1.47%. Only 0.50% of the mapped area is classified as 50% or more impervious. Those numbers are much lower than the 8.07% developed-cover figure because the two measures describe different things. Developed land can include lawns, trees, bare soil, and other surfaces that still allow some water to enter the ground.
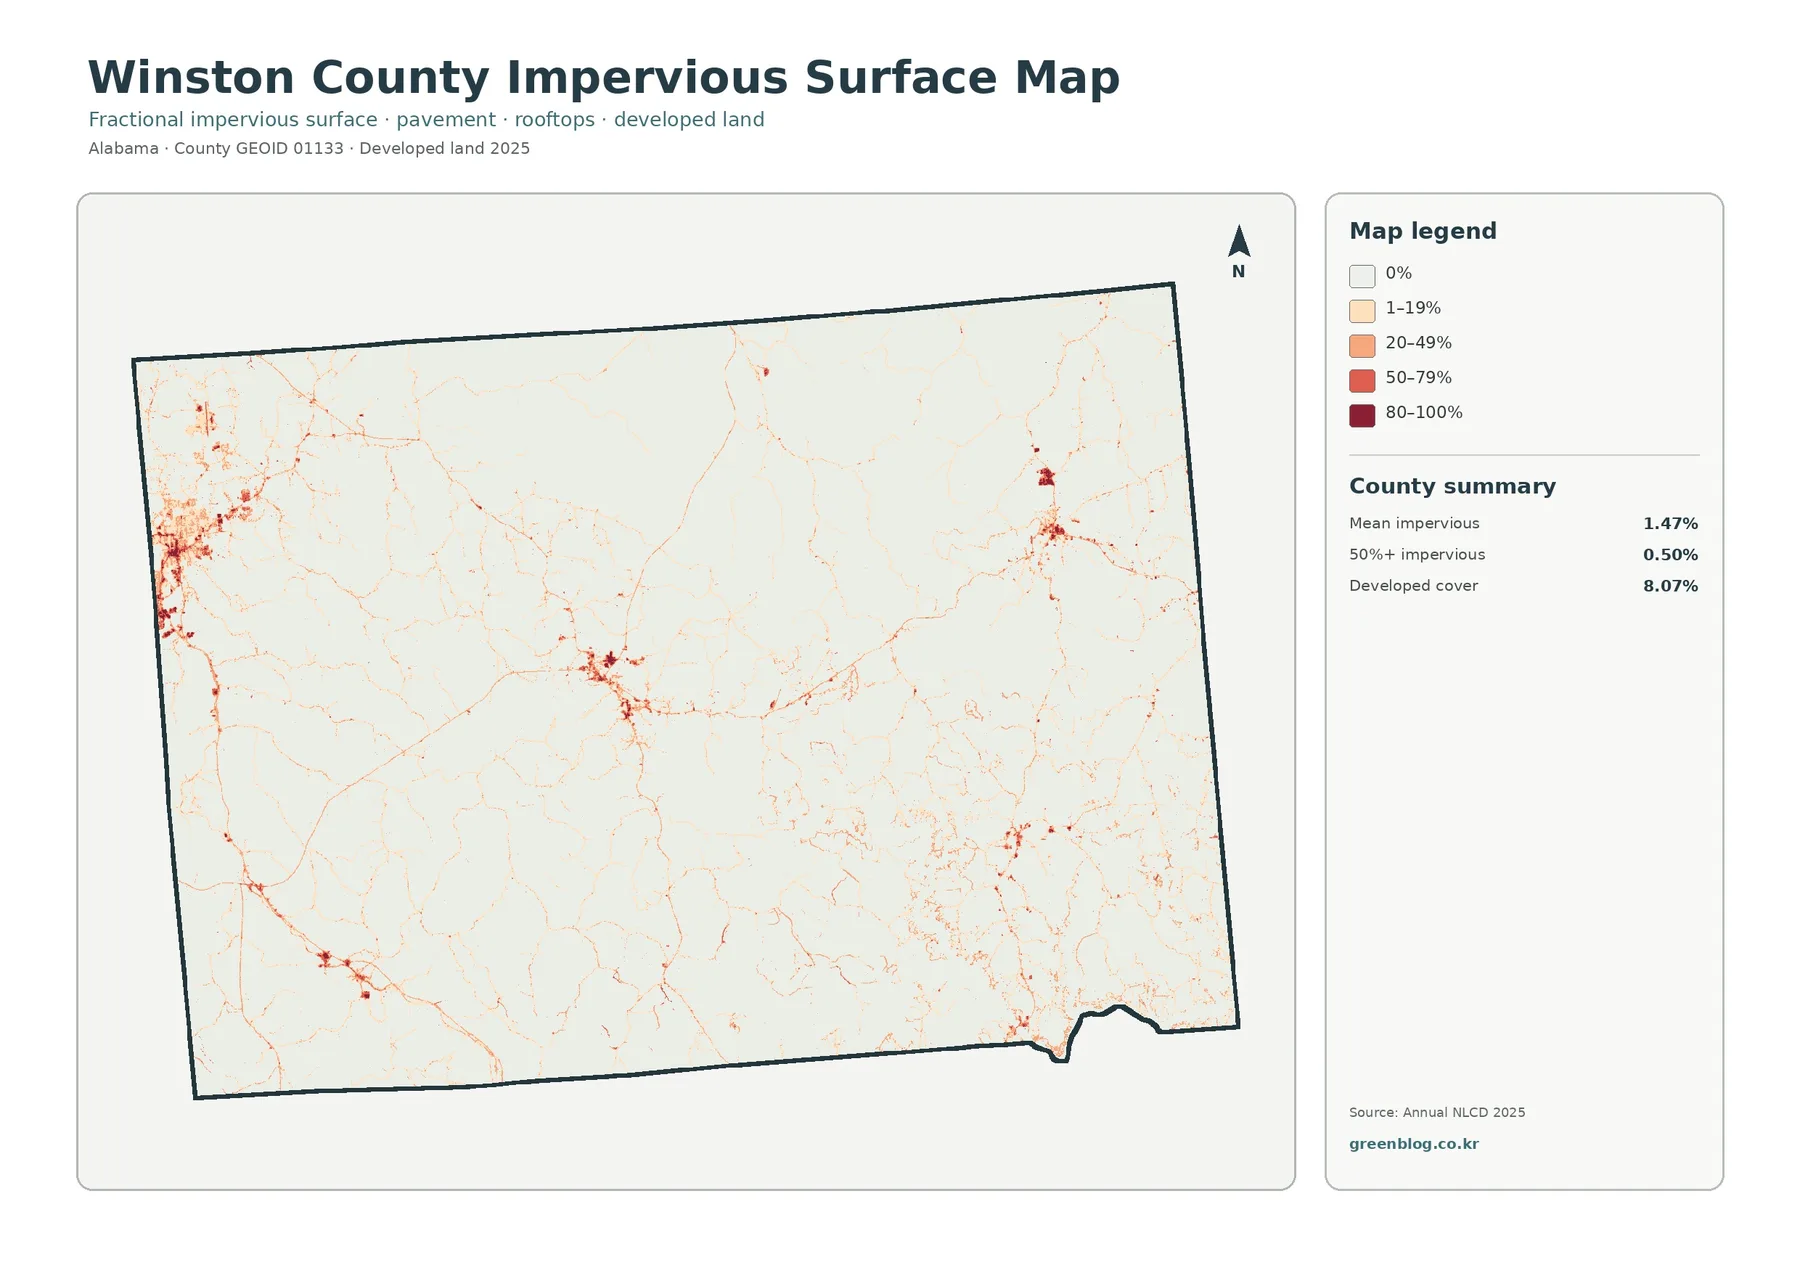
The impervious map is useful precisely because it strips away most other land-cover colors. Several compact concentrations appear along the western edge, near the central part of the county, and at a few eastern and southeastern locations. Thin lines extend between some of these clusters, reflecting roads and other hardened surfaces. Large areas remain very pale, reinforcing the point that Winston County is not covered by a continuous high-impervious urban footprint.
That pattern can support watershed or classroom discussions, but proximity should not be confused with cause. A road that appears near a stream does not prove that the road caused a water-quality problem, and a developed cluster near a lake does not establish flood risk. Questions about runoff, drainage, water quality, or flooding require rainfall, elevation, soils, engineering data, and current hydrologic information in addition to land-cover imagery.
Forest and farmland become easier to compare when development is muted
The forest-and-farmland view simplifies the legend so readers can focus on forest, cropland, pasture or hay, shrub and grass cover, wetlands, and water. Forest still occupies 67.02%, while the broader agriculture category totals 12.92%. Water is listed at 2.42% and wetlands at 1.59%. The reduced color set makes it easier to see that agricultural and open-cover patches are dispersed through the county rather than forming one uninterrupted agricultural plain.
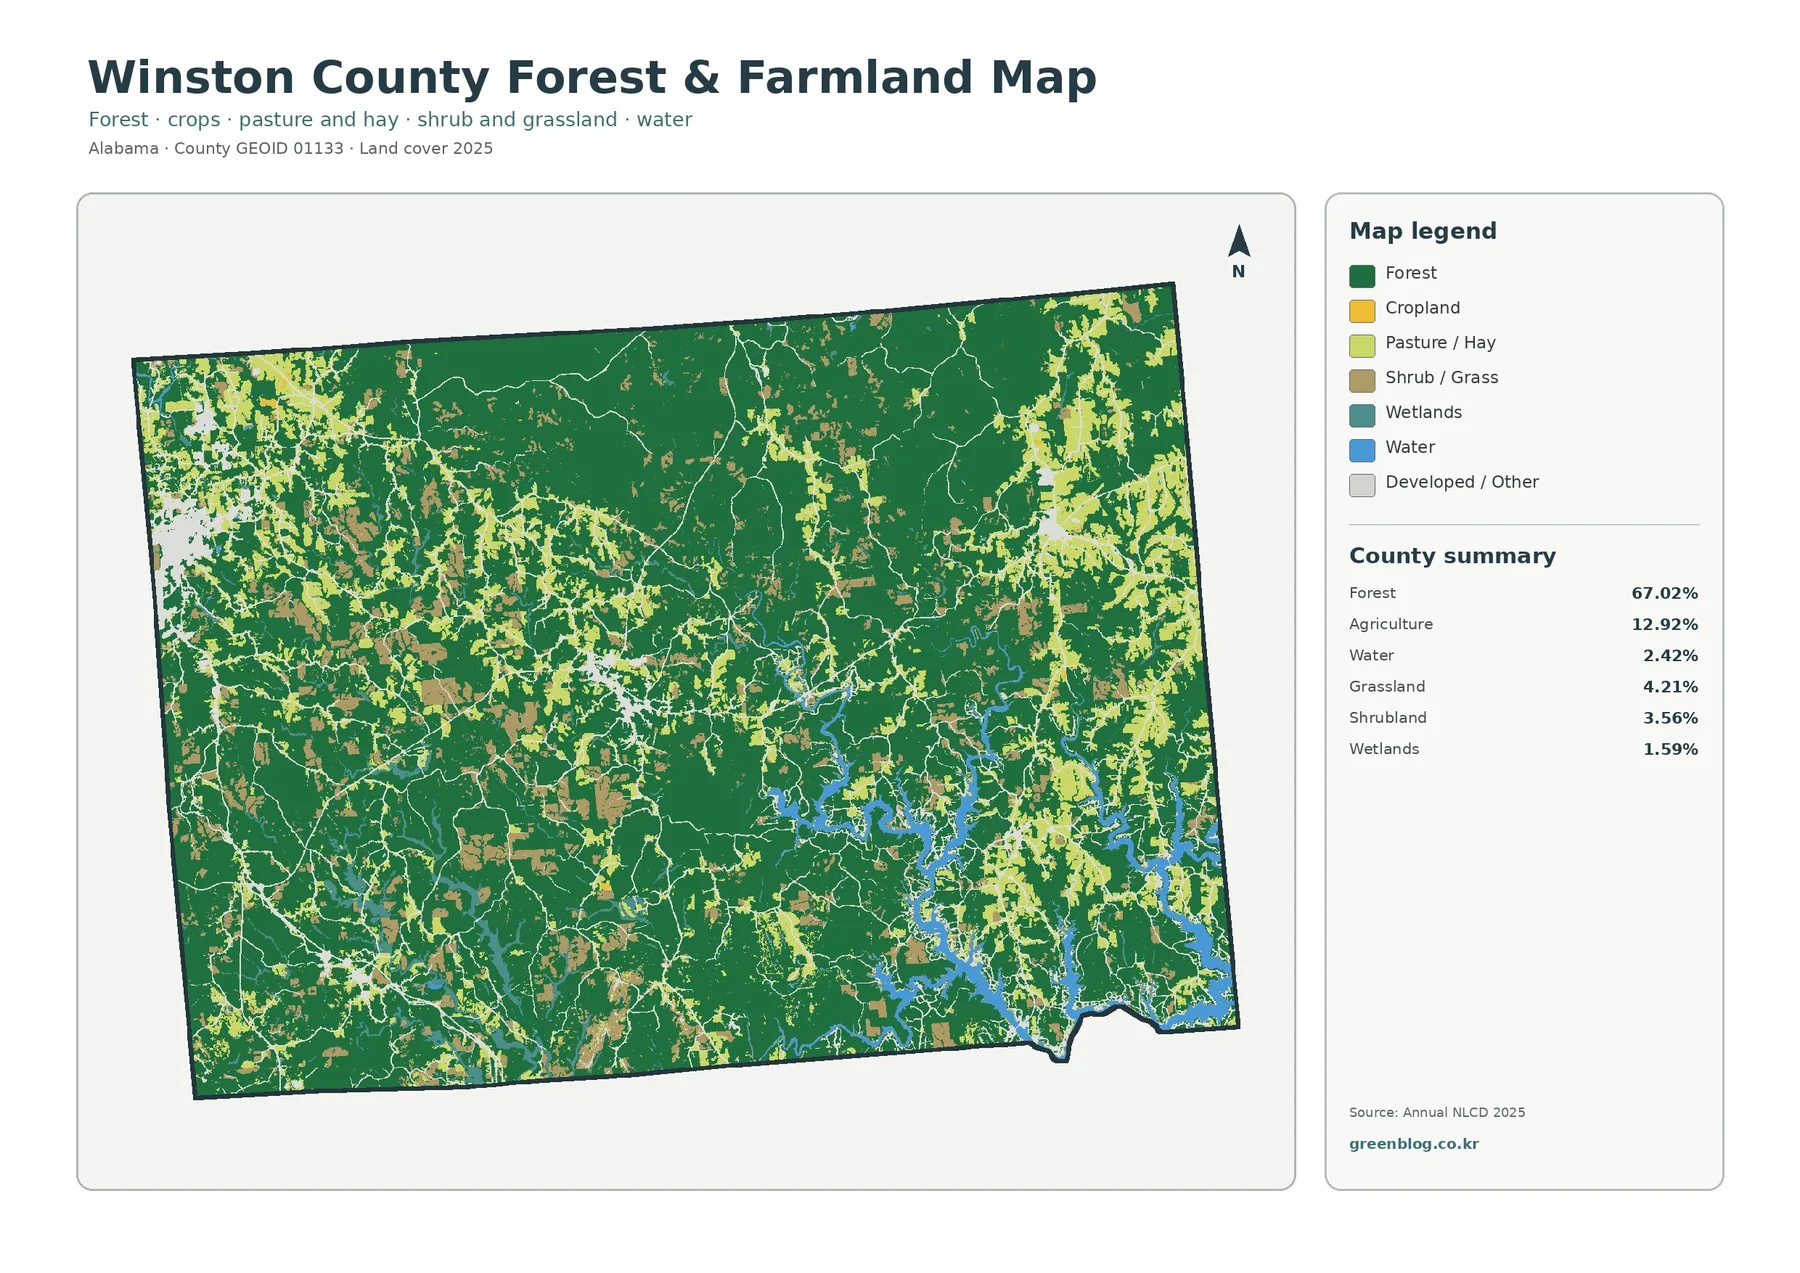
Open agricultural colors are more frequent in parts of the west and southwest and also appear in smaller areas toward the east. They remain surrounded by extensive forest in many places. This is a better map for comparing those transitions than the general land-cover image, because developed and miscellaneous classes are visually reduced. It is still not a field-boundary map. A 30-meter cell can contain more than one surface type, so small fields, narrow tree lines, farm roads, and individual buildings may be generalized.
The southeastern water pattern provides another strong point of reference. The U.S. Forest Service describes Corinth Recreation Area as being on the upper part of Lewis Smith Lake in Winston County. The branching reservoir-like shape in the supplied maps aligns with that local water context. Forest reaches many of the visible shorelines, while other open or developed patches appear nearby. The image can therefore help with broad landscape comparison around the lake, but it does not provide water depth, shoreline ownership, navigation information, or regulatory flood zones.
What the 1985–2025 change map actually measures
The change view compares the mapped land-cover classes for 1985 and 2025. The county summary reports class differences across 33.32% of the mapped area. That figure is not an urban-growth rate. The legend separates several types of differences, including 2.26% classified as a transition to developed cover, 9.22% forest loss, 2.24% agricultural loss, and 19.50% in other class differences. The map also warns that some differences may include classification variation.
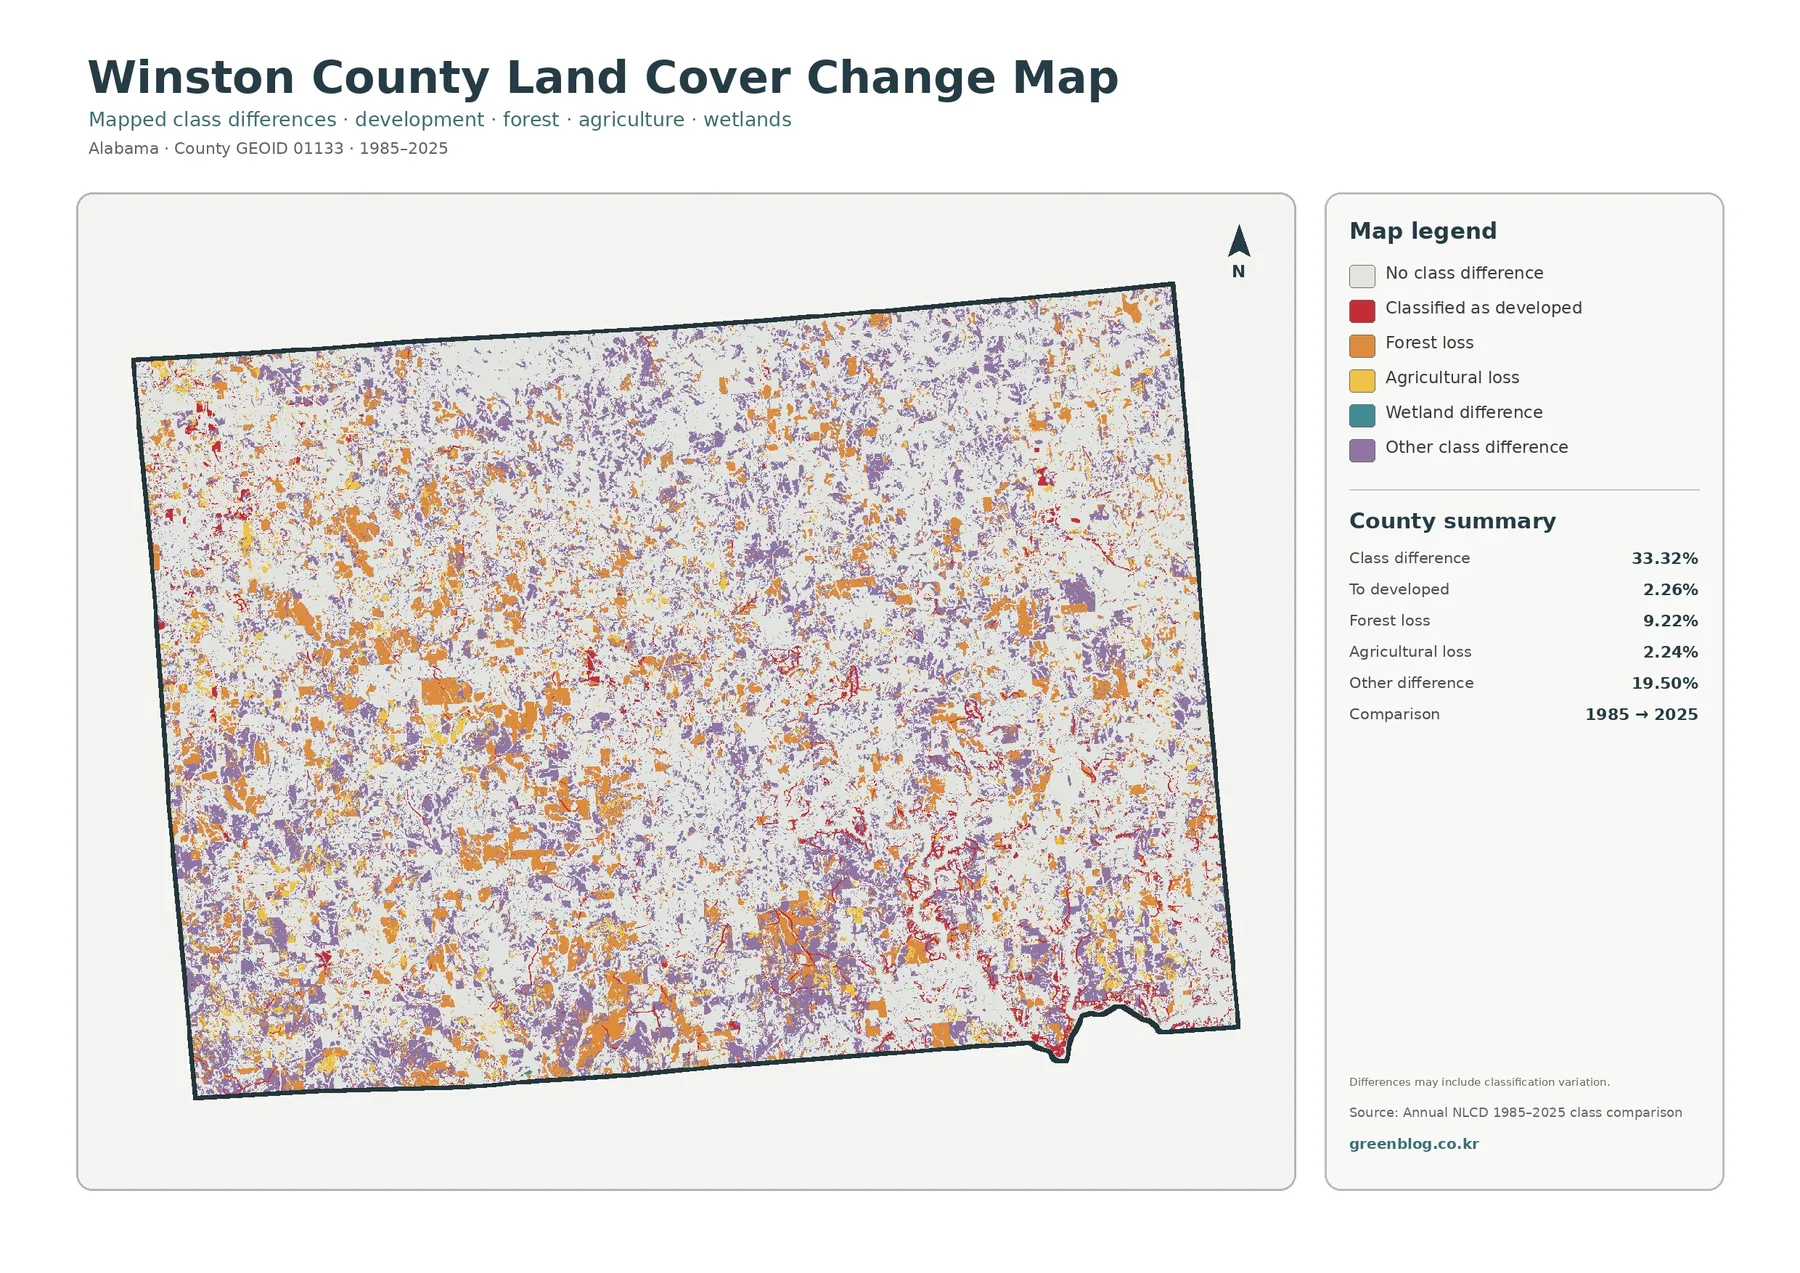
The visual effect is busy because several change categories are distributed throughout the county. Orange, red, teal, and purple cells do not all represent the same process. A purple cell belongs to an “other class difference” category, while orange and red have different meanings. The broad white or very light background represents locations where the compared classes did not differ under this map’s rules. Reading the legend first prevents the common mistake of treating every colored cell as development.
Annual NLCD Collection 1.2 includes 2025 and is produced at 30-meter spatial resolution. That is appropriate for county-scale comparisons, but it is coarser than a parcel survey or a site plan. A cell near a forest edge, farm boundary, road, or shoreline may contain several real-world surfaces. Changes in the dominant class can therefore reflect actual surface change, mixed pixels, or classification uncertainty. For a specific site, the change map should be followed by newer aerial imagery and locally relevant records.
A practical way to use the four maps
Start with the general map when the question is simply “what covers most of Winston County?” It establishes the forest majority and the location of the largest water feature. Move to the forest-and-farmland view when the question concerns open agricultural areas or the relationship between forest and water. Use the impervious map for settlement and hardened-surface patterns. Finish with the change map only after the current landscape is clear, because the change colors make more sense when the 2025 baseline is already familiar.
For environmental education, students can compare the 67.02% forest share with the map itself and then look for places where agriculture or development interrupts large forest blocks. A watershed lesson can pair the water pattern with impervious cover and discuss why additional rainfall and drainage data would be needed before making runoff claims. In presentations, the four views work well as a sequence because each removes some visual complexity and answers a more focused question.
Local context can be added without turning the map into an ownership map. Bankhead National Forest is a verified forest presence in Winston County, and Lewis Smith Lake is a verified water feature along the county’s recreation landscape. Those references help readers connect the color patterns to recognizable places. They should not be used to redraw property boundaries, determine federal ownership from pixels, or assume that every forested area belongs to the Forest Service.
Download the four Winston County JPG maps
Scale, date, and interpretation limits
The maps summarize broad surface classes rather than legal land use. They cannot identify zoning, parcel ownership, timber rights, conservation easements, or buildable acreage. A mapped forest cell can occur on private or public land. A developed cell can contain substantial vegetation. A water or wetland class is not a substitute for a jurisdictional wetland determination or a current flood map.
Date matters as well. The present-day maps represent the supplied 2025 classification, while the change view compares 1985 with 2025. Construction, timber harvest, agricultural conversion, shoreline work, or other changes after that observation year are not represented. Anyone making a current site-specific decision should combine this county map with recent aerial imagery, field observations, and the appropriate local or federal datasets.
The downloadable files are 2480 × 1754 pixels. They preserve the supplied original size, but the asset manifest does not mark them as meeting an A3 high-resolution reference. Keep the aspect ratio intact when printing, and make a test print before using a large physical format. The maps are strongest as county-scale references where the legend and overall distribution remain readable.
Frequently Asked Questions
What is the dominant land cover in Winston County?
Forest is the dominant 2025 class at 67.02%. Agriculture is 12.92% and developed cover is 8.07%. Forest is widespread across the county, but the maps also show agricultural patches, compact developed areas, and a prominent water system in the southeast.
Why is developed cover 8.07% when mean imperviousness is only 1.47%?
Developed land and impervious surface are different measures. A developed land-cover cell may include lawns, trees, soil, and other permeable surfaces around roads or buildings. Imperviousness estimates the fraction occupied by hardened surfaces such as pavement and rooftops, so the countywide mean can be much lower.
Does 33.32% class difference mean one-third of the county was developed?
No. The 33.32% value describes all mapped class differences between 1985 and 2025 under this comparison. Transition to developed cover is separately reported at 2.26%. Forest loss, agricultural loss, other class differences, and possible classification variation also contribute to the change map.
What is included in the download?
The ZIP includes four original 2480 × 1754 JPG files: the general land-cover map, forest-and-farmland map, impervious/developed-land map, and 1985–2025 land-cover-change map. The WebP images in the article are separate screen previews.
Map File Information
Winston County Land Cover Map Files
- Included Files: Use only the versions confirmed in the article and supplied images
- File Type: Use the confirmed download contents
- Intended Use: Printing, education, presentations, and map-based projects
Related Maps
- Autauga County Alabama Land Cover Map
- Baldwin County Alabama Land Cover Map
- Barbour County Alabama Land Cover Map
Sources
- MRLC Annual NLCD Data — source access for annual land-cover and impervious products
- USGS Annual NLCD Collection 1.2 Land Cover — 2025 coverage and 30-meter raster specifications
- U.S. Census Bureau TIGER/Line Shapefiles — county boundary reference and geographic identifiers
- USDA Forest Service, National Forests in Alabama Recreation — Bankhead National Forest and Lewis Smith Lake recreation context in Winston County
Green Map creates custom-edited map images using open geographic data sources such as geoBoundaries, Natural Earth, OpenStreetMap, and government open data.
These maps are edited visual materials, not raw data files, and are provided for education, documents, presentations, and graphic reference.