The Randolph County Alabama Land Cover Map set gives four ways to examine the county’s surface in 2025 and to compare it with a 1985 baseline. Forest is the dominant cover at 58.06%, but the county is not visually uniform. Lake Wedowee creates a large branching water feature in the western part of the county, while the strongest developed cluster appears in the southeast around the Roanoke area. Agriculture, grassland, and shrub cover break up the forest across much of the interior.
This page includes a general land-cover view, a forest-and-farmland view, a fractional impervious-surface map, and a 1985–2025 class-difference map. The WebP images below are previews for reading on the page. The four original 2480 × 1754 JPG maps are available together in one download for classroom work, presentations, reference graphics, and broad county comparisons. They are not parcel, zoning, ownership, flood, or permitting maps.
Table of Contents
Start with the county’s water and settlement frame
A few verified place references make the map patterns easier to orient. Randolph County’s official website identifies Wedowee as the county seat, Roanoke as the largest city, and the Tallapoosa River as a major waterway. It also lists U.S. 431 and Alabama Highways 22, 48, and 77 among the county’s major roads. The land-cover images do not print those labels, so they should not be used as a road map, but this local frame helps explain why the larger developed clusters and the western reservoir occupy the positions they do.
The reservoir is R.L. Harris Reservoir, more commonly called Lake Wedowee. Outdoor Alabama describes it as a reservoir near Wedowee supplied by the Tallapoosa and Little Tallapoosa rivers, with roughly 271 miles of shoreline. Its long, branching arms are easy to recognize in the western half of the land-cover and forest/farmland maps. That feature matters when reading countywide percentages because open water is not merely a scattering of small ponds here; one large reservoir accounts for much of the visible blue area.
The 2025 map is forest-dominant, but agriculture and development interrupt the green
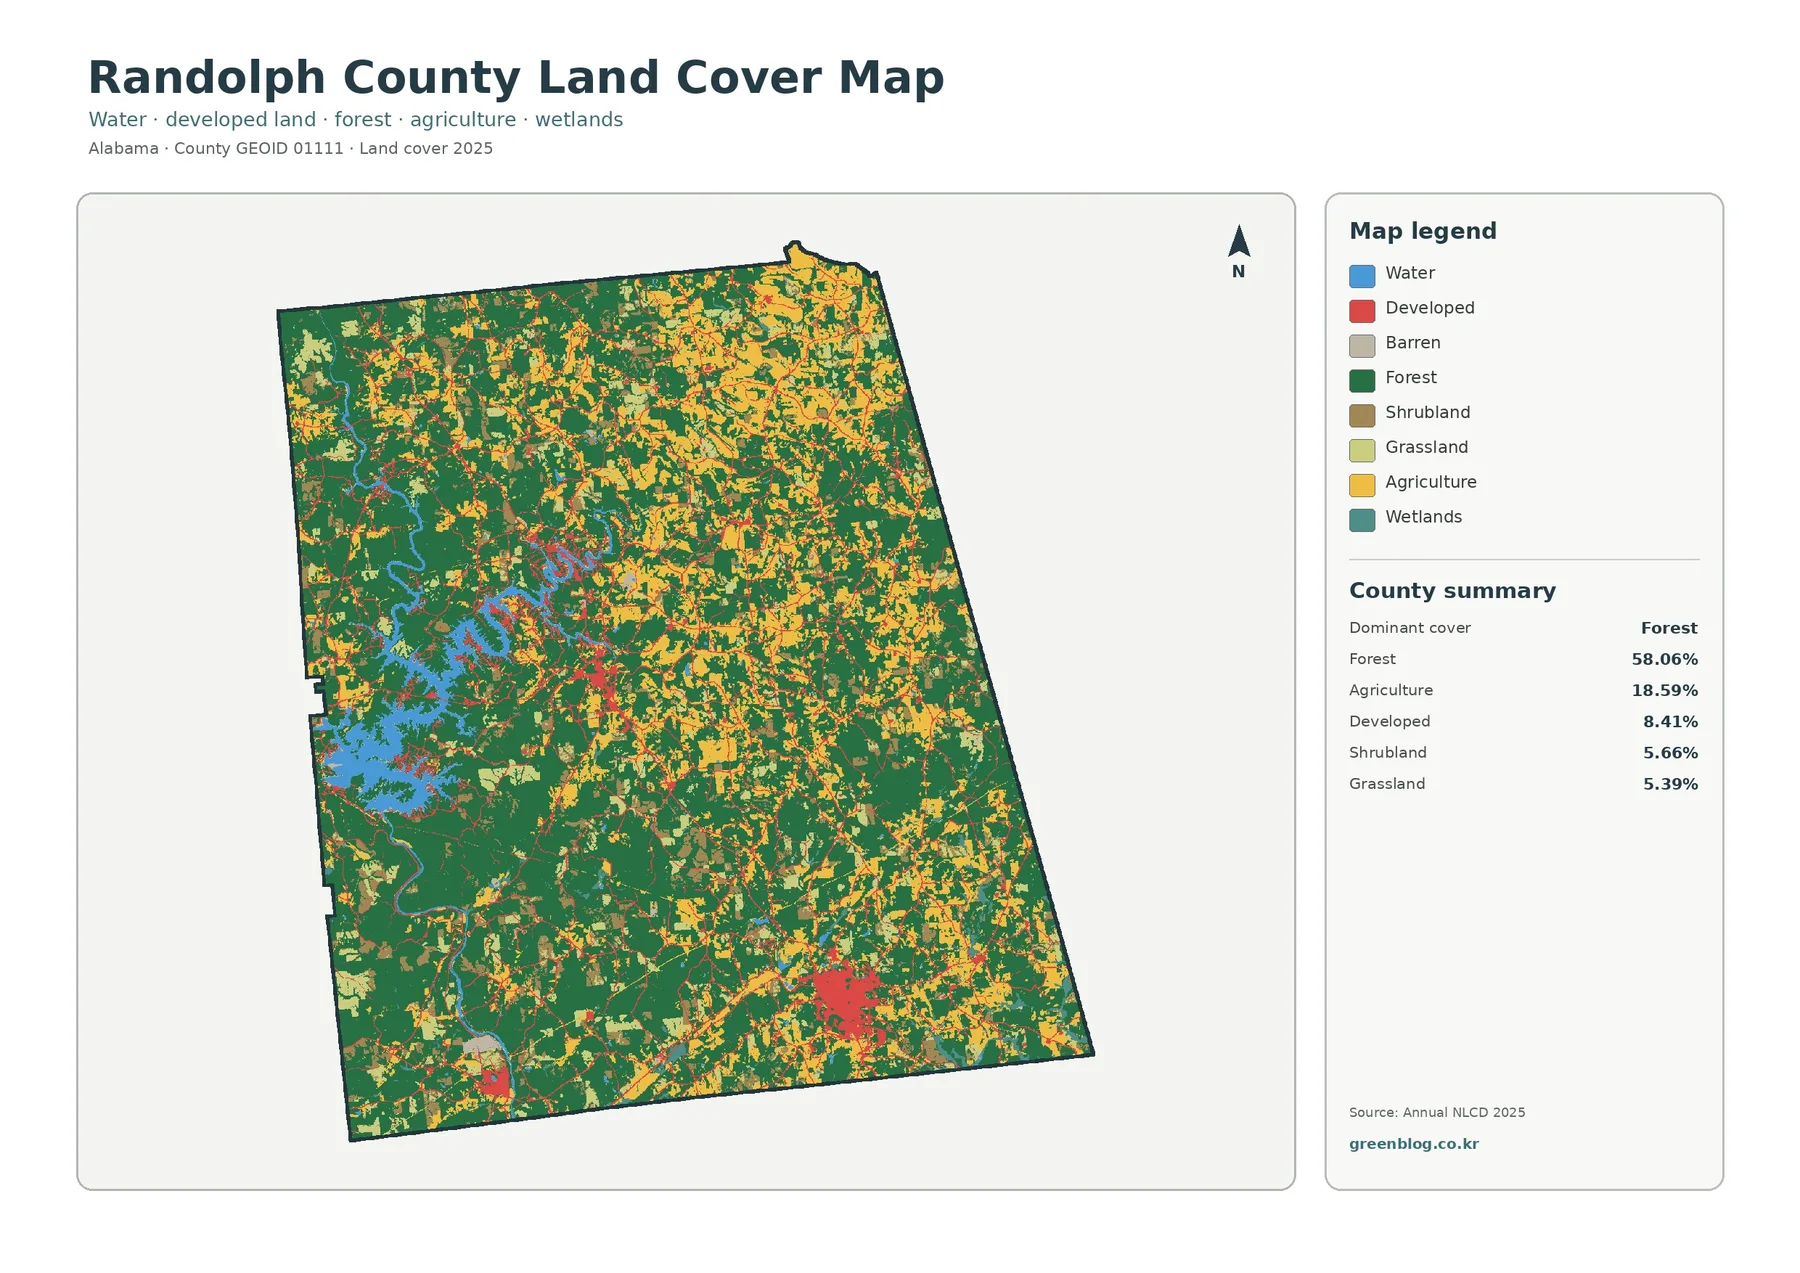
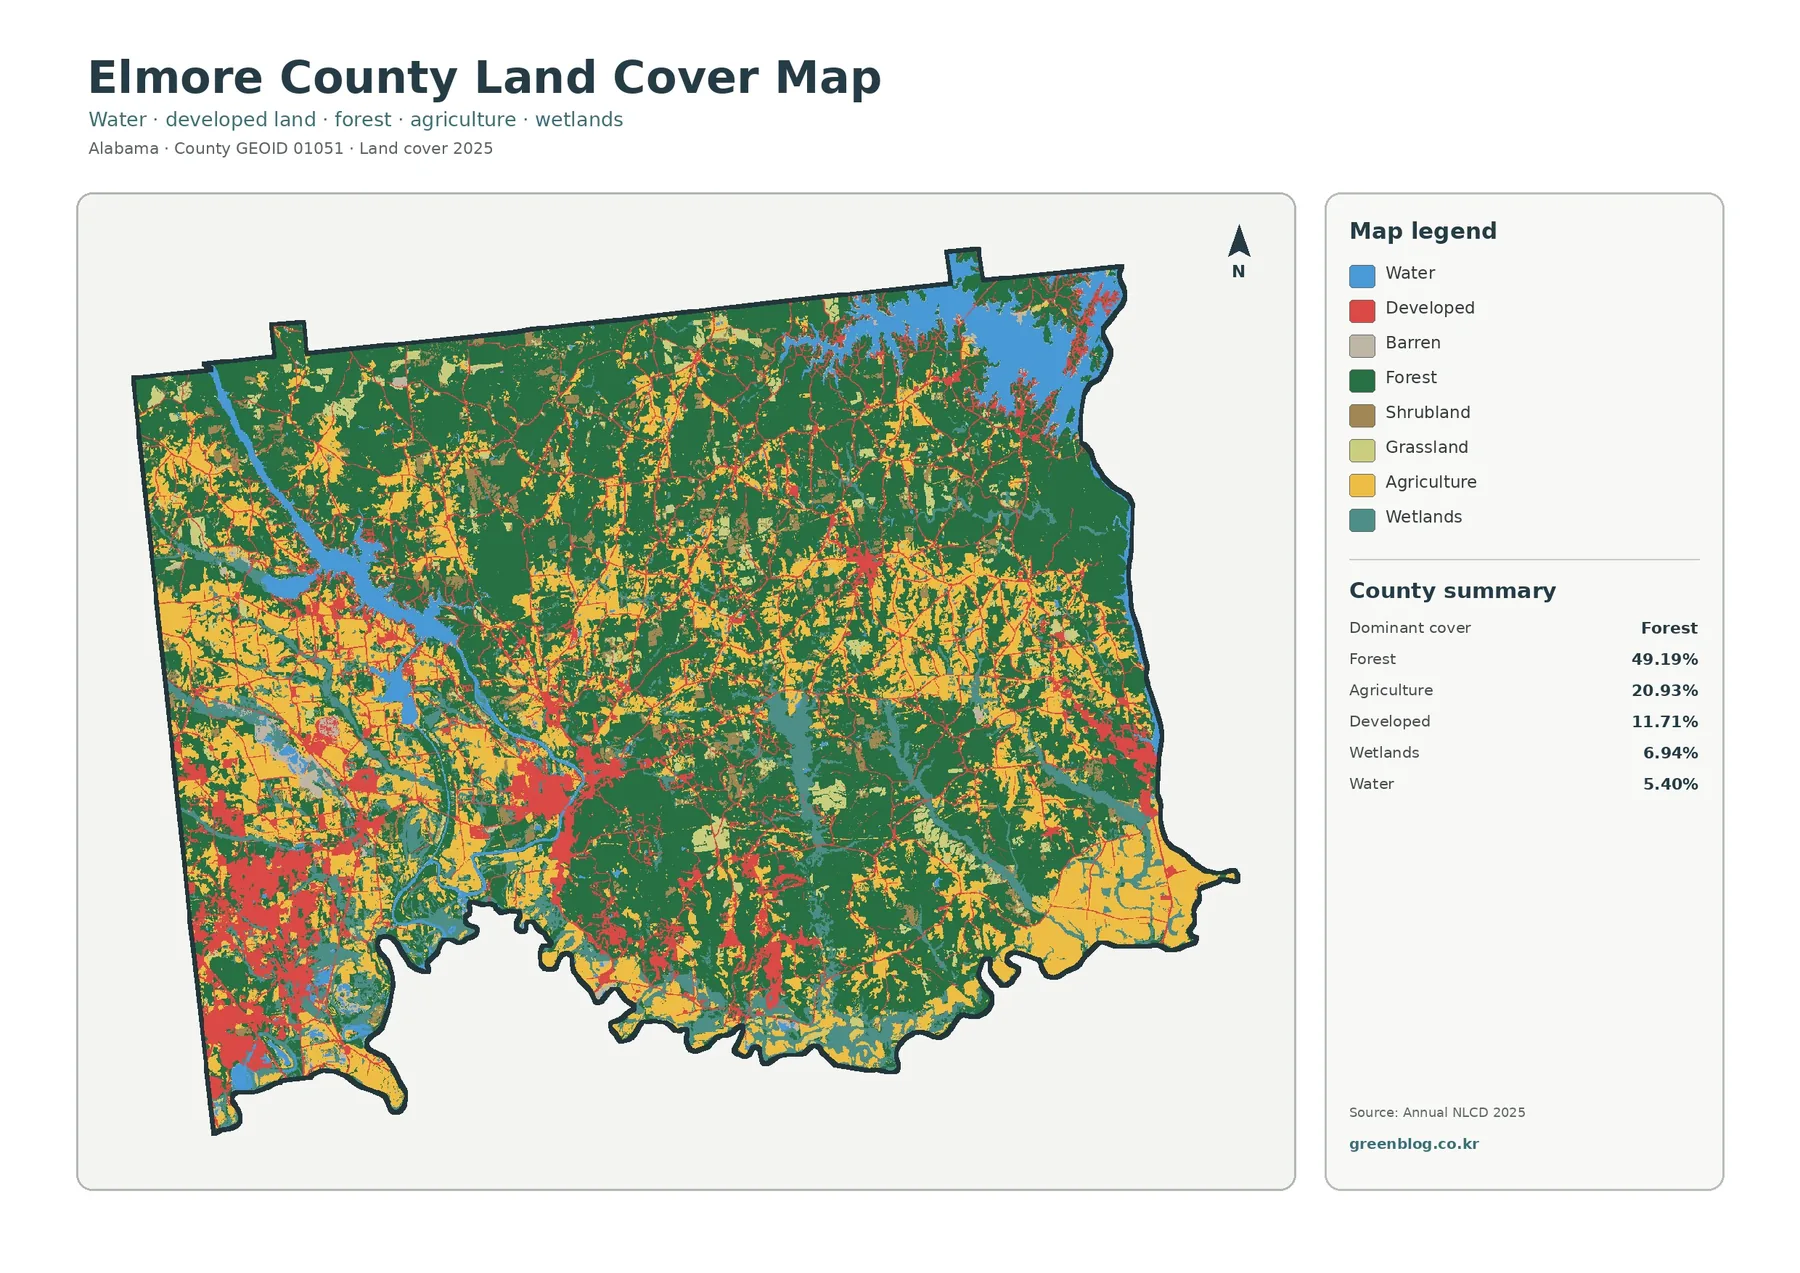
Dark green occupies well over half of the county, with especially broad forest blocks across the southwest, east, and many parts of the north. Yellow agricultural areas are spread through the county rather than confined to a single belt. Some appear as compact fields, while others form irregular groups that sit between forested tracts. This creates a fine-grained rural pattern in the northern and central portions of the map, in contrast with the larger uninterrupted forest areas farther south and west.
Development is much more localized. The largest red concentration sits in the southeast, consistent with the Roanoke area when compared with standard county geography. Another distinct cluster lies toward the center-west around the Wedowee area, with smaller developed patches elsewhere. Because developed cover totals 8.41%, these places are significant at the local scale without turning the county into an urban landscape. Most of the county remains covered by forest, agricultural vegetation, grass/shrub cover, water, and small wetland areas.
Water adds a strong visual contrast. The western reservoir occupies a large branching shape, while narrower blue features extend along connected drainage lines. Wetlands are mapped separately from open water, so a shoreline or stream corridor may contain different categories close together. The map should therefore be read by class rather than by color impression alone: blue water, wetland tones, forest green, and developed red represent different surface conditions even where they occur within the same local landscape.
Removing most developed detail brings the forest–farm mosaic into focus
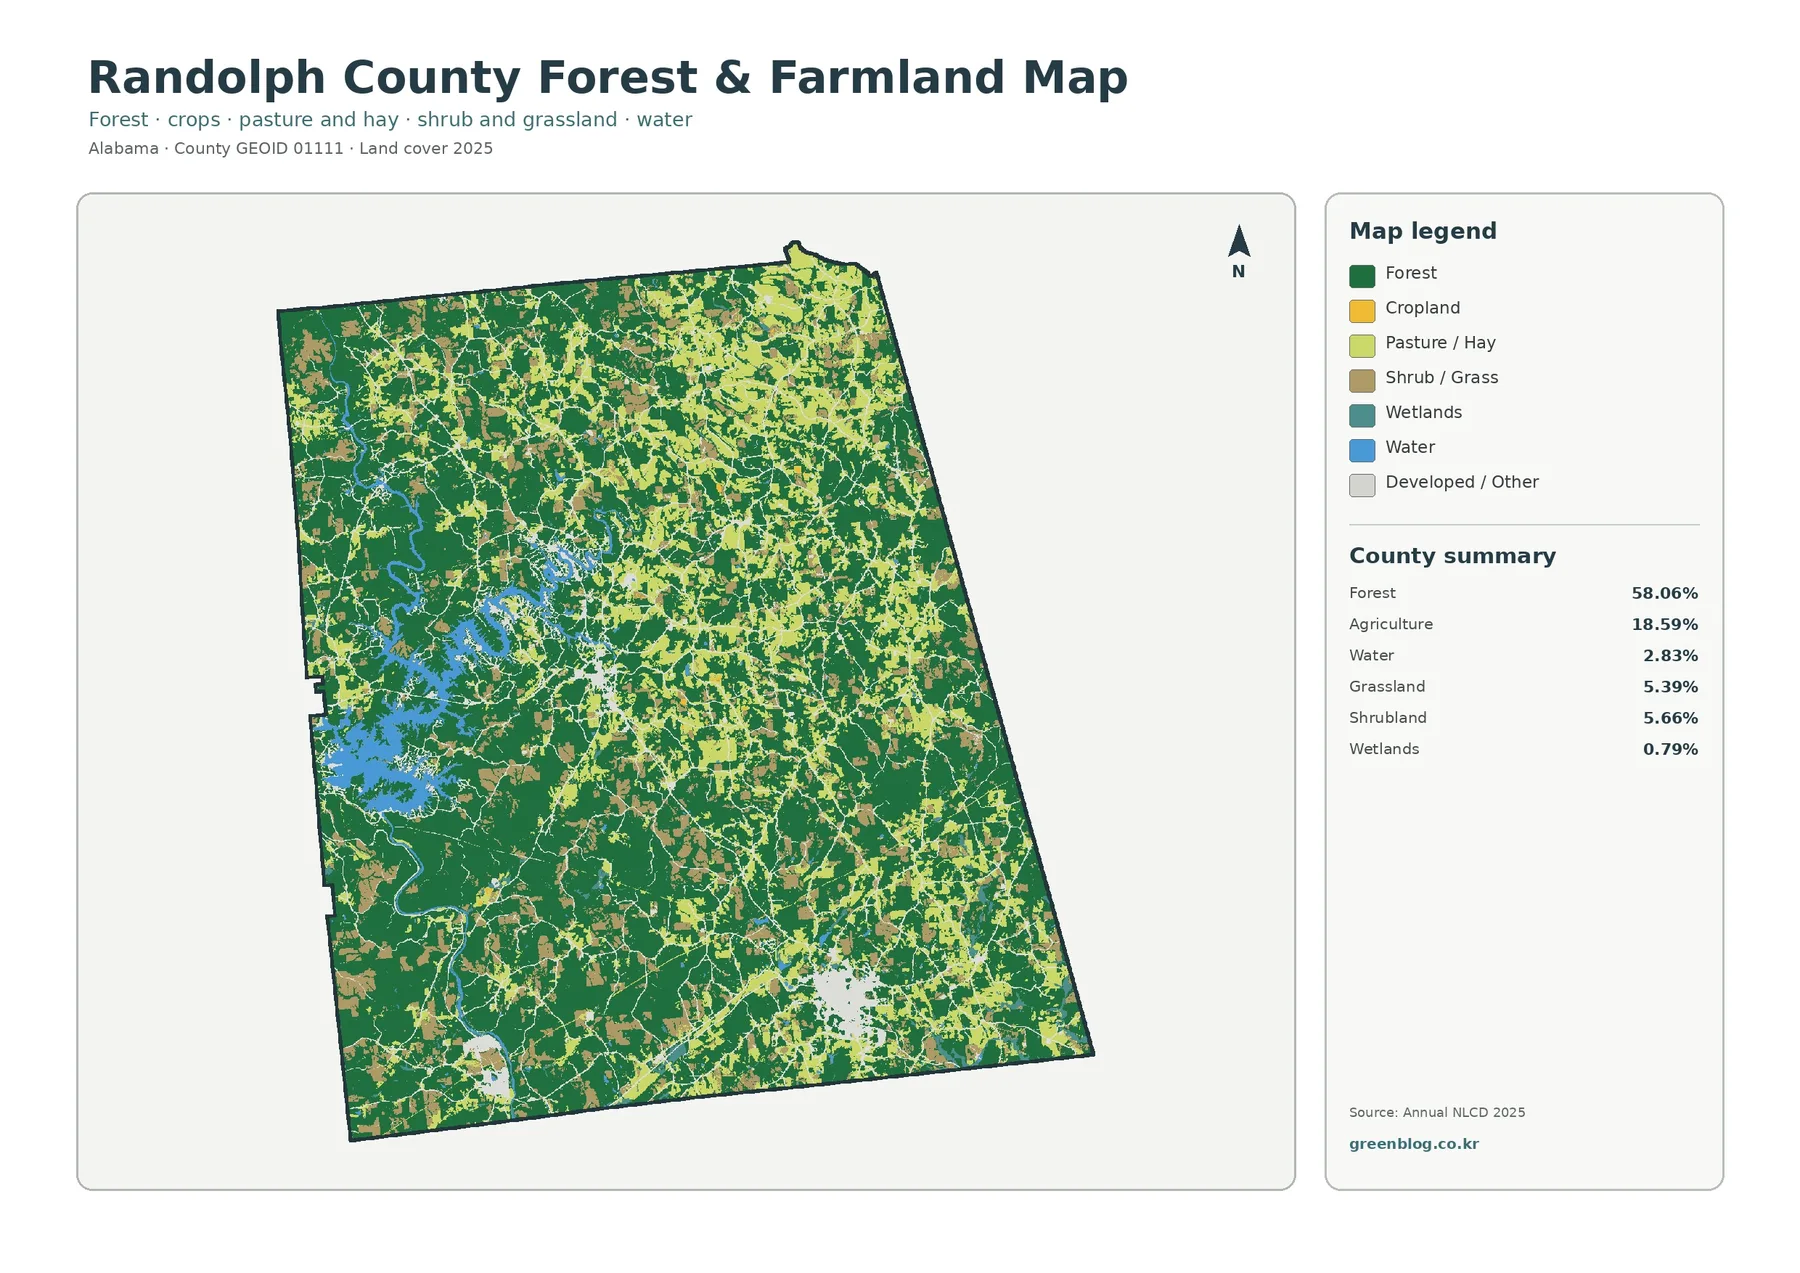
The simplified forest-and-farmland map makes the rural structure easier to study because developed and other classes fade into a neutral background. Forest remains the continuous base across large parts of the county. Cropland and pasture/hay appear as smaller, lighter pieces inserted through that base, with a noticeable amount of agricultural cover in the north, center, and east. The result is not a simple north-versus-south division. Instead, the county contains many local transitions between woods, working land, open vegetation, and settlement.
Agriculture accounts for 18.59%, while grassland and shrubland together add another substantial share of open or semi-open cover. Those categories should not be treated as interchangeable. Cropland reflects cultivated vegetation, pasture/hay is managed differently, and grass/shrub classes can include other non-forest surfaces. For a classroom exercise, this map is useful for showing why “open land” is not one land-cover class. It also helps prevent a common mistake: assuming that any non-forest green or yellow area is automatically a farm parcel.
Open water is 2.83% and wetlands are 0.79% in the supplied summary. That difference is important in Randolph County because Lake Wedowee is visually large. A reader may see abundant blue and assume wetland cover must also be extensive, but the mapped categories say otherwise. The reservoir contributes a major open-water footprint, whereas wetlands form a much smaller share. Neither category should be substituted for regulatory wetland boundaries or flood zones; they describe land cover, not legal jurisdiction.
Built surfaces remain concentrated even where developed cover is present
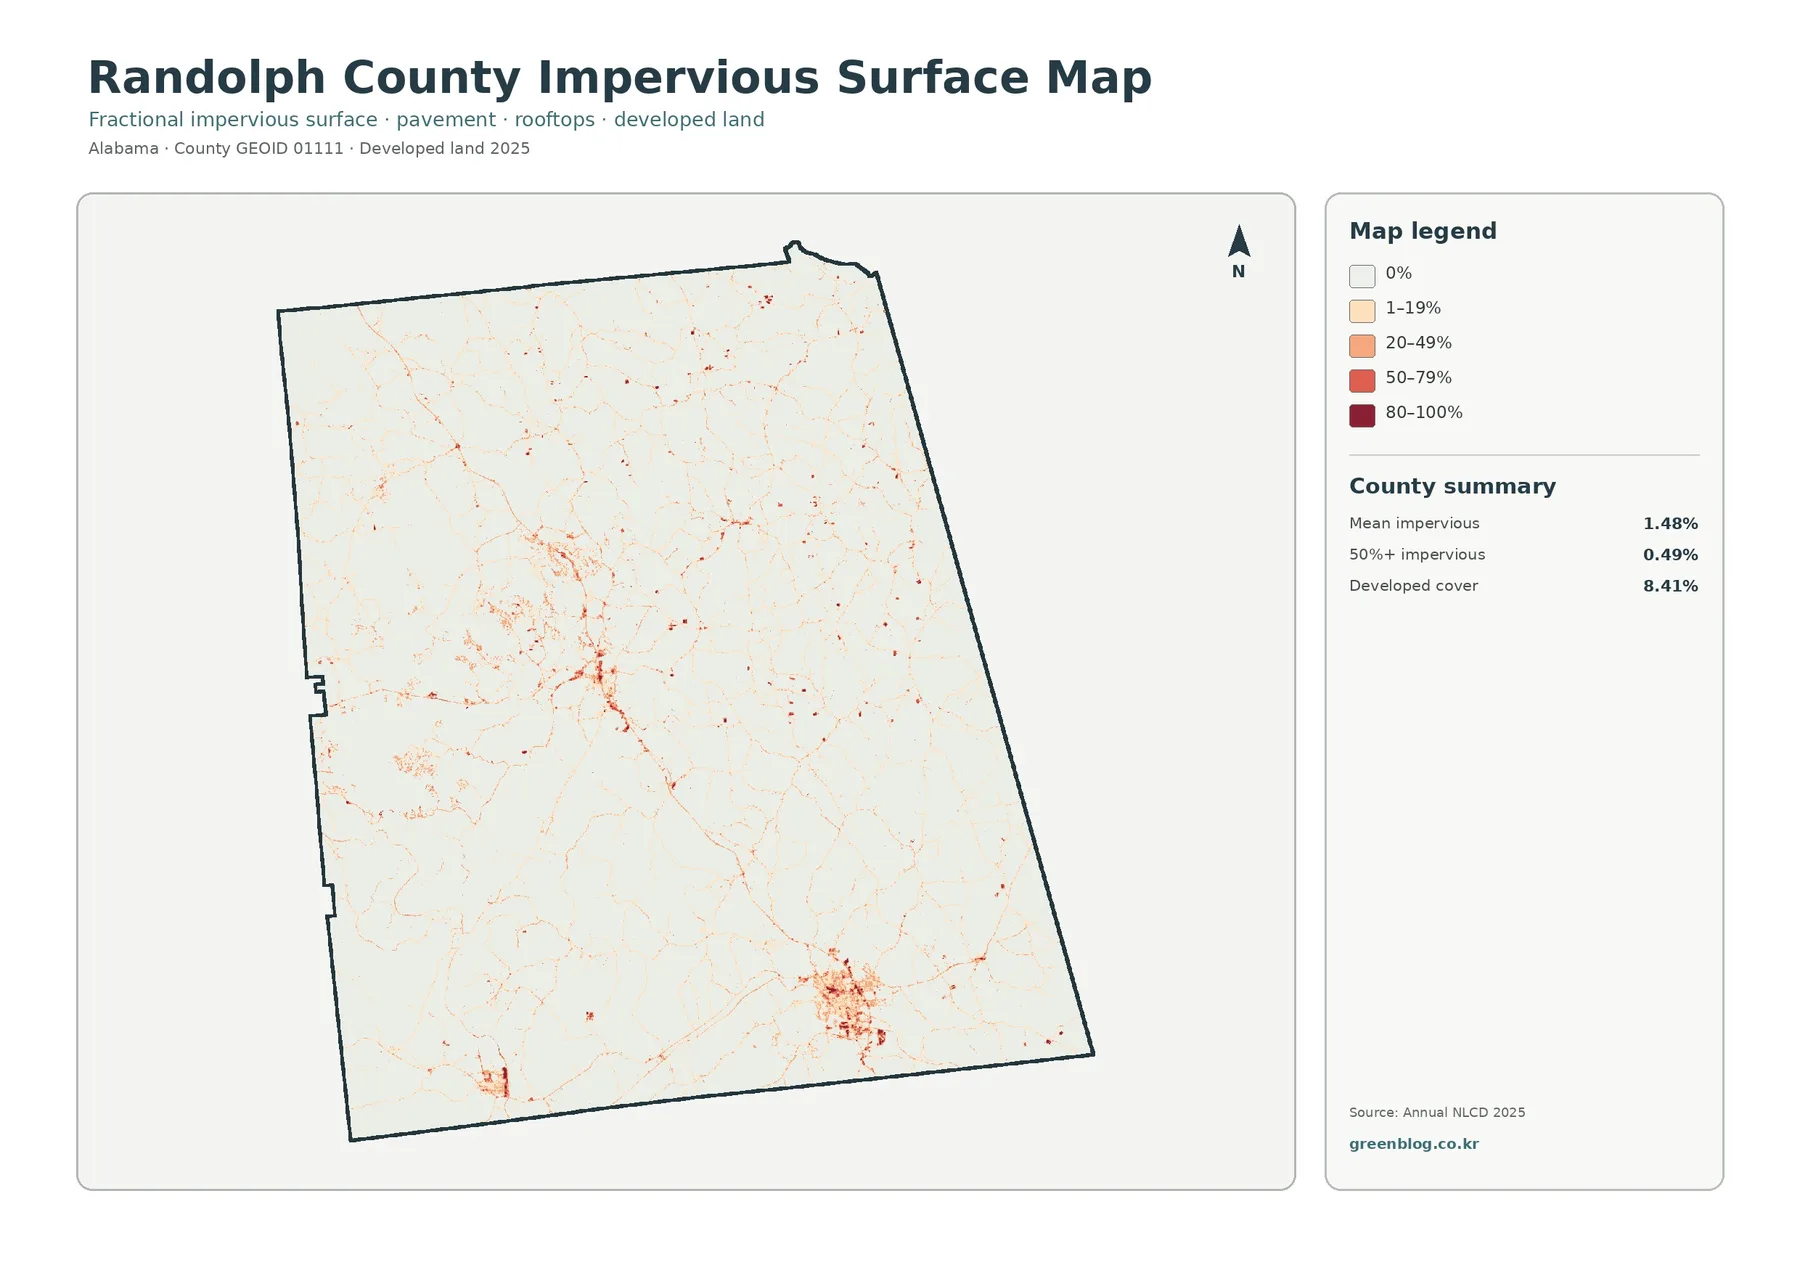
Impervious surface means pavement, roofs, parking areas, and similar hard materials that allow little direct infiltration into the ground. On this map, most of Randolph County is white or very pale, indicating little or no mapped impervious surface. Darker tones gather in the southeast and in a smaller center-west cluster, with thin lines and tiny patches connecting or surrounding them. The pattern is much more selective than the developed-land color on the general map.
The countywide mean imperviousness is only 1.48%, and just 0.49% of the county is shown at 50% or greater imperviousness. Developed cover, however, is 8.41%. These measures answer different questions. A developed land-cover cell can still contain lawns, trees, bare soil, and other permeable surfaces, so it does not have to be mostly pavement or rooftops. The impervious map is therefore useful for distinguishing a broad developed classification from the harder surfaces within and around settlements.
The strongest southeastern cluster provides a clear example for urban-versus-rural comparison. Students or presenters can contrast that cluster with the mostly pale northern and eastern countryside, then return to the general land-cover map to see the surrounding forest and agriculture. The narrowest roads and small buildings may be mixed with neighboring vegetation inside a 30-meter raster cell, so this image is not suitable for measuring a road width, parking lot, or individual property. Its strength is county-scale concentration, not site engineering.
The 1985–2025 comparison is a class-difference map, not a development map
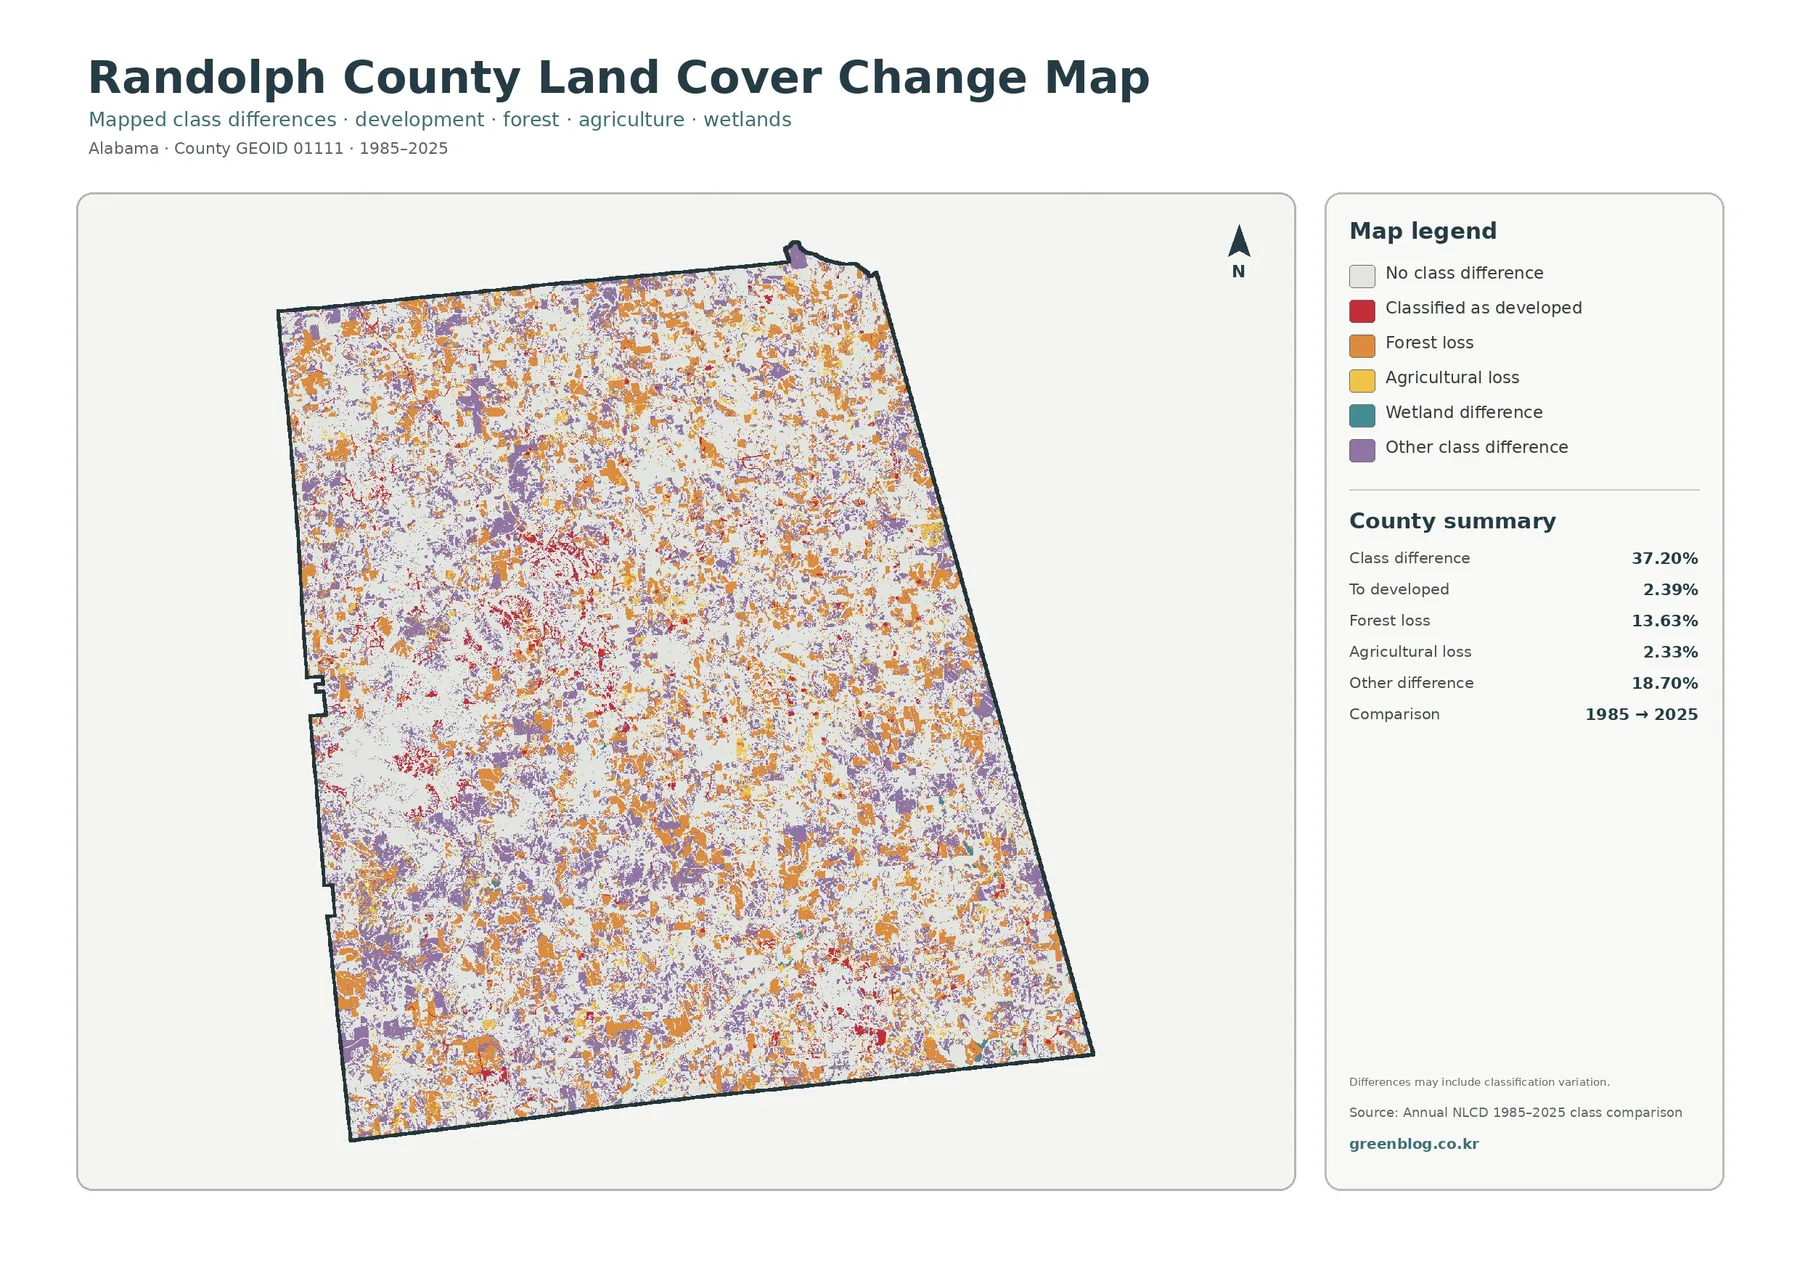
The change view requires a different reading strategy. White cells indicate no mapped class difference between the two comparison years. Red marks cells classified as developed in the later comparison, orange represents forest loss, yellow represents agricultural loss, teal indicates wetland difference, and purple groups other class differences. Colored cells are spread across the county, but they do not all describe the same process. Treating every colored cell as construction or land clearing would greatly overstate what the map says.
Total class difference is 37.20%, while the share classified to developed is 2.39%. Forest loss is 13.63%, agricultural loss is 2.33%, and other difference is 18.70%. Orange and purple therefore make up much of the visible change pattern, while red is more concentrated around settlements and connecting corridors. A “forest loss” cell means the 2025 class differs from the 1985 forest class; it does not, by itself, establish why that happened, whether the change was permanent, or whether the location was converted to development.
Annual NLCD Collection 1.2 extends the product suite through 2025 and is processed at 30-meter spatial resolution. This page compares endpoints, so it cannot show the exact year in which a specific location changed or whether it shifted more than once during the intervening decades. Long-term vegetation management, crop and pasture cycles, regrowth, disturbance, and classification variation can all require closer investigation. For a project about change timing, the next step should be to inspect intermediate annual products and recent imagery rather than infer a story from two endpoint colors.
Use the four views as a sequence of questions, not as four copies of the same map
A practical way to study Lake Wedowee is to begin with the general cover map, locate the reservoir, and then switch to the forest/farmland view. That second image makes it easier to compare forest, agricultural cover, open water, and wetlands along the branching shoreline. If the question turns to settlement around Wedowee, the impervious map narrows attention to hard surfaces. The change map can then flag places where the 1985 and 2025 classes differ, without claiming a cause.
For Roanoke and the southeastern part of the county, the impervious map is often the most efficient starting point because the concentration is obvious. After locating it, the general land-cover map shows how that developed area sits inside a much larger forest-and-agriculture setting. The change map can be used last to ask whether nearby cells fall into the “to developed,” forest-loss, or other-difference categories. This order keeps the highly colored change map from overwhelming the reader before the present-day pattern is understood.
The same workflow works in education. A teacher can ask students to identify the dominant current cover, compare forest with agriculture, locate the highest concentrations of hard surface, and then distinguish “class difference” from “developed change.” A presentation can use one map per question rather than shrinking all four into a single slide. Because every map shares the same county outline, viewers can move between them without relearning the geography.
Good uses include environmental context, watershed discussion, and broad planning reference
For watershed education, the reservoir and connected river system give Randolph County a strong local example. The maps can support a discussion of how open water sits beside forest, farmland, and developed surfaces without implying that any one cover type caused another. Forest and farmland comparisons are useful for rural-landscape lessons, while the impervious map can introduce runoff concepts by showing where hard surfaces cluster. More detailed hydrology, water quality, or flood analysis requires dedicated datasets beyond these land-cover images.
For community presentations or early planning conversations, the maps provide a countywide background that is easier to understand than a table of raw land-cover classes. They can show that development is concentrated near a few centers while forest remains extensive, or illustrate how Lake Wedowee breaks up the western landscape. They should not be used to decide whether a parcel can be built on, where a property line lies, whether a site contains a jurisdictional wetland, or what a landowner may legally do. Those questions require current local, state, federal, and survey records.
Randolph County also has a local Alabama Cooperative Extension office with professionals serving forestry, wildlife and natural resources, agronomy, animal science and forages, and farm management. That makes the extension system a better place to seek practical local guidance than a generalized raster map. The maps on this page can help a reader frame a question—forest, farm, water, or development—but they are not a substitute for the expertise or field information needed to manage land.
Read every edge as generalized raster information
Annual NLCD is raster data. Each 30-meter cell represents a classified surface rather than a surveyed boundary. If a cell contains trees, lawn, a road, and a building, the product has to summarize that mixed surface. Small ponds, narrow streams, thin roads, scattered houses, and irregular field edges can therefore be simplified or blended with nearby cover. This is especially important around Lake Wedowee’s complicated shoreline, where a visually sharp color boundary should not be assumed to match the waterline or property boundary at survey accuracy.
The observation year matters as well. The current maps describe 2025 classifications, so development, timber harvest, vegetation recovery, farming changes, or water conditions after that year may not appear. The endpoint change view compares 1985 with 2025 and carries its own warning that differences can include classification variation. For decisions that depend on what is happening now, combine these maps with current imagery and field verification. For legal or regulatory decisions, use the authoritative parcel, zoning, wetland, flood, and permitting sources for the property or project.
Finally, land cover is not the same as land use. A forest-classified cell describes what covers the surface; it does not tell you who owns the land or whether forestry is the legal use. An agricultural class does not prove that a parcel is zoned for agriculture, and a developed class does not establish a city boundary. Keeping those distinctions clear makes the maps much more useful because the reader can focus on what they actually show: broad surface cover and how that classification differs across space and time.
Download the four original Randolph County land-cover JPGs
The ZIP archive contains one original JPG for each map shown on this page: general land cover, forest and farmland, impervious surface/developed land, and the 1985–2025 land-cover comparison. Each file is 2480 × 1754 pixels. The WebP images in the article are lighter previews for web viewing, while the JPG files are the originals supplied for saving, classroom handouts, presentation graphics, and moderate-size printing. The asset manifest does not mark these originals as meeting the site’s A3 high-resolution reference, so test the intended print size before producing a large display.
Frequently Asked Questions
What is the dominant 2025 land cover in Randolph County?
Forest is the largest mapped category at 58.06%. Agriculture follows at 18.59%, while developed cover is 8.41%, shrubland 5.66%, and grassland 5.39%. The forest/farmland map also reports 2.83% open water and 0.79% wetlands, which helps explain why Lake Wedowee is visually prominent even though forest still dominates the countywide total.
What is the large water feature in the western part of the maps?
It corresponds to R.L. Harris Reservoir, commonly called Lake Wedowee. Outdoor Alabama places the reservoir near Wedowee and identifies the Tallapoosa and Little Tallapoosa rivers as its principal river sources. The land-cover maps show surface cover around the reservoir, not water depth, flood risk, water quality, navigation conditions, or shoreline property boundaries.
Why is developed cover 8.41% when mean imperviousness is only 1.48%?
Developed land can contain both hard and permeable surfaces. A developed cell may include roofs and pavement along with trees, lawns, or soil. Fractional imperviousness estimates the hard-surface share separately. The supplied summary shows only 0.49% of the county at 50% or greater imperviousness, so the developed-cover percentage should not be read as the percent of the county that is fully paved.
Does the 37.20% class difference mean 37.20% of the county was developed?
No. The 37.20% value covers all mapped class differences between 1985 and 2025. The “to developed” share is 2.39%, while forest loss is 13.63%, agricultural loss 2.33%, and other class difference 18.70%. Some differences can reflect vegetation transitions or classification variation, so the map identifies locations for follow-up rather than proving a specific cause.
What files are included in the download?
The archive contains four 2480 × 1754 JPG files: the 2025 general land-cover map, forest-and-farmland map, impervious/developed-land map, and the 1985–2025 land-cover change map. The WebP images embedded in the article are web previews and are not the four original JPG files in the download package.
Map File Information
Randolph County Land Cover — Four JPG Maps
- Included Files: Use only the versions confirmed in the article and supplied images
- File Type: Use the confirmed download contents
- Intended Use: Printing, education, presentations, and map-based projects
Related Maps
- Autauga County Alabama Land Cover Map
- Baldwin County Alabama Land Cover Map
- Barbour County Alabama Land Cover Map
Sources and reference links
- MRLC Annual NLCD — Annual NLCD product coverage through 2025 and land-cover data access
- USGS Annual NLCD Collection 1.2 Land Cover — 30-meter raster resolution, classification framework, and the 2025 extension
- Randolph County Alabama official website — County seat, largest city, major waterways, highways, and local geographic context
- Outdoor Alabama: Harris Reservoir — Lake Wedowee location, Tallapoosa/Little Tallapoosa inflow, and reservoir context
- Alabama Cooperative Extension: Randolph County — Local forestry, wildlife, agriculture, and natural-resource extension services
Green Map creates custom-edited map images using open geographic data sources such as geoBoundaries, Natural Earth, OpenStreetMap, and government open data.
These maps are edited visual materials, not raw data files, and are provided for education, documents, presentations, and graphic reference.