This page provides four Macon County Alabama land cover maps and a single ZIP containing the four matching original JPG files. Forest covers 47.62 percent of the 2025 summary, while wetlands account for 19.14 percent and agriculture for 16.89 percent. The countywide pattern is not a solid block of woodland: wet areas, fields, grassland, and a compact developed concentration near the center repeatedly interrupt the forest.
The four views separate present-day cover, forest and farmland, impervious surface with developed land, and class differences from 1985 to 2025. WebP previews make the page quick to browse, and the 2480×1754-pixel JPG set is better suited to printing, classroom work, presentations, or close comparison. These products describe surface cover rather than parcel ownership, zoning, building rights, or legal wetland boundaries.
Table of Contents
Forest and wetlands set the countywide pattern
Nearly half of Macon County is classified as forest in the 2025 summary. Wooded areas extend through the north, east, south, and interior, but the green cover is repeatedly broken by wetlands and agricultural patches. That arrangement matters more than the percentage alone because the county has many edges where one cover type meets another rather than one uninterrupted forest mass.
Wetlands form the second-largest class at 19.14 percent. Broad blue-green bands wind through the interior and eastern side, with additional wet areas toward the west and south. Agriculture contributes 16.89 percent and appears in separated patches, including noticeable open areas along the northern and southern edges. Grassland adds 5.19 percent, while developed cover makes up 5.91 percent.
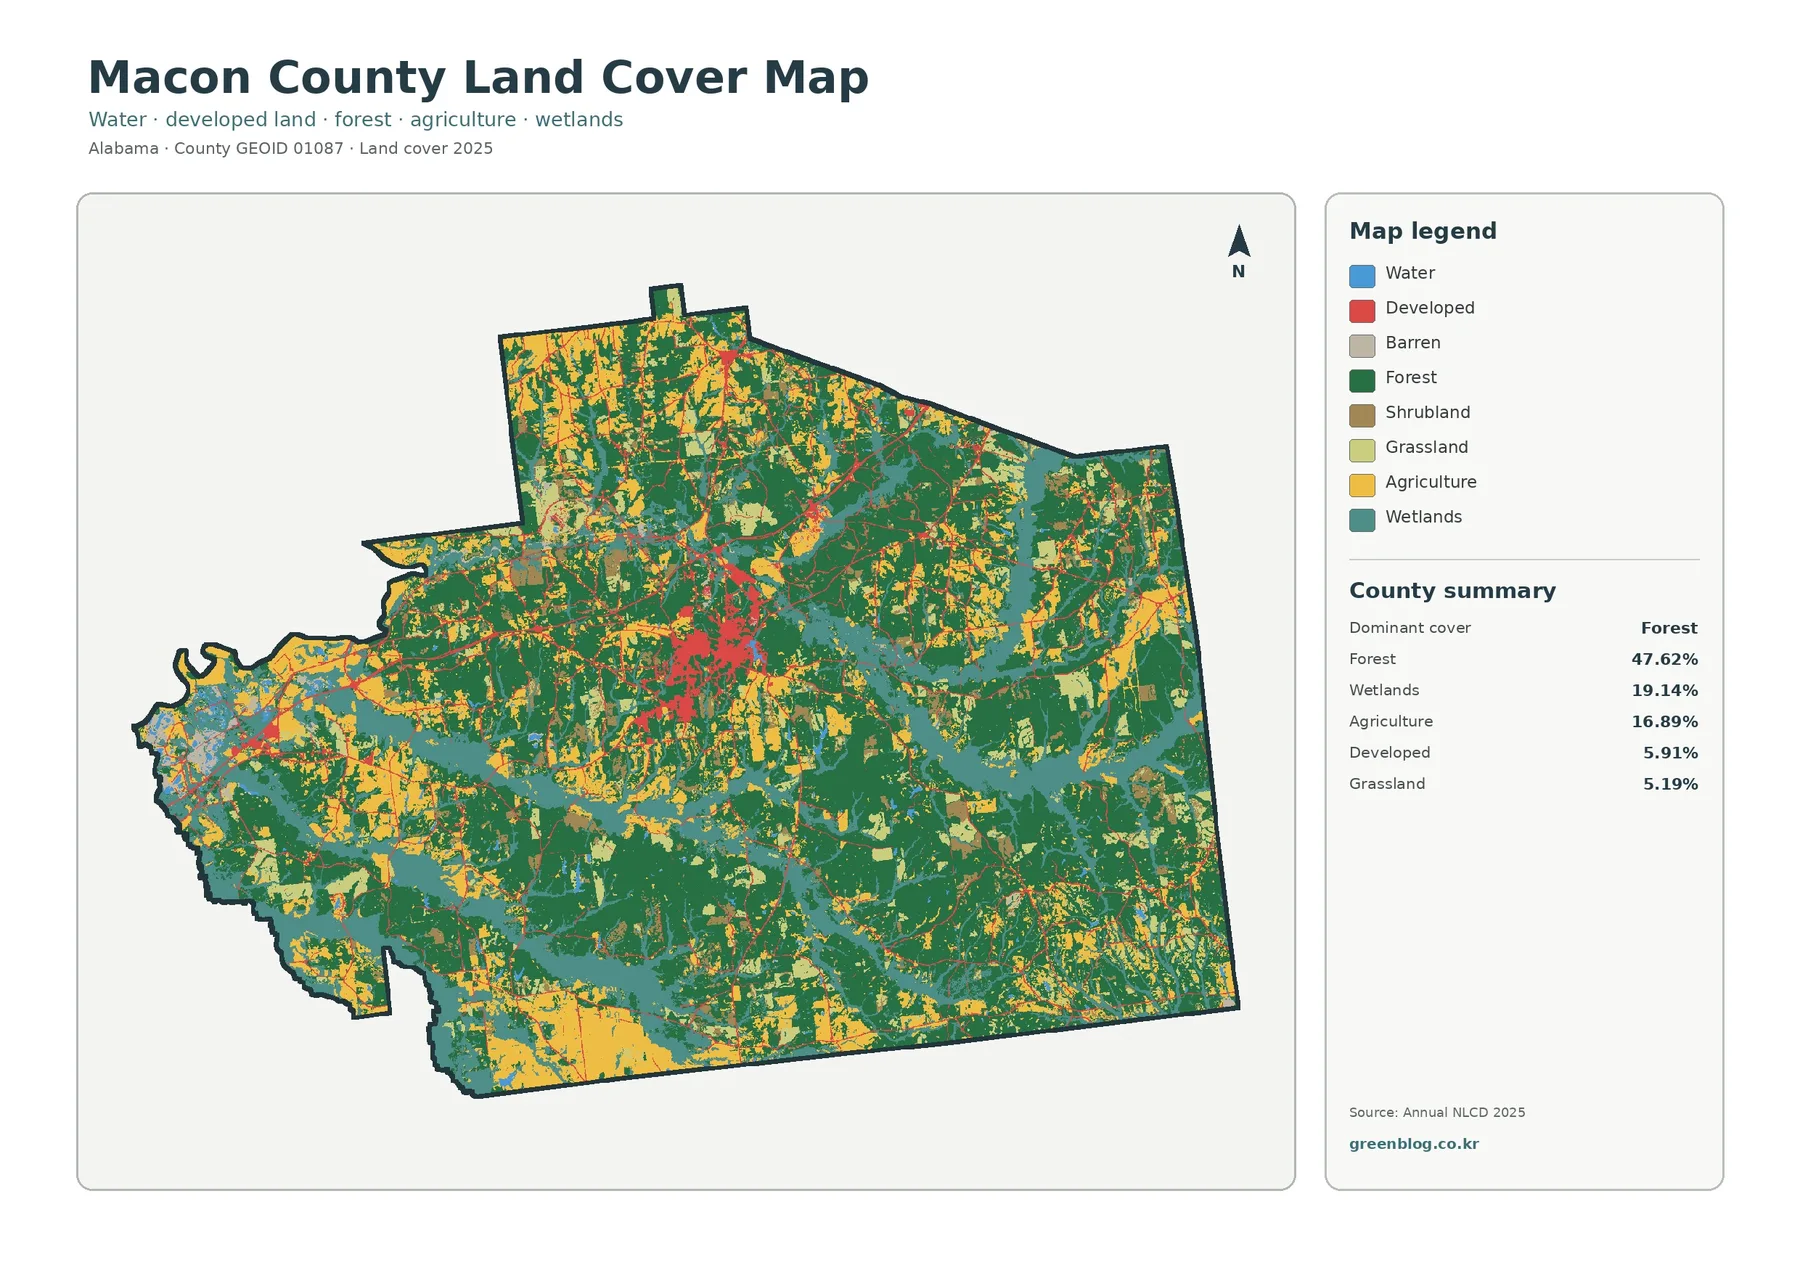
Open water occupies only 0.94 percent, so it is far less extensive than the wetland class. Reading the two blue-toned categories separately prevents a common mistake: a large wetland share does not mean the same amount of the county is open water. The general view is most useful when a reader wants one picture of how forest, agriculture, wet ground, grassland, and built surfaces fit together.
The 1985–2025 difference layer needs a careful reading
Class differences cover 33.78 percent of the county in the long-term comparison. That number is not a measure of new development. It combines several kinds of change, including cells classified as developed, forest loss, agricultural loss, wetland differences, and other class differences. Only 1.06 percent falls in the “to developed” category.
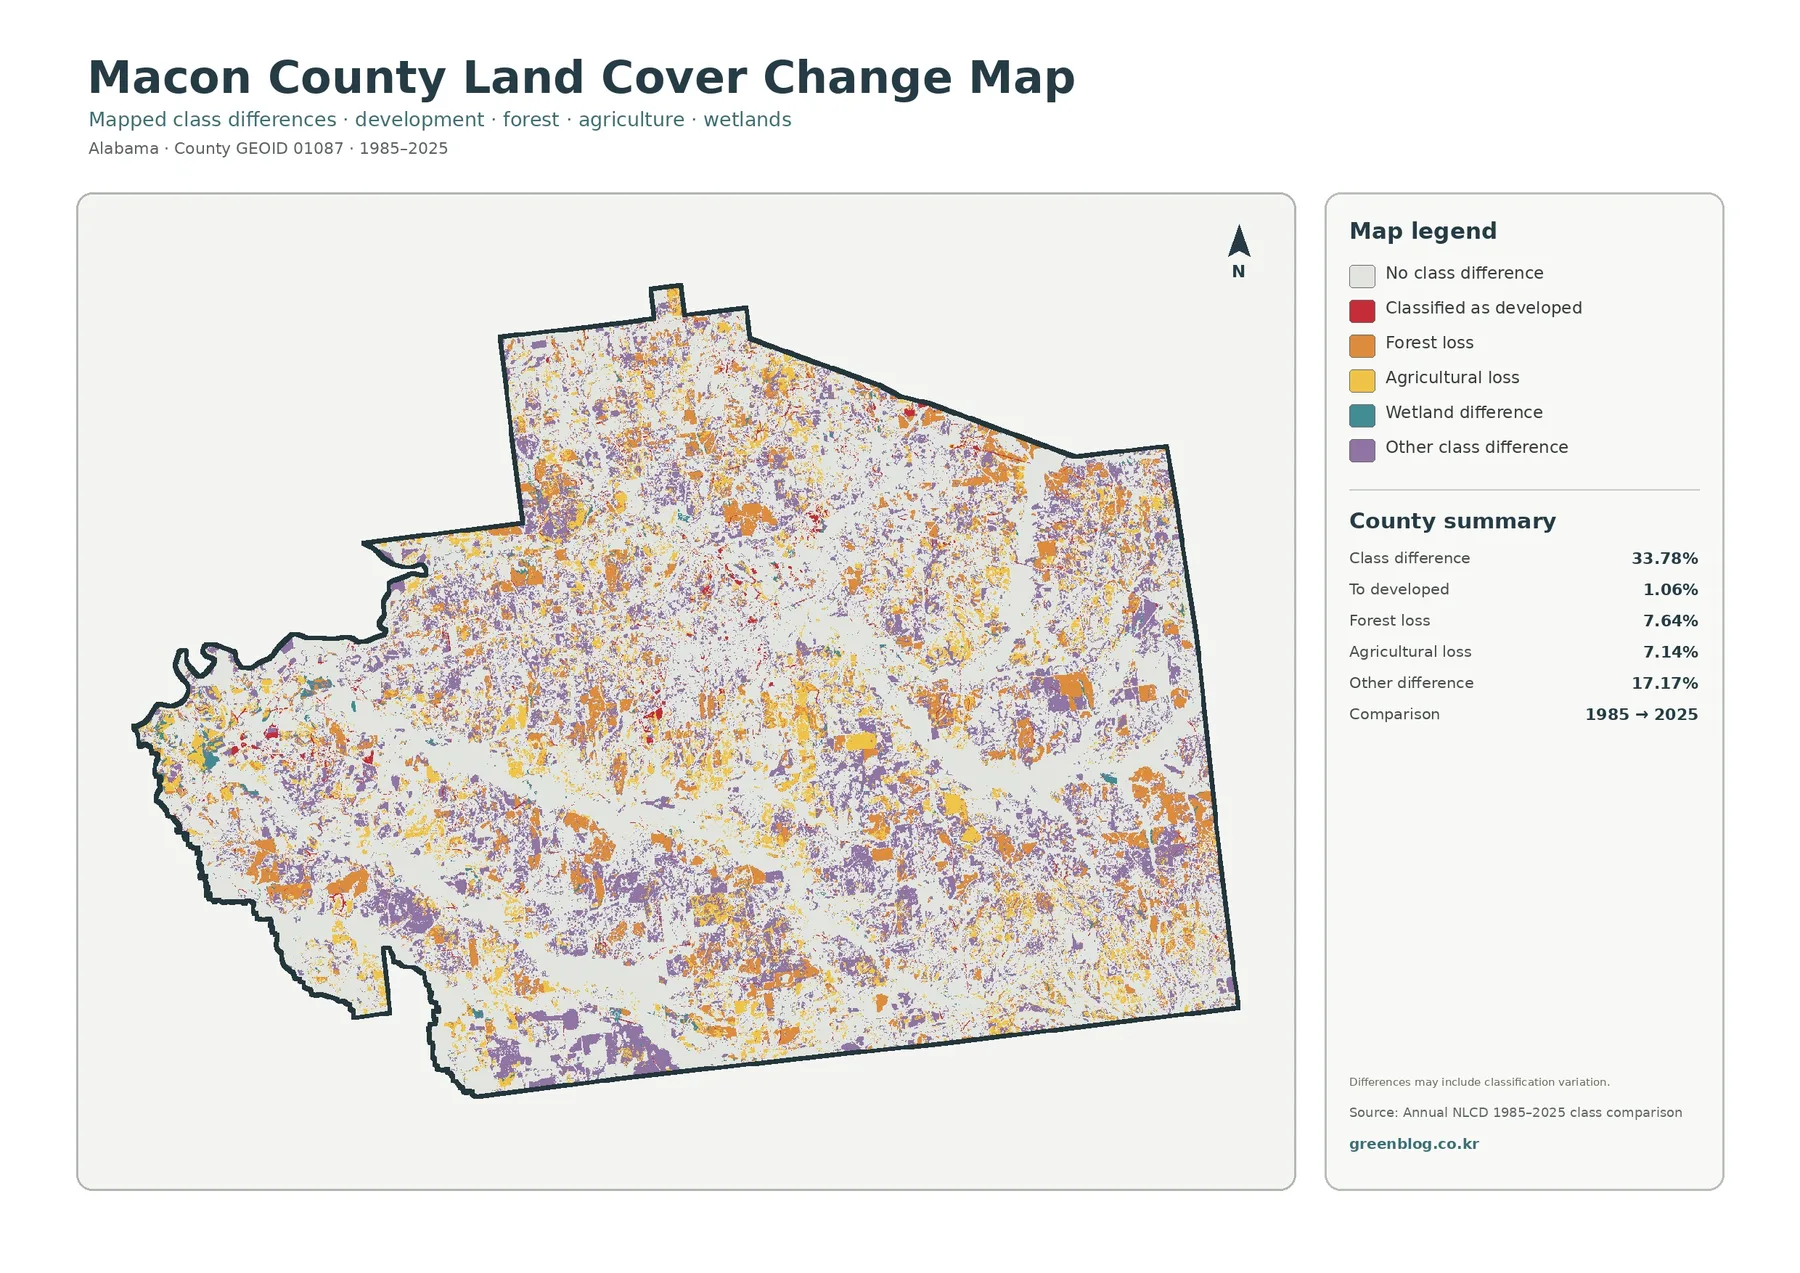
Forest loss accounts for 7.64 percent and agricultural loss for 7.14 percent, while the “other difference” category reaches 17.17 percent. Purple and orange patches are scattered across much of the county, whereas the red developed-change category is comparatively limited. The visual result is a mosaic of different changes rather than a single outward-moving development front.
Classification variation also deserves attention in a forty-year comparison. Imagery, seasonal conditions, mixed raster cells, and the rules used to assign a class can all contribute to differences between dates. A colored cell is therefore a good reason to look more closely, but it is not proof of one specific land-use event without supporting imagery or local records.
Built surfaces stay sparse outside a few clusters
Impervious surface means pavement, rooftops, and similar hard areas where rainfall does not readily soak into the ground. Countywide mean impervious cover is 1.14 percent, and only 0.29 percent of the mapped area reaches at least 50 percent impervious cover. Those figures explain why most of the impervious view is pale even though a few places stand out strongly.
A compact orange-red cluster appears near the center, with thin linear features extending outward in several directions. Another smaller concentration sits toward the western side, while scattered lines are visible farther north and east. Large parts of the south and southeast remain lightly colored, so the built-surface pattern is localized rather than evenly spread across the county.
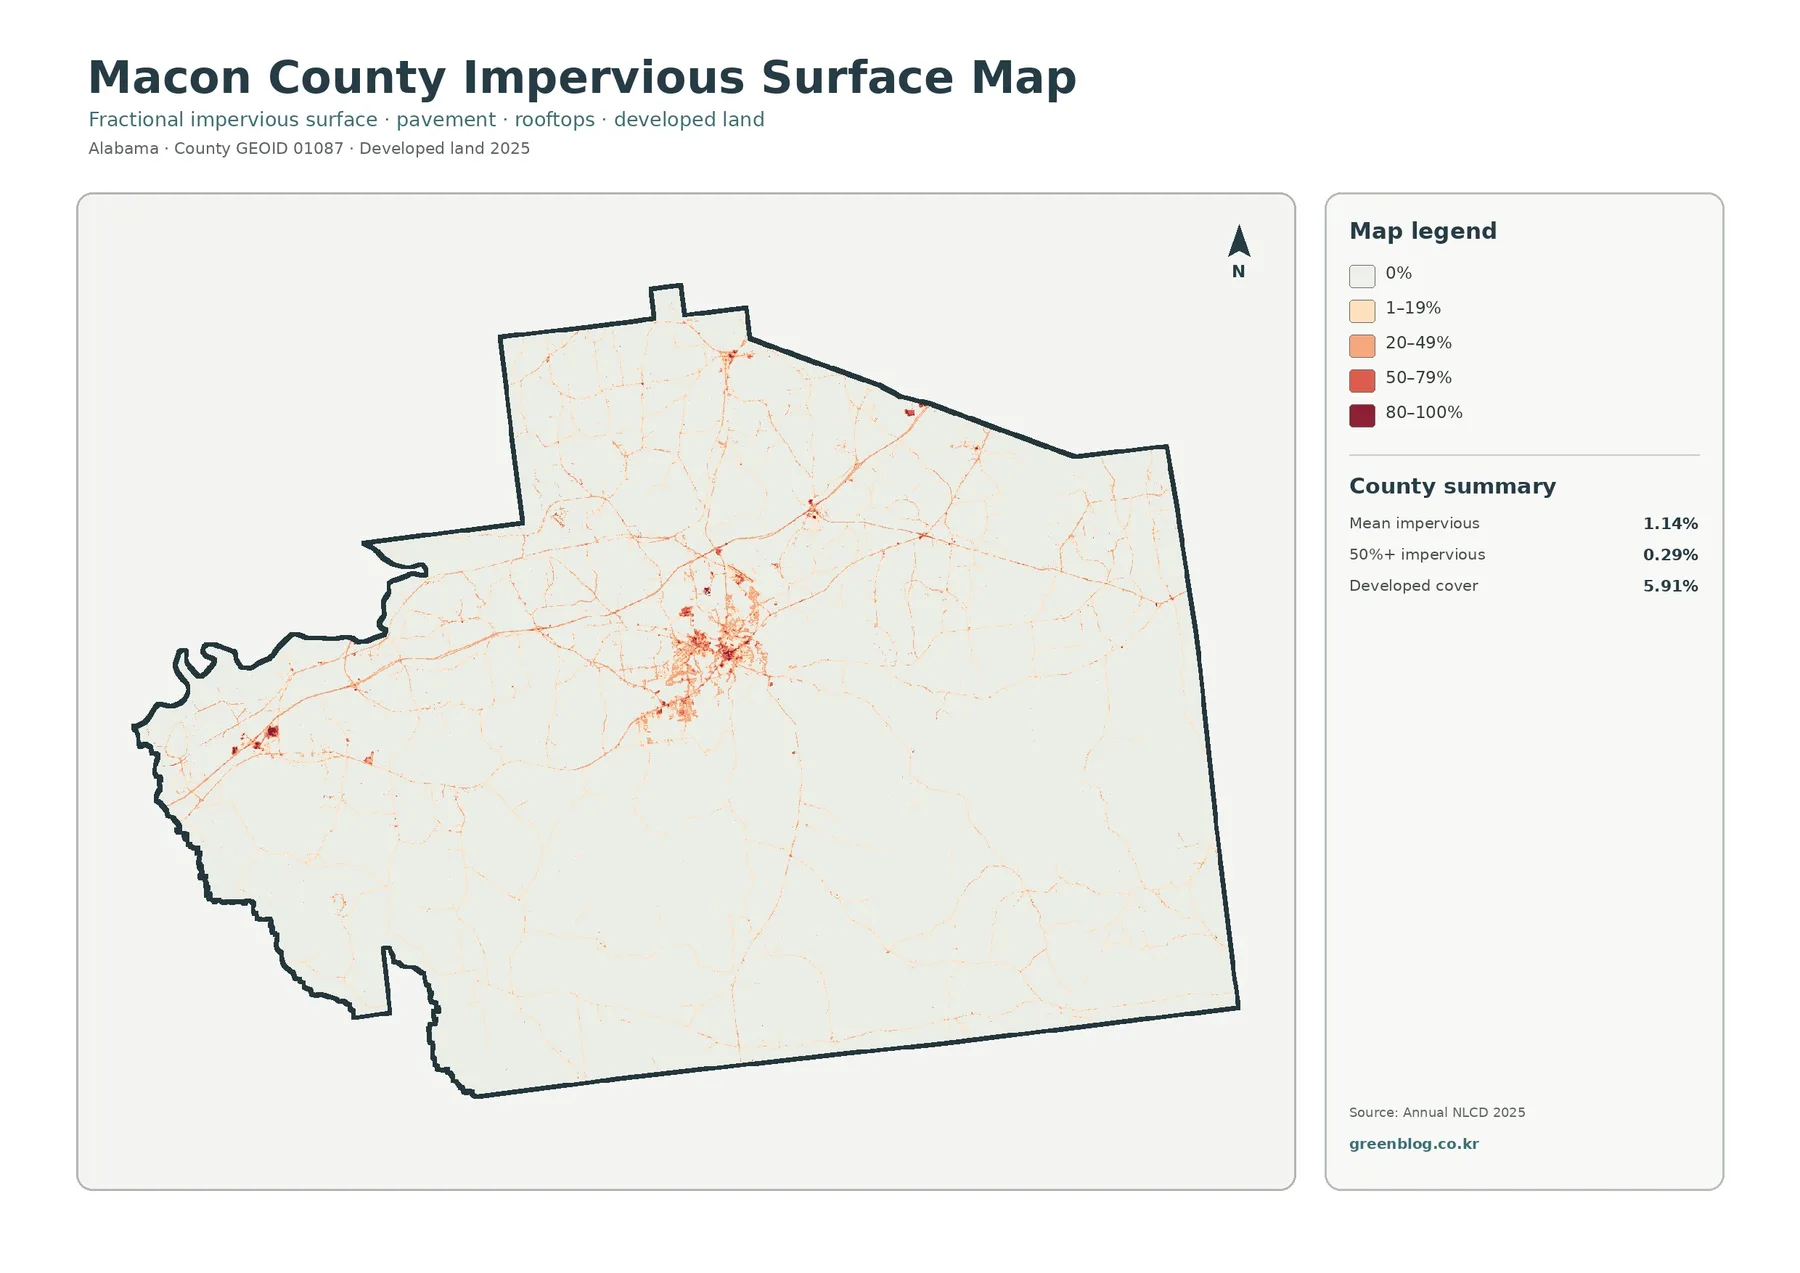
The 5.91 percent developed-land share should not be substituted for the 1.14 percent mean impervious value. Developed classes can include lawns, planted vegetation, and other open areas within a built setting, while the impervious layer focuses on hard surfaces inside each cell. Using both measures gives a more useful picture of where development is present and how intensely the ground is covered by pavement or structures.
Agriculture stands out more after simplifying the legend
Simplifying the legend makes the contrast between woodland and agriculture easier to follow. Forest remains the dominant background at 47.62 percent, but cropland and other agricultural cover appear as numerous separate openings rather than one large farming district. The northern section contains repeated agricultural patches among forest and wetlands, and a broader open area is visible along the southern edge.
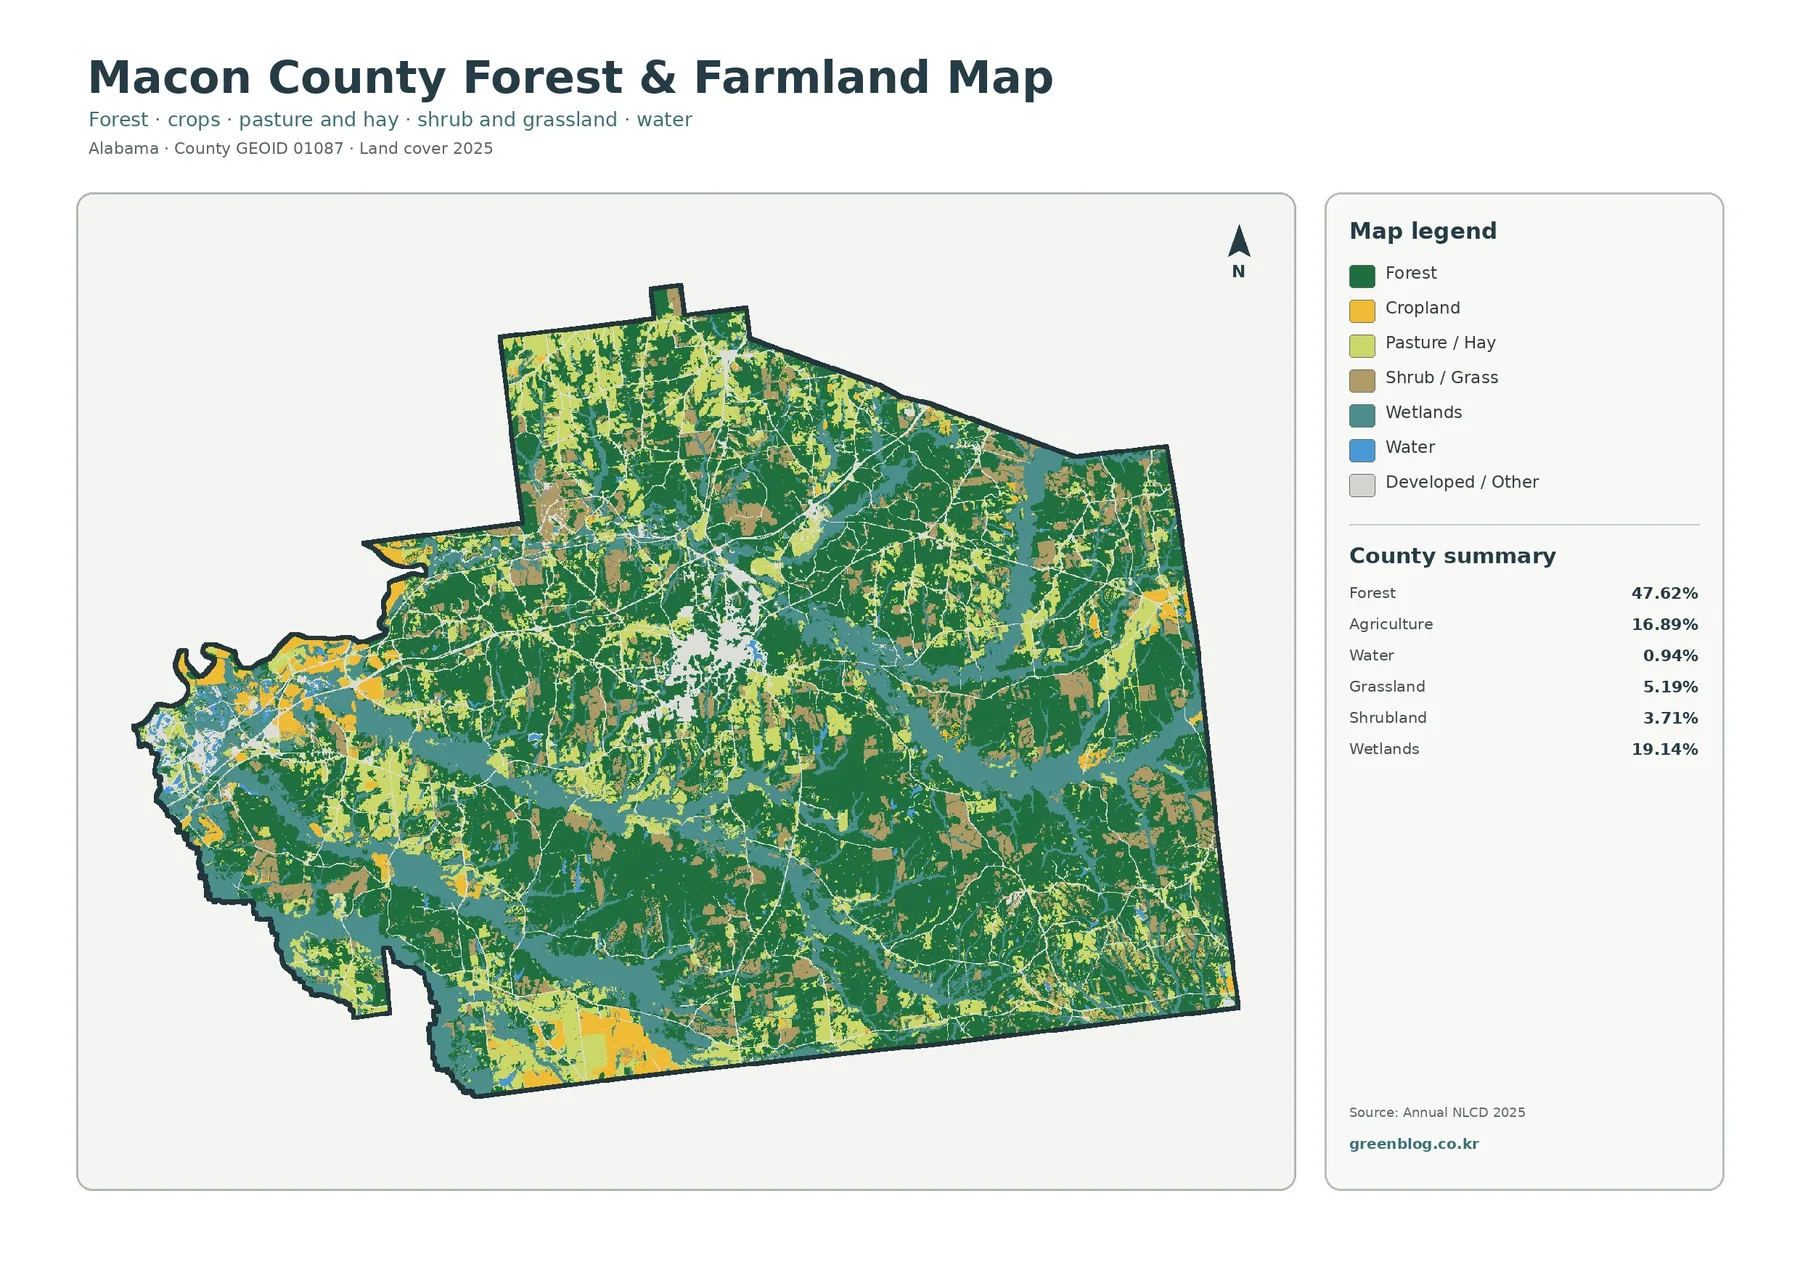
Western Macon County has another mix of open land, wetlands, and forest. Agricultural color is present there, but wet areas and woodland break it into smaller pieces. Shrubland represents 3.71 percent and grassland 5.19 percent, adding transitional areas that would disappear in a simple forest-versus-cropland comparison. Those smaller classes help explain why some boundaries look gradual rather than abrupt.
None of these classes defines farm ownership or legal land use. A cell marked as agriculture describes the observed surface cover at the time of classification, and a forest cell can contain different tree types or management histories. The simplified view works best for county-scale comparison, environmental education, and broad habitat or land-resource context.
A practical way to compare all four views
Start with the general cover view when the goal is to understand the county as a whole. The forest-and-farmland version can then answer a narrower question about wooded and open agricultural areas. If the discussion shifts to roads, rooftops, and other hard surfaces, the impervious layer provides a cleaner signal. Historical comparison belongs last because it describes differences between two dates rather than the current landscape alone.
The central developed concentration illustrates why the sequence is useful. It is visible in the general cover image, becomes much sharper in the impervious view, and sits within a much larger matrix of woodland and wetlands in the simplified natural-cover view. Returning to the long-term comparison shows that nearby class differences are varied; the countywide 33.78 percent total cannot be assigned to development simply because a developed cluster is present.
Classroom exercises can use the same approach. Students may first locate the dominant forest class and the extensive wetlands, then identify where agricultural patches interrupt those areas. A second task can compare the small developed share with the even lower impervious percentage. For presentations, choosing the one or two views that directly answer the question usually produces a clearer slide than shrinking all four images into one panel.
Download the four original JPG files
The ZIP includes one 2480×1754-pixel JPG for each view: general land cover, forest and farmland, impervious surface with developed land, and the 1985–2025 class comparison. The WebP versions above are convenient for browsing, while the original JPG files are more useful for printing, larger presentation layouts, or examining the legend at a bigger size.
Keep the legend and date visible when an image is reused in a report or slide. Cropping them away can make similar colors hard to interpret, and the change layer loses important context if the comparison years disappear. When space is limited, one full image with a readable legend is usually more informative than four tiny copies.
Limits before using the images for decisions
Land-cover products are built from raster cells, small square areas assigned a class or value. Real forest edges, wetland boundaries, roads, and buildings do not always follow the edges of those squares. Narrow features can be mixed with nearby vegetation or soil inside the same cell, so the graphics should not be used to measure parcel boundaries or exact structure footprints.
The present-condition layers summarize 2025 and do not include changes that occurred afterward. Likewise, the historical layer compares 1985 with 2025 rather than providing a continuous record of every year in between. Wetland cover is another area where scale matters: the 19.14 percent land-cover class is not automatically the same as a legally regulated wetland boundary.
For property, permitting, engineering, or regulatory questions, the appropriate current agency records should take priority. These county-scale images are best used for broad comparison, education, visual reference, and identifying places that may deserve closer study.
Frequently Asked Questions
What is the largest land-cover class in Macon County?
Forest is the largest 2025 class at 47.62 percent. Wetlands are second at 19.14 percent, followed by agriculture at 16.89 percent.
Does the 33.78 percent class difference mean that one-third of the county was developed?
No. The 33.78 percent figure includes all mapped class differences between 1985 and 2025. Only 1.06 percent is listed as changing to developed, while forest loss, agricultural loss, and other differences are separate categories.
What files are included in the download?
The ZIP includes four 2480×1754-pixel JPG maps: general land cover, forest and farmland, impervious/developed land, and the 1985–2025 change comparison.
Map File Information
Macon County Land Cover Maps – 4 JPG Files
- Included Files: Use only the versions confirmed in the article and supplied images
- File Type: Use the confirmed download contents
- Intended Use: Printing, education, presentations, and map-based projects
Related Maps
- Autauga County Alabama Land Cover Map
- Baldwin County Alabama Land Cover Map
- Barbour County Alabama Land Cover Map
Data and reference sources
- MRLC Annual NLCD Data – official access point for the Annual NLCD products used for present-day cover and long-term comparison.
- USGS Annual NLCD Land Cover Classification – background and definitions for forest, agriculture, developed land, wetlands, and related classes.
- U.S. Census Bureau TIGER/Line Shapefiles – official reference for county boundary and geographic data.
Green Map creates custom-edited map images using open geographic data sources such as geoBoundaries, Natural Earth, OpenStreetMap, and government open data.
These maps are edited visual materials, not raw data files, and are provided for education, documents, presentations, and graphic reference.