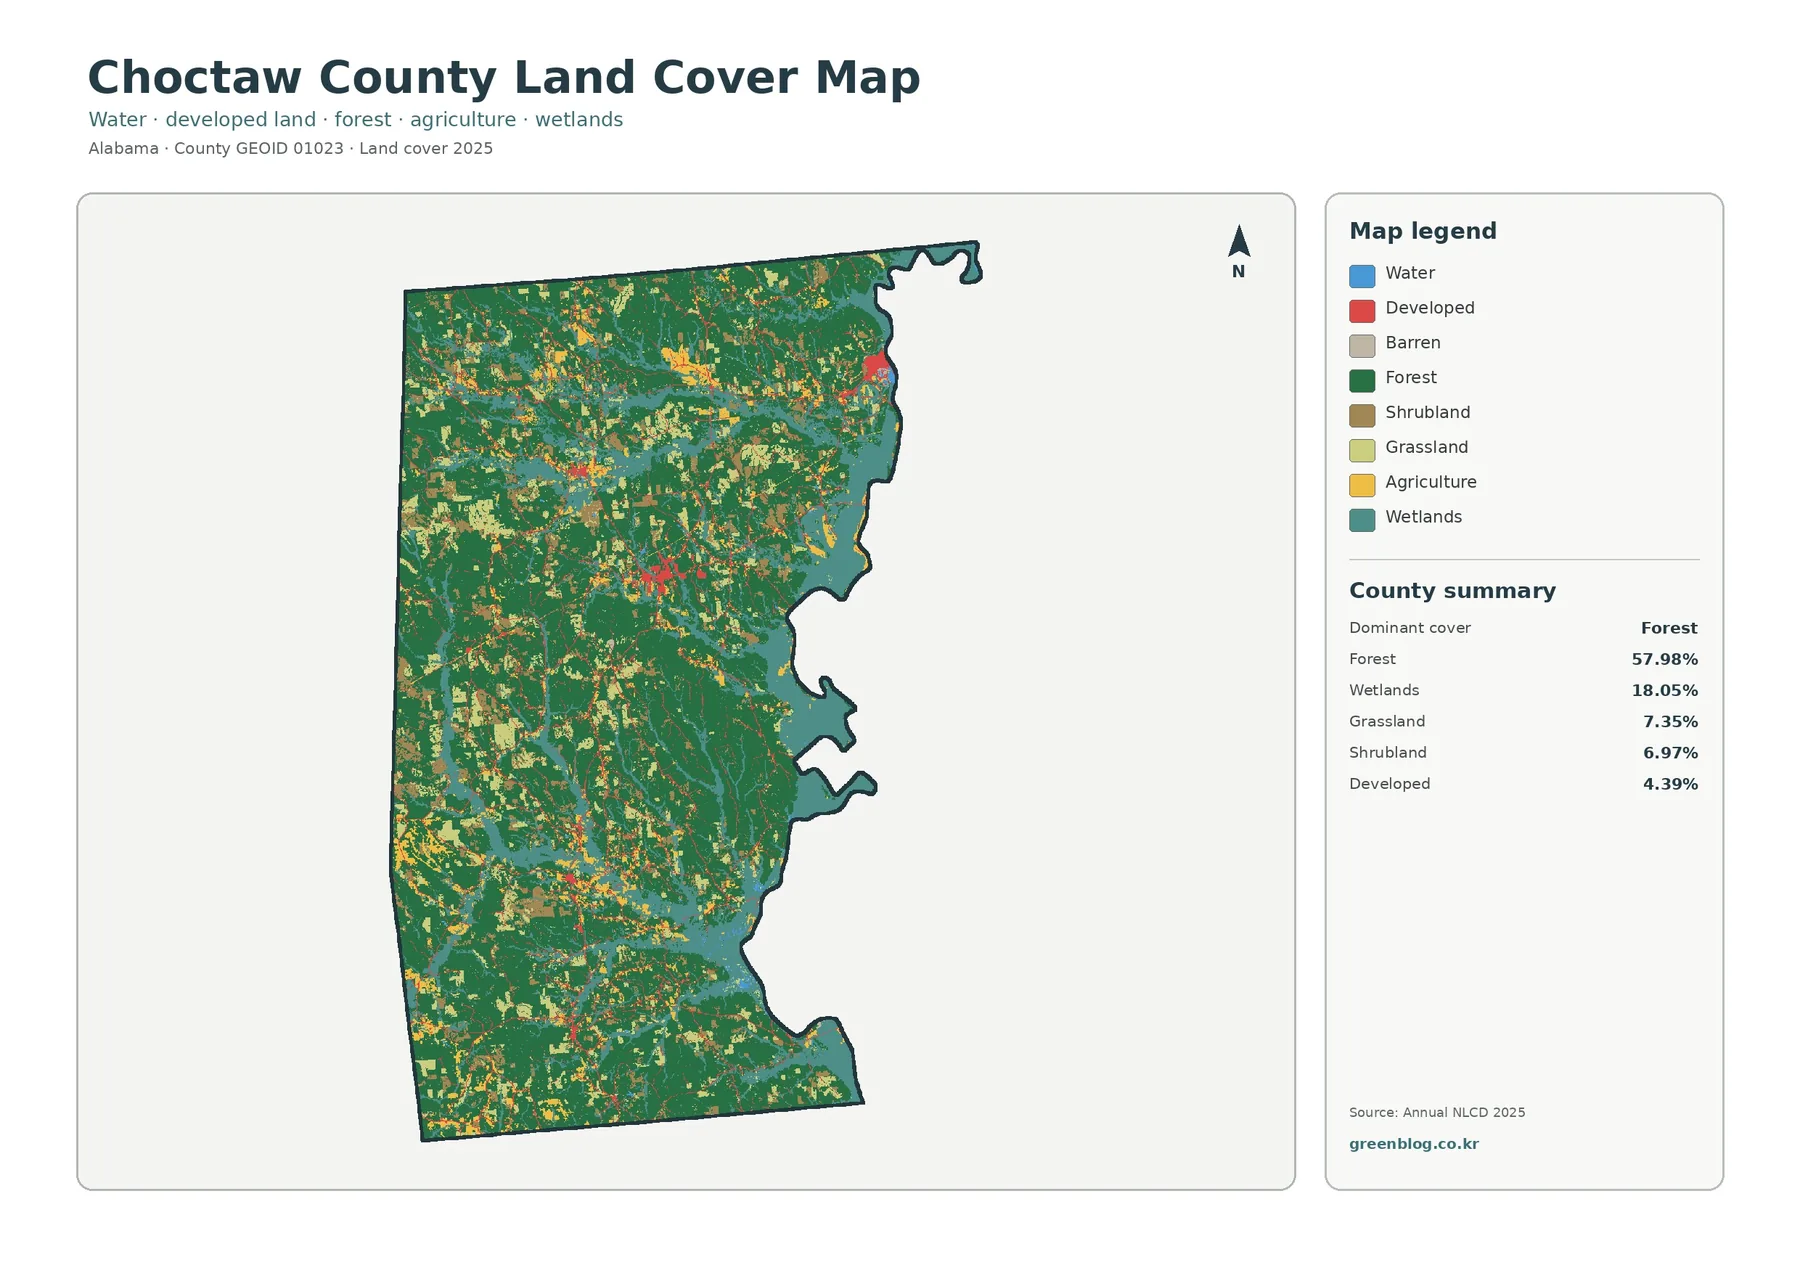
Choctaw County in southwest Alabama has a distinctly wooded and wetland-rich 2025 land-cover pattern. Forest accounts for 57.98% of the mapped area, while wetlands make up 18.05%. Grassland is 7.35%, shrubland 6.97%, and developed cover 4.39%. The broad interior is mostly green, but the eastern edge is marked by a large wetland network associated with the Tombigbee River corridor, giving the county a strong contrast between wooded uplands and low-lying river environments.
Four companion views cover the county from different angles: 2025 land cover, forest and farmland, impervious surface with developed land, and the 1985–2025 class comparison. The article uses WebP previews for quick viewing, while the four original JPG maps are bundled in one download. Together they work well for classroom lessons, county comparisons, presentation graphics, and preliminary environmental review when their county-scale limits are kept in mind.
Table of Contents
A forest-dominant county with a wet eastern edge
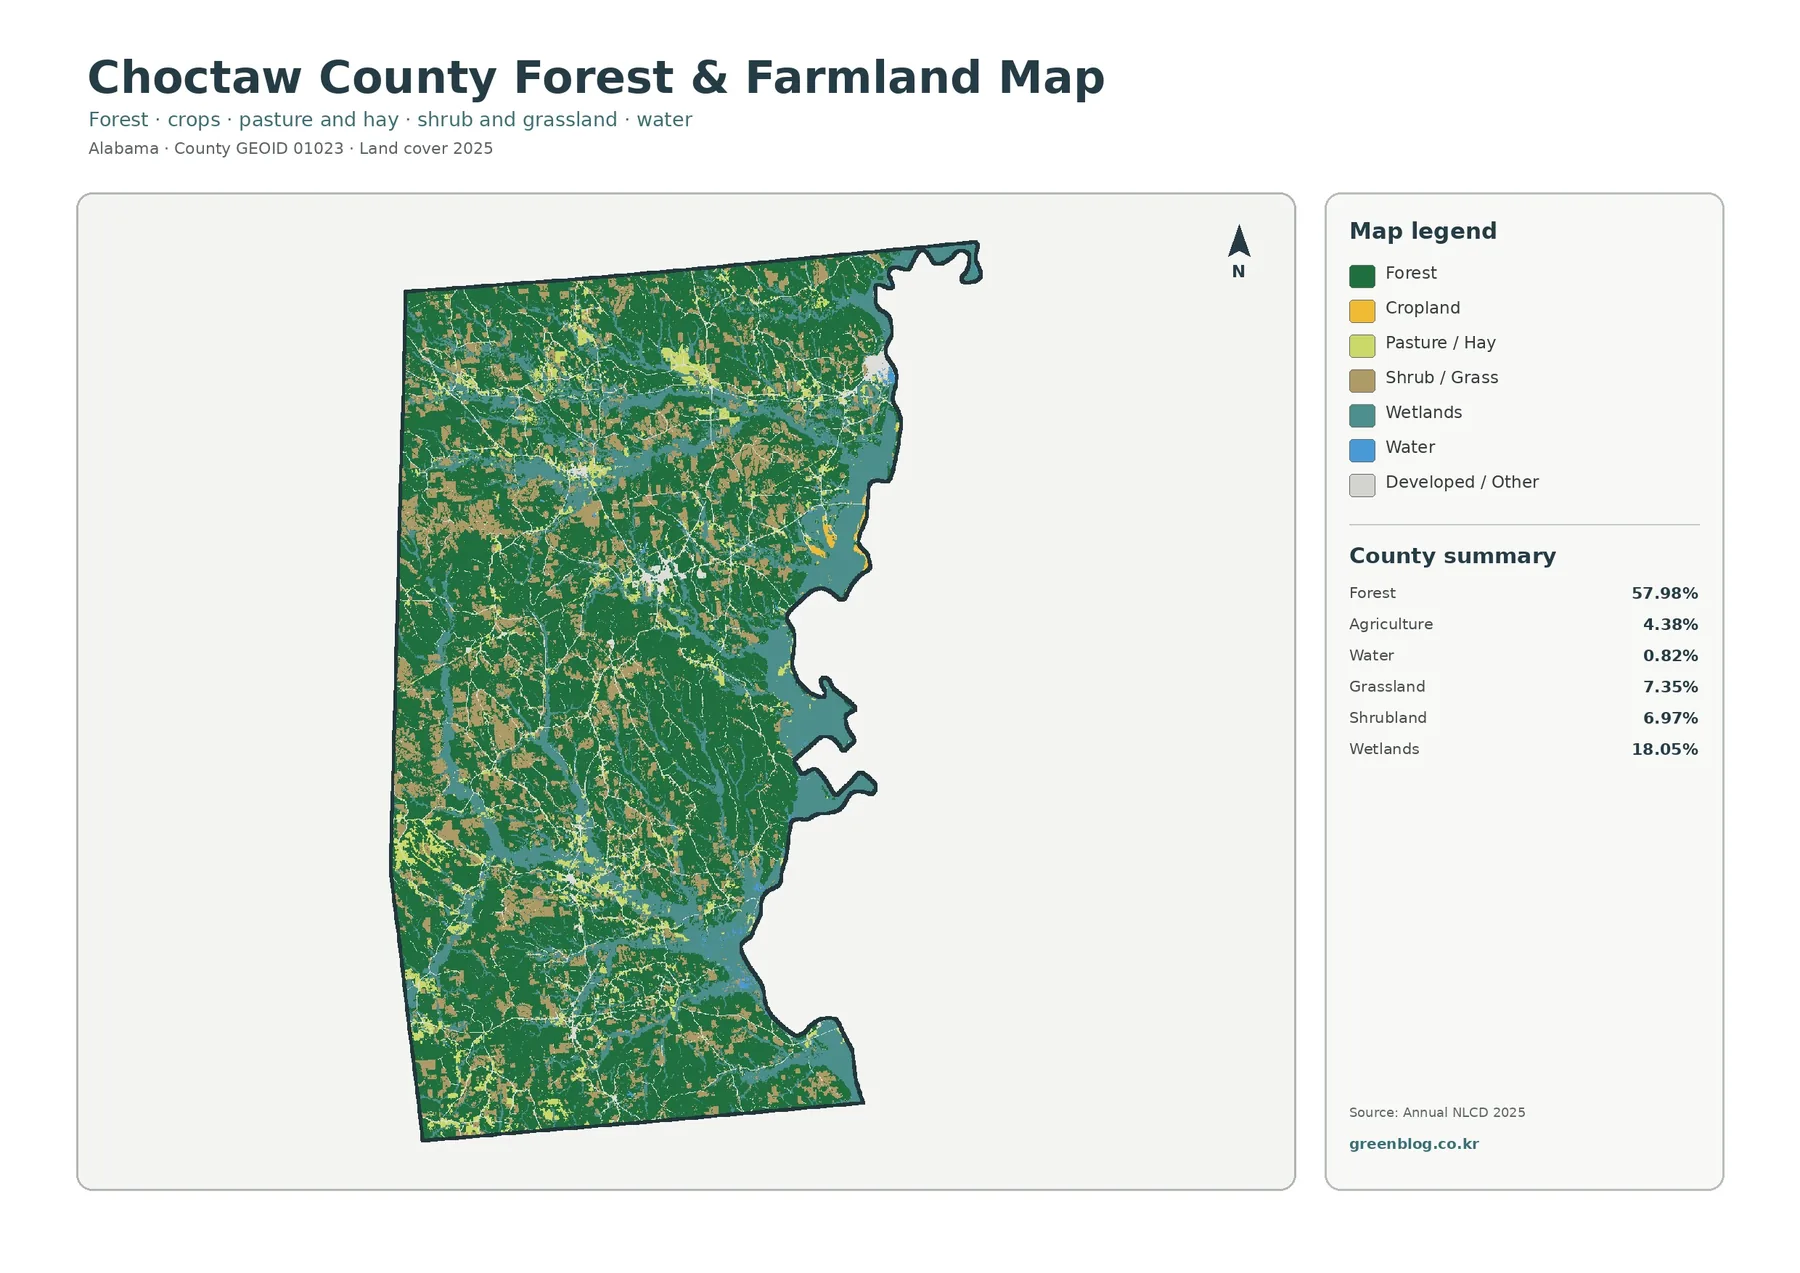
Forest is the dominant class at 57.98%, and its distribution is broad rather than confined to one corner. Large green areas extend through the west, center, and south, while smaller openings break the woodland into a patchwork in many places. The county therefore looks heavily forested without appearing as a single uninterrupted block. Grass, shrub, agriculture, roads, settlements, wetlands, and small water features all interrupt the green pattern at different scales.
The eastern boundary is the strongest orientation feature. Encyclopedia of Alabama identifies the Tombigbee River as the major waterway along Choctaw County’s eastern edge. On the supplied map, teal wetland cover follows that irregular side of the county and extends inland along smaller drainage areas. That relationship is visible enough to help match locations from one map to another, even though the map itself does not print river names or stream labels.
Wetlands account for 18.05%, a much larger share than open water. This is important because a wetland class does not mean a continuously flooded surface. It can include vegetated lowlands, floodplain environments, slough margins, and other places influenced by water. The eastern side contains the largest connected-looking wetland concentrations, while smaller teal patches also appear around interior drainage features. Their shape provides useful landscape context without defining legal wetland boundaries.
Developed cover is only 4.39%, yet several red clusters stand out against the forest. One notable concentration appears in the central interior, with another brighter area closer to the northeastern river side and smaller traces elsewhere. Butler is the county seat, while regional descriptions place U.S. 84 across the southern part of the county and State Route 17 through its central portion. Those facts help explain the general settlement context, but the land-cover image should not be used to assign a road name to every narrow red line.
Small hard-surface clusters inside a mostly permeable county
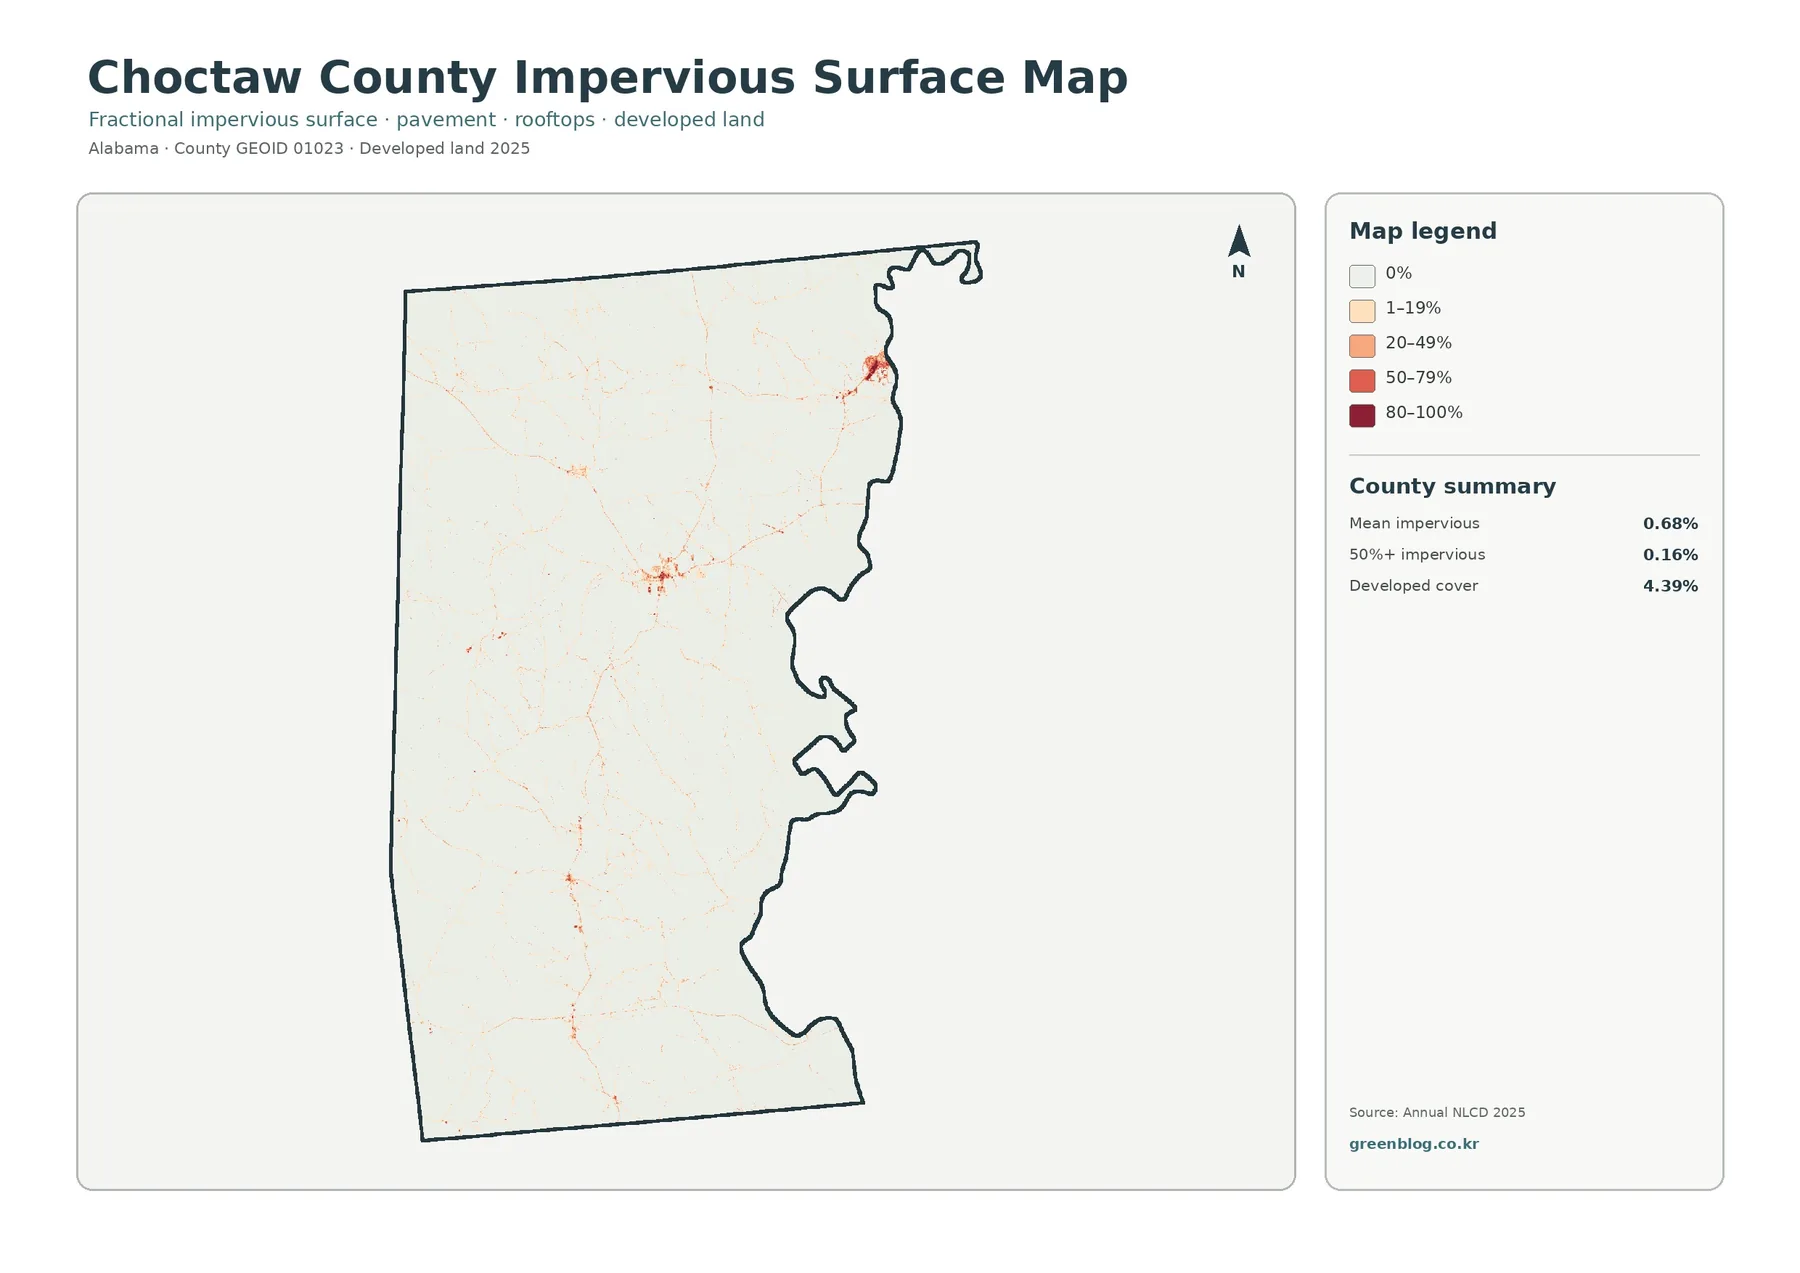
Impervious surface means pavement, rooftops, parking areas, and other hard surfaces that do not readily absorb rainfall. Choctaw County’s mean impervious value is just 0.68%, and only 0.16% of the county is summarized as having at least 50% impervious cover. Those values are much lower than the 4.39% developed-land share because developed classification can include yards, trees, soil, and other permeable surfaces around buildings and roads.
The impervious map is very pale across most of the county. Stronger orange and red values are confined to small clusters in the interior and near the northeastern side, with thin linear traces connecting or extending away from them. This makes the concentrated nature of hard surfaces much easier to see than on the general map. It also shows why a countywide average can be low even when individual settlements have locally higher percentages of pavement and rooftops.
The central cluster can be read in the context of Butler, the county seat, without treating the colored cells as a precise municipal boundary. Similarly, narrow lines may occur along transportation routes, but the map does not label those routes. The safest description is that hard surfaces cluster around established settlement and transportation areas. Proving that one highway caused development, or identifying a particular facility from a colored pixel, would require different evidence.
Impervious cover can be useful in stormwater lessons or early-stage environmental screening because it identifies surfaces where rainfall is less likely to infiltrate directly. It should not be converted into a flood-risk map. Flooding depends on elevation, soil, drainage infrastructure, rainfall intensity, river stage, and other factors. In Choctaw County, the contrast between low countywide impervious cover and extensive eastern wetlands makes it especially important to keep hard-surface mapping separate from floodplain and hydrologic analysis.
Why the 18.05% wetland share matters more than the 0.82% water share
The forest-and-farmland summary reports only 0.82% open water, so the county is not dominated by blue water pixels by area. Wetlands, at 18.05%, are a different story. Comparing those figures prevents a common map-reading mistake: treating every water-influenced landscape as open water. A river channel, a wooded floodplain, and a seasonally wet lowland can appear in different classes even when they belong to the same broader river environment.
Choctaw National Wildlife Refuge provides a useful official reference for that river setting. The U.S. Fish and Wildlife Service places the refuge on the west bank of the Tombigbee River and describes extensive lakes, sloughs, creeks, and bottomland hardwoods there. The refuge is only one defined area within the county, however. Its boundary is not drawn on the supplied land-cover map, so the broad teal zone along the east should not be labeled as refuge land without a separate boundary layer.
This distinction is practical for environmental education and preliminary watershed work. A student can start with the general map, note that wetland cover is far more extensive than open water, and then examine why river valleys can contain large areas of water-influenced vegetation. A planner or researcher can use the same pattern to identify places for follow-up with elevation, hydrography, floodplain, or regulatory wetland data. The map is a screening reference, not a jurisdictional wetland determination.
Forest and farmland become easier to separate in the simplified view
The forest-and-farmland map reduces some of the visual complexity of the general land-cover image. Its summary lists forest at 57.98%, agriculture at 4.38%, grassland at 7.35%, shrubland at 6.97%, wetlands at 18.05%, and water at 0.82%. With developed and other surfaces muted, the continuity of the forest is clearer, especially through the center and southern half of the county. The map also makes the scattered nature of agricultural cover easier to see.
Agriculture does not form one continuous belt. Yellow areas appear as small and medium patches among forest, grass, and shrub cover, with many more green cells surrounding them. That pattern is useful when describing Choctaw County as a rural county without implying that farmland covers most of its area. The land-cover class also does not identify crop type, ownership, field boundaries, or whether a specific patch is actively farmed in the way a parcel-level agricultural record might show.
Forestry is important enough locally that a second official dataset provides useful context. The Alabama Forestry Commission’s 2022 Forest Resource Report lists 526,190 acres of timberland in Choctaw County. Timberland is not the same metric as the 57.98% Annual NLCD forest class: the forestry inventory uses its own resource definitions, while NLCD records satellite-based surface cover for 2025. The figures should not be merged, but together they reinforce the need to distinguish forest cover from forest-resource inventory.
Ownership is another separate question. A green pixel can represent private forest, public land, industrial timberland, or another wooded property without revealing which one it is. Choctaw County’s Revenue Commissioner page directs users to a Public GIS for ownership mapping and property records. When a task involves parcel boundaries, tax ownership, or legal property information, those county records are the appropriate next step rather than trying to extract parcel facts from the land-cover raster.
The 45.52% 1985–2025 class difference is not a development rate
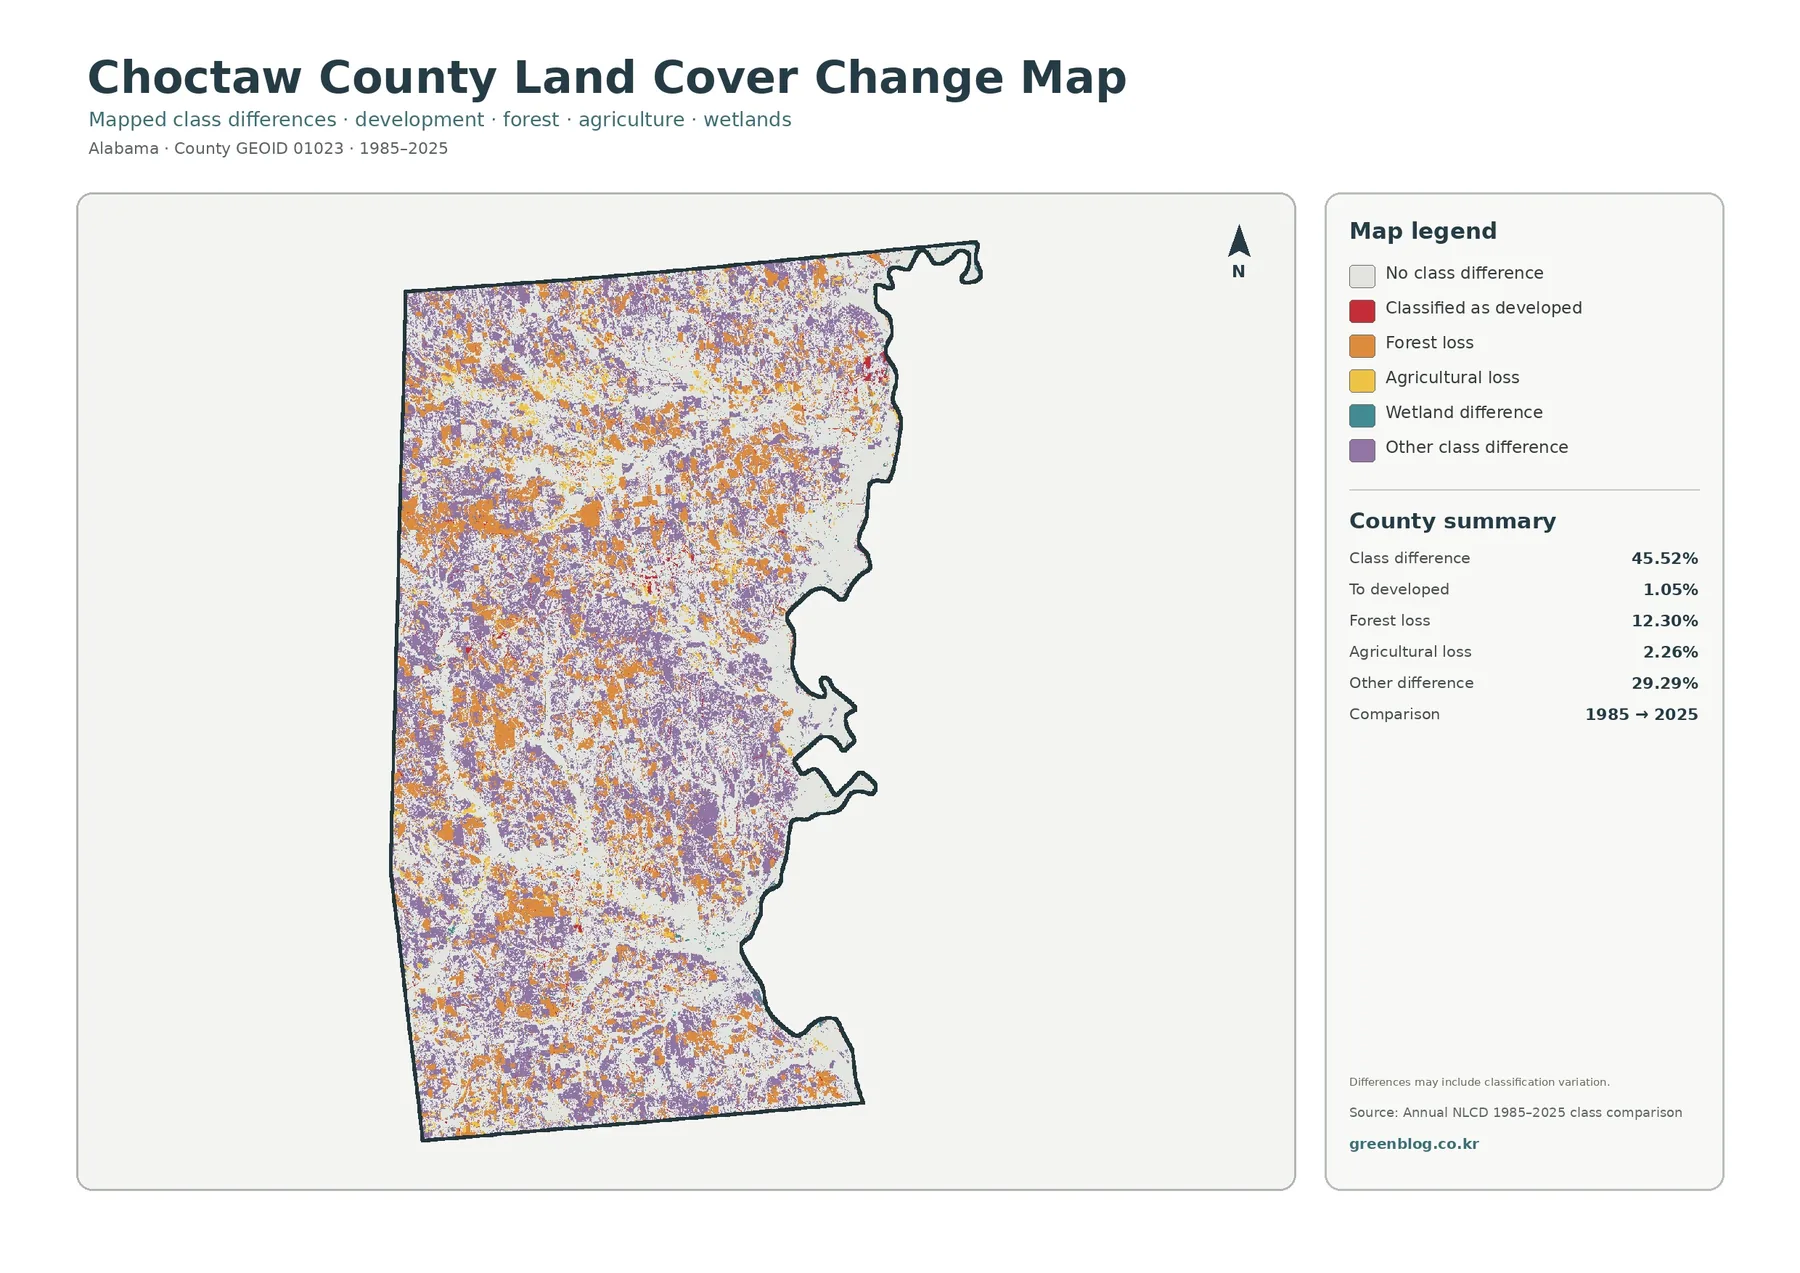
The change map compares classification at two endpoints, 1985 and 2025. Its county summary reports a 45.52% class difference. Within that total, 1.05% is classified to developed, 12.30% is shown as forest loss, 2.26% as agricultural loss, and 29.29% as other class difference. Wetland difference also has its own legend color, but the map summary does not provide a separate percentage for it, so no additional figure should be inferred.
Orange forest-loss cells and purple other-difference cells are widespread, especially across the west, center, and south. Red cells classified to developed are far more limited and occur in small clusters. This visual contrast is the clearest reason not to describe 45.52% as the portion of Choctaw County that urbanized. The headline number combines several types of class changes, many of which have nothing to do with pavement or buildings.
The 12.30% forest-loss category also needs careful wording. It identifies cells that were classified as forest at the earlier endpoint and something else at the later endpoint. It does not by itself establish permanent deforestation, a particular harvest event, or a specific land-management cause. Regrowth stages, transitions to shrub or grass, agriculture, development, and classification differences can all contribute to the endpoint pattern. Intermediate annual layers are needed to study timing.
A note on the change graphic also says that some mapped differences can reflect classification variation. Annual NLCD is a raster product, so mixed 30-meter cells can change category when vegetation condition, imagery, or classification behavior changes. For a location-specific question, a better workflow is to inspect several Annual NLCD years and current aerial photography instead of relying only on 1985 and 2025. That approach separates a persistent land-cover shift from a one-year or classification-related difference more effectively.
A practical order for reading all four maps
Start with the general land-cover map and use the irregular Tombigbee-side boundary as an anchor. Note the broad green interior, the teal wetland concentration along the east, and the smaller developed clusters. That establishes the countywide pattern before any single percentage receives too much attention. It also makes the same places easier to locate when the color scheme changes on the other three maps.
Next, use the forest-and-farmland map if the question concerns vegetation or rural land cover. It removes some of the developed-map clutter and makes the forest-agriculture relationship easier to follow. Switch to the impervious map when the question becomes specifically about hard surfaces. Comparing 4.39% developed cover with a 0.68% mean impervious value is a useful way to explain why a developed class includes more than pavement and rooftops.
Save the change map for the final comparison. Current land cover and endpoint class difference answer different questions, even when similar colors appear on both. A forest cell in 2025 describes current surface cover; an orange change cell describes a relationship between two years. Keeping those meanings separate prevents the most common mistake in county change graphics: treating a class-difference percentage as a current land-cover share.
For teaching, the set can demonstrate forest dominance, floodplain wetlands, scattered agriculture, concentrated hard surfaces, and the difference between condition and change. For preliminary planning or environmental review, it can help divide the county into broad areas for follow-up. Exact property decisions still need parcel records, and detailed water questions still need hydrography, elevation, flood, or wetland datasets. The four maps are strongest as an organized county-scale reference.
Download the four original JPG maps and keep the map scale in mind
The ZIP download contains four original JPG files: the 2025 general land-cover map, the forest-and-farmland map, the impervious-surface/developed-land map, and the 1985–2025 land-cover change map. Each image is 2480×1754 pixels, compared with the 1800-pixel-wide WebP previews used in the article. Because all four files use the same Choctaw County outline, they can be aligned easily in a report or slide deck.
The asset manifest does not mark these JPG files as meeting an A3 high-resolution reference. They remain useful for screen viewing, ordinary documents, and many classroom prints, but large-format output should be tested before final use. Enlarging the JPG also does not create finer land-cover information than the underlying dataset. Pixel dimensions and the 30-meter spatial resolution of Annual NLCD describe different things.
County comparisons work best when the year and map type are matched. The 57.98% forest figure belongs with other 2025 land-cover summaries created from the same classification. The 45.52% class-difference figure belongs with 1985–2025 change comparisons and should be labeled as such. Keeping the figures in separate columns or captions makes a presentation much easier to understand.
What 30-meter raster classification can and cannot tell you
USGS describes Annual NLCD as a 30-meter spatial-resolution raster product. A raster divides the landscape into regular cells and assigns a representative class or value to each one. A single cell can contain trees, lawn, a small road, a building, and a stream edge at the same time. The final class is therefore a generalized representation of the cell, not a survey of every object inside it.
Surface-cover classification should not be confused with zoning, ownership records, or legally defined land use. A forest pixel does not identify a private landowner, timber right, conservation easement, or public boundary. An agricultural pixel does not name the crop or farm operator. Choctaw County’s official property GIS and related records are better sources for parcel questions, while regulatory wetland or permit questions require the appropriate agency information rather than an NLCD class.
The 2025 layer is a snapshot of the classification for that mapping year. Construction, harvest, vegetation recovery, or agricultural changes after that observation period are not represented. The 1985–2025 map also compares two endpoints and does not tell the complete sequence of events between them. Used with these limits in mind, the maps are valuable because they quickly show where forest, wetlands, open land, and developed surfaces differ across a large county.
Frequently Asked Questions
What is the largest 2025 land-cover class in Choctaw County?
Forest is the largest class at 57.98%. Wetlands follow at 18.05%, then grassland at 7.35%, shrubland at 6.97%, and developed cover at 4.39%. The spatial pattern matters as much as the percentages: wetlands are especially prominent along the eastern river corridor, while forest occupies much of the interior.
Does the 18.05% wetland figure mean 18% of the county is open water?
No. Open water is listed separately at 0.82% in the forest-and-farmland summary. Wetland classes include water-influenced land with characteristic vegetation and surface conditions, not only visible river or lake water. The Tombigbee River and Choctaw National Wildlife Refuge provide useful regional context, but the map does not draw the refuge or legal wetland boundaries.
Why is developed cover 4.39% when mean impervious cover is only 0.68%?
Developed land can contain buildings and roads together with lawns, trees, soil, and other permeable surfaces. Impervious cover measures the hard portion such as pavement and rooftops. A low-density settlement can therefore be classified as developed while most of the cell still allows water to infiltrate.
Does the 45.52% class difference mean nearly half the county became developed?
No. Only 1.05% is summarized as classified to developed. The 45.52% total also contains 12.30% forest loss, 2.26% agricultural loss, 29.29% other class difference, and wetland differences. Classification variation may be included, so the change map should be checked against intermediate Annual NLCD years and aerial imagery for location-specific questions.
Which JPG files come in the ZIP?
The ZIP contains four 2480×1754 JPG maps: general 2025 land cover, forest and farmland, impervious surface and developed land, and the 1985–2025 class comparison. They are larger than the WebP previews in the article, but the manifest does not label them as meeting an A3 high-resolution reference, so test large-format printing before relying on fine text.
Map File Information
Choctaw County Land Cover Maps 2025 land cover, forest & farmland, impervious/developed land, and 1985–2025 class-difference maps in four original JPG files
- Included Files: Use only the versions confirmed in the article and supplied images
- File Type: Use the confirmed download contents
- Intended Use: Printing, education, presentations, and map-based projects
Related Maps
- Autauga County Alabama Land Cover Map
- Baldwin County Alabama Land Cover Map
- Barbour County Alabama Land Cover Map
Sources and reference links
- MRLC Annual NLCD Data – official access to Annual NLCD land-cover and impervious-surface products, including the 2025 release.
- USGS Annual National Land Cover Database – official description of Collection 1.2, 2025 data, annual products, and 30-meter spatial resolution.
- U.S. Census Bureau TIGER/Line Shapefiles – a federal source for the county outline and other geographic reference layers.
- U.S. Fish & Wildlife Service – Choctaw National Wildlife Refuge – official information about the Tombigbee River refuge, wetlands, water features, and bottomland hardwood habitat.
- Choctaw County Revenue Commissioner – official county property-record information and access guidance for the county’s Public GIS.
- Alabama Cooperative Extension System – Choctaw County – county-level Extension contacts for agriculture, forestry, wildlife, water, and related topics.
- Alabama Forestry Commission Forest Resource Report 2022 – official forest-resource statistics for Choctaw County and southwest Alabama.
- Encyclopedia of Alabama – Choctaw County – trusted county geography context for the Tombigbee River, Butler, and major highways.
Green Map creates custom-edited map images using open geographic data sources such as geoBoundaries, Natural Earth, OpenStreetMap, and government open data.
These maps are edited visual materials, not raw data files, and are provided for education, documents, presentations, and graphic reference.