Butler County in south-central Alabama is predominantly forested in the 2025 land-cover data, yet the county is far from uniform. Agricultural openings, wetlands, grass and shrub cover interrupt the woodland, while developed surfaces become much more visible around Greenville and Georgiana. The four maps on this page separate those features so the same county can be viewed as a current land-cover mosaic, a forest-and-farmland landscape, an impervious-surface pattern, and a long-term class comparison.
All four original JPG maps are available in one download. The web previews are useful for choosing a view, while the larger files can be saved for a report, classroom handout, presentation, regional reference project, or follow-up comparison with other land and environmental data.
Table of Contents
A forest majority with several other cover types mixed in
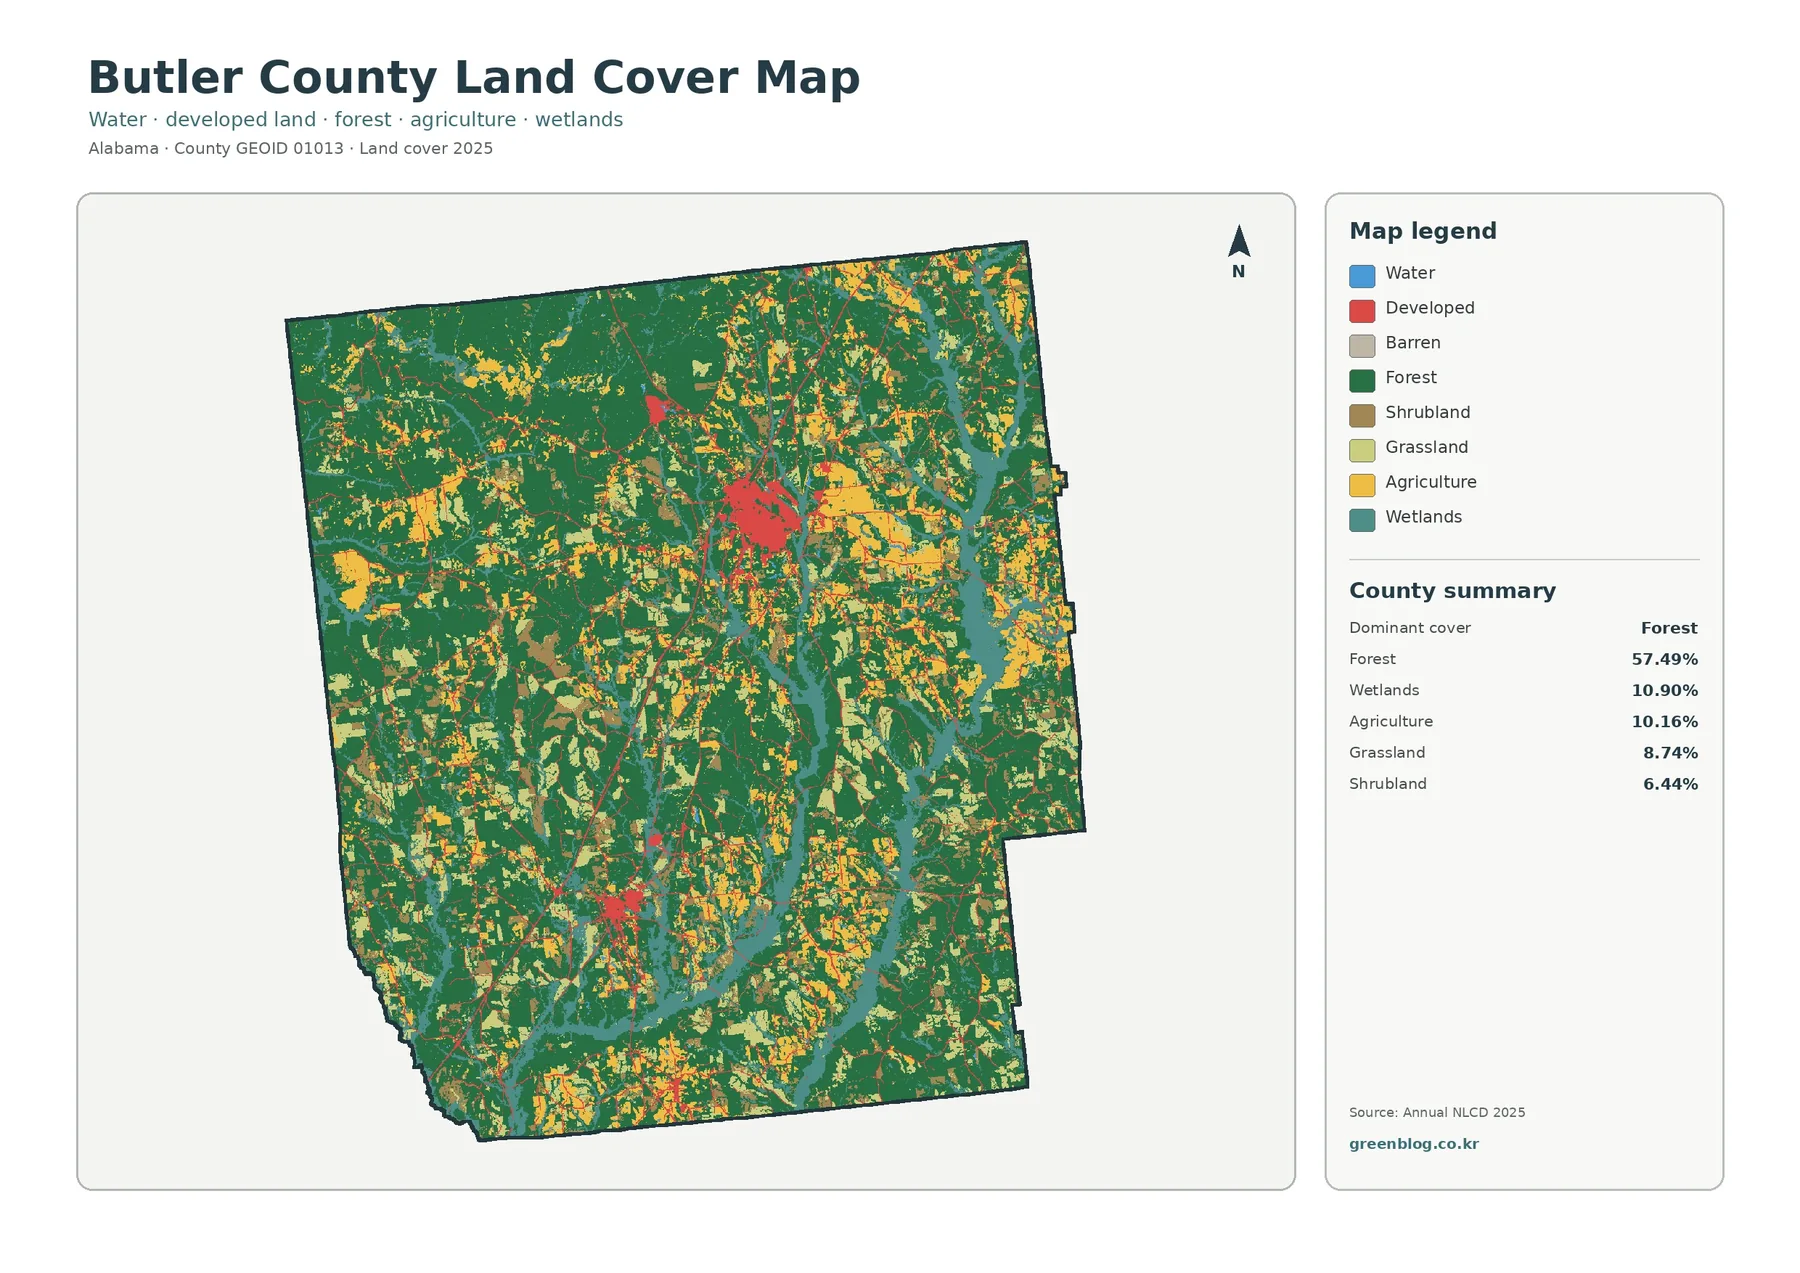
Forest accounts for 57.49% of Butler County in the 2025 summary, making it the dominant mapped cover by a wide margin. Wetlands represent 10.90%, agriculture 10.16%, grassland 8.74%, and shrubland 6.44%. Water covers only 0.32%, but that small percentage should not be mistaken for an absence of water-related landscapes because the wetland class occupies a much larger area and follows many drainage features through the county.
The overall map shows broad dark-green forest across the north, west, and large parts of the interior. Agricultural and open-cover colors appear repeatedly between those wooded blocks, especially through central and eastern portions of the county. Teal wetlands form winding ribbons and wider patches in several eastern and southern areas. The result is a layered pattern: forest provides the largest continuous background, but the county’s surface becomes increasingly mixed when the smaller classes are examined at local scale.
Butler County lies in Alabama’s East Gulf Coastal Plain. Greenville is the county seat and largest city, and regional reference material identifies Interstate 65 as the main north-south transportation route, with U.S. 31 and State Route 10 also serving the county. Developed land is visibly clustered around settlement and transportation corridors on the maps, but the maps do not establish that a particular highway caused development. They show proximity and concentration, not a complete history of why the land changed.
Where forest gives way to farmland and open ground
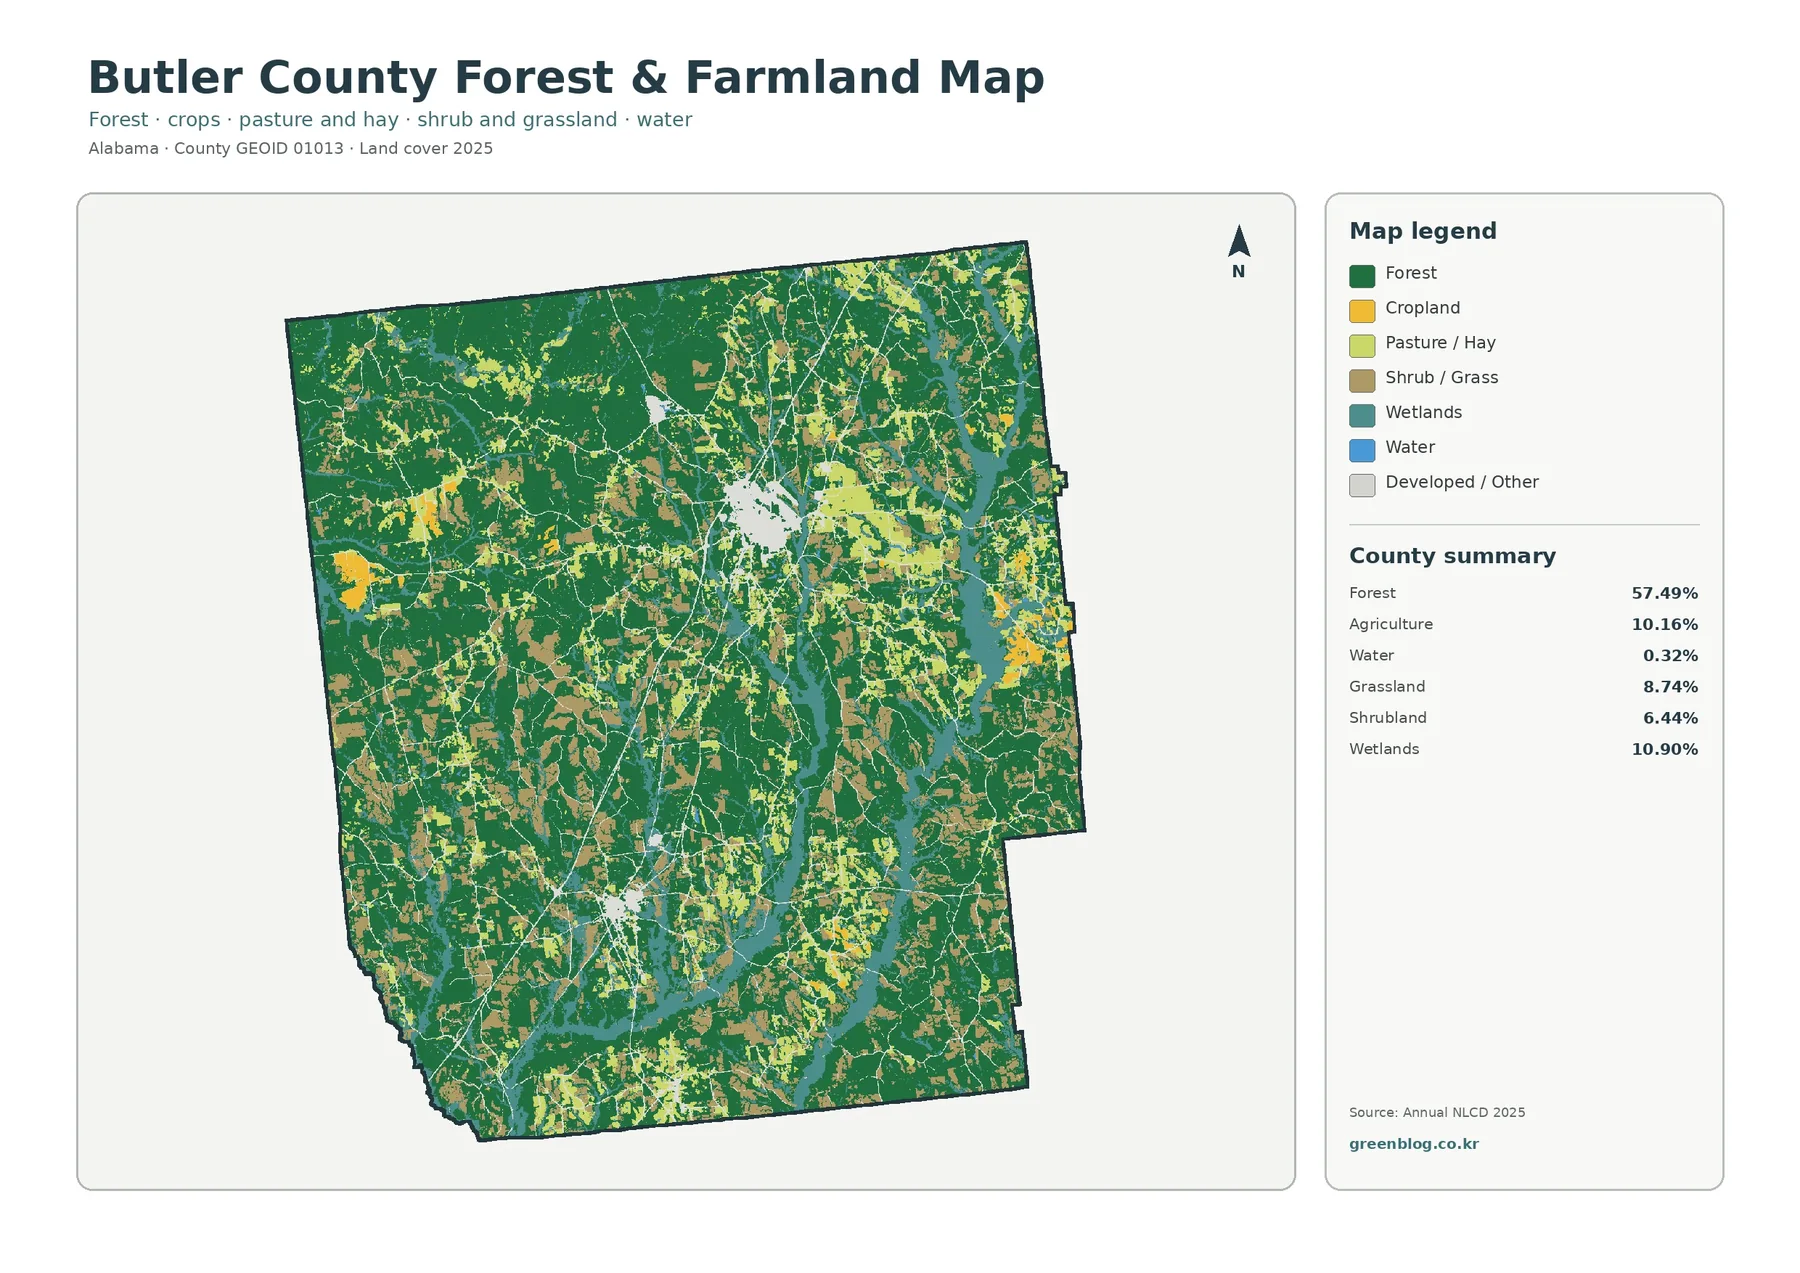
The forest-and-farmland view removes some of the visual complexity of the full land-cover legend. Dark green still dominates, but cropland, pasture or hay, and shrub or grass cover stand out as separate openings. These open areas do not form one uninterrupted farm belt. Instead, they appear as large and small patches surrounded by woodland, creating many edges where forest and agricultural cover meet.
The 10.16% agriculture figure gives a countywide measure, while the map answers the more practical question of location. Farm-related cover is distributed through several parts of the county, with noticeable concentrations in the central and eastern half and smaller patches elsewhere. Grassland and shrubland add another layer of open cover between forest blocks. For a classroom or presentation, this simpler view is often easier to read than the full map when the main question is how wooded and open rural land are arranged.
These colors should not be interpreted as parcel or zoning categories. Land cover describes what the surface is classified as—trees, crops, pasture, water, wetlands, development, and similar classes. A field-colored pixel does not prove that the property is legally zoned for agriculture, and a forest-colored pixel does not mean the land is public or protected. Ownership and legal land use require separate county records or parcel-level GIS information.
Greenville and Georgiana stand out on the impervious map
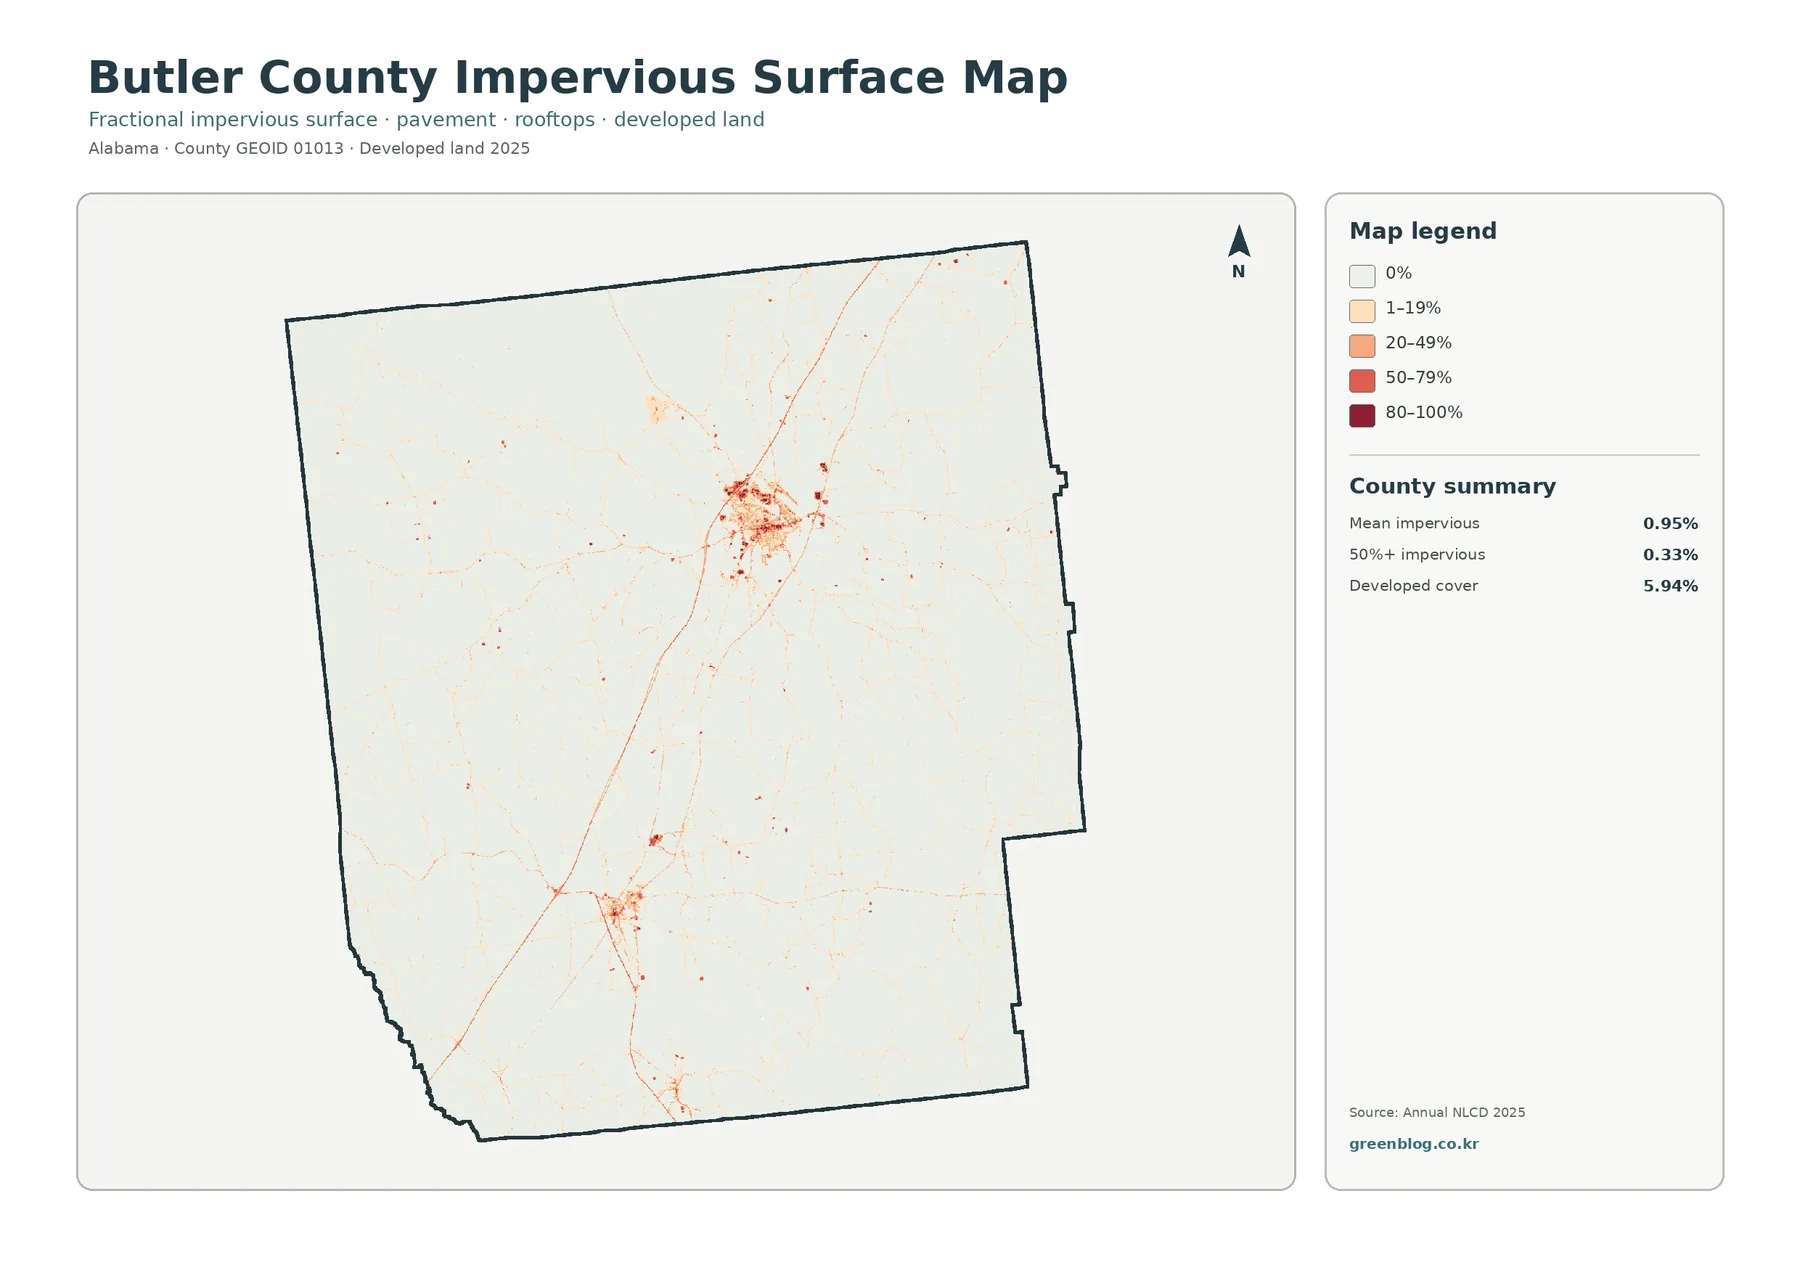
Impervious surface means pavement, rooftops, parking areas, and other hard surfaces that do not readily absorb rainfall. Butler County has a mean impervious value of 0.95%, and 0.33% of the county is mapped at 50% impervious or higher. Developed land, a broader land-cover class, totals 5.94%. Those values match the visual impression of a largely rural county with a limited number of concentrated built-up areas.
The strongest cluster appears around Greenville in the north-central part of the county. Farther south, Georgiana produces a smaller but still clear concentration. Fine linear traces connect and extend beyond those centers, reflecting the pattern of paved transportation routes through an otherwise low-impervious landscape. Interstate 65 and U.S. 31 are major county routes in regional references, but an individual line on this raster map should not be labeled as a specific road unless it is checked against a road map.
Developed cover and imperviousness answer related but different questions. A developed land-cover class can include lawns, scattered trees, and other surfaces that still absorb water. The impervious layer focuses on the hard fraction within a mapped cell. That distinction explains why developed cover can reach 5.94% while average imperviousness remains below one percent. It also makes the impervious map the better choice when the question concerns pavement and rooftops rather than the broader extent of settlement.
Wetland corridors add detail that water alone does not show
Wetlands cover 10.90% of Butler County in the 2025 summary, more than thirty times the mapped water share of 0.32%. That contrast is important. A reader who looks only for blue water pixels could underestimate how much of the county’s landscape is associated with wet ground, stream margins, and other wetland environments. The teal wetland class forms long, branching shapes that cross forest and open land in several parts of the county.
Regional geography references identify Wolf Creek in the northwestern corner and Panther, Persimmon, and Pigeon Creeks in the southern part of Butler County. The land-cover maps on this page are not labeled hydrography maps, so every wetland ribbon should not be assigned to one named creek. Still, the named drainage network provides useful local context for the winding wetland shapes visible on the map, especially where they run through otherwise forested areas.
Wetland boundaries also illustrate the limits of a generalized raster map. A narrow channel, wooded swamp, open wet area, and forest edge can occur close together on the ground, while a 30-meter data cell must summarize that small area consistently. For countywide comparison the resulting pattern is valuable, but it is not a wetland delineation for permitting, property transactions, or regulatory decisions. Those purposes require current site-specific information from the appropriate agency.
Reading the 1985–2025 class comparison carefully
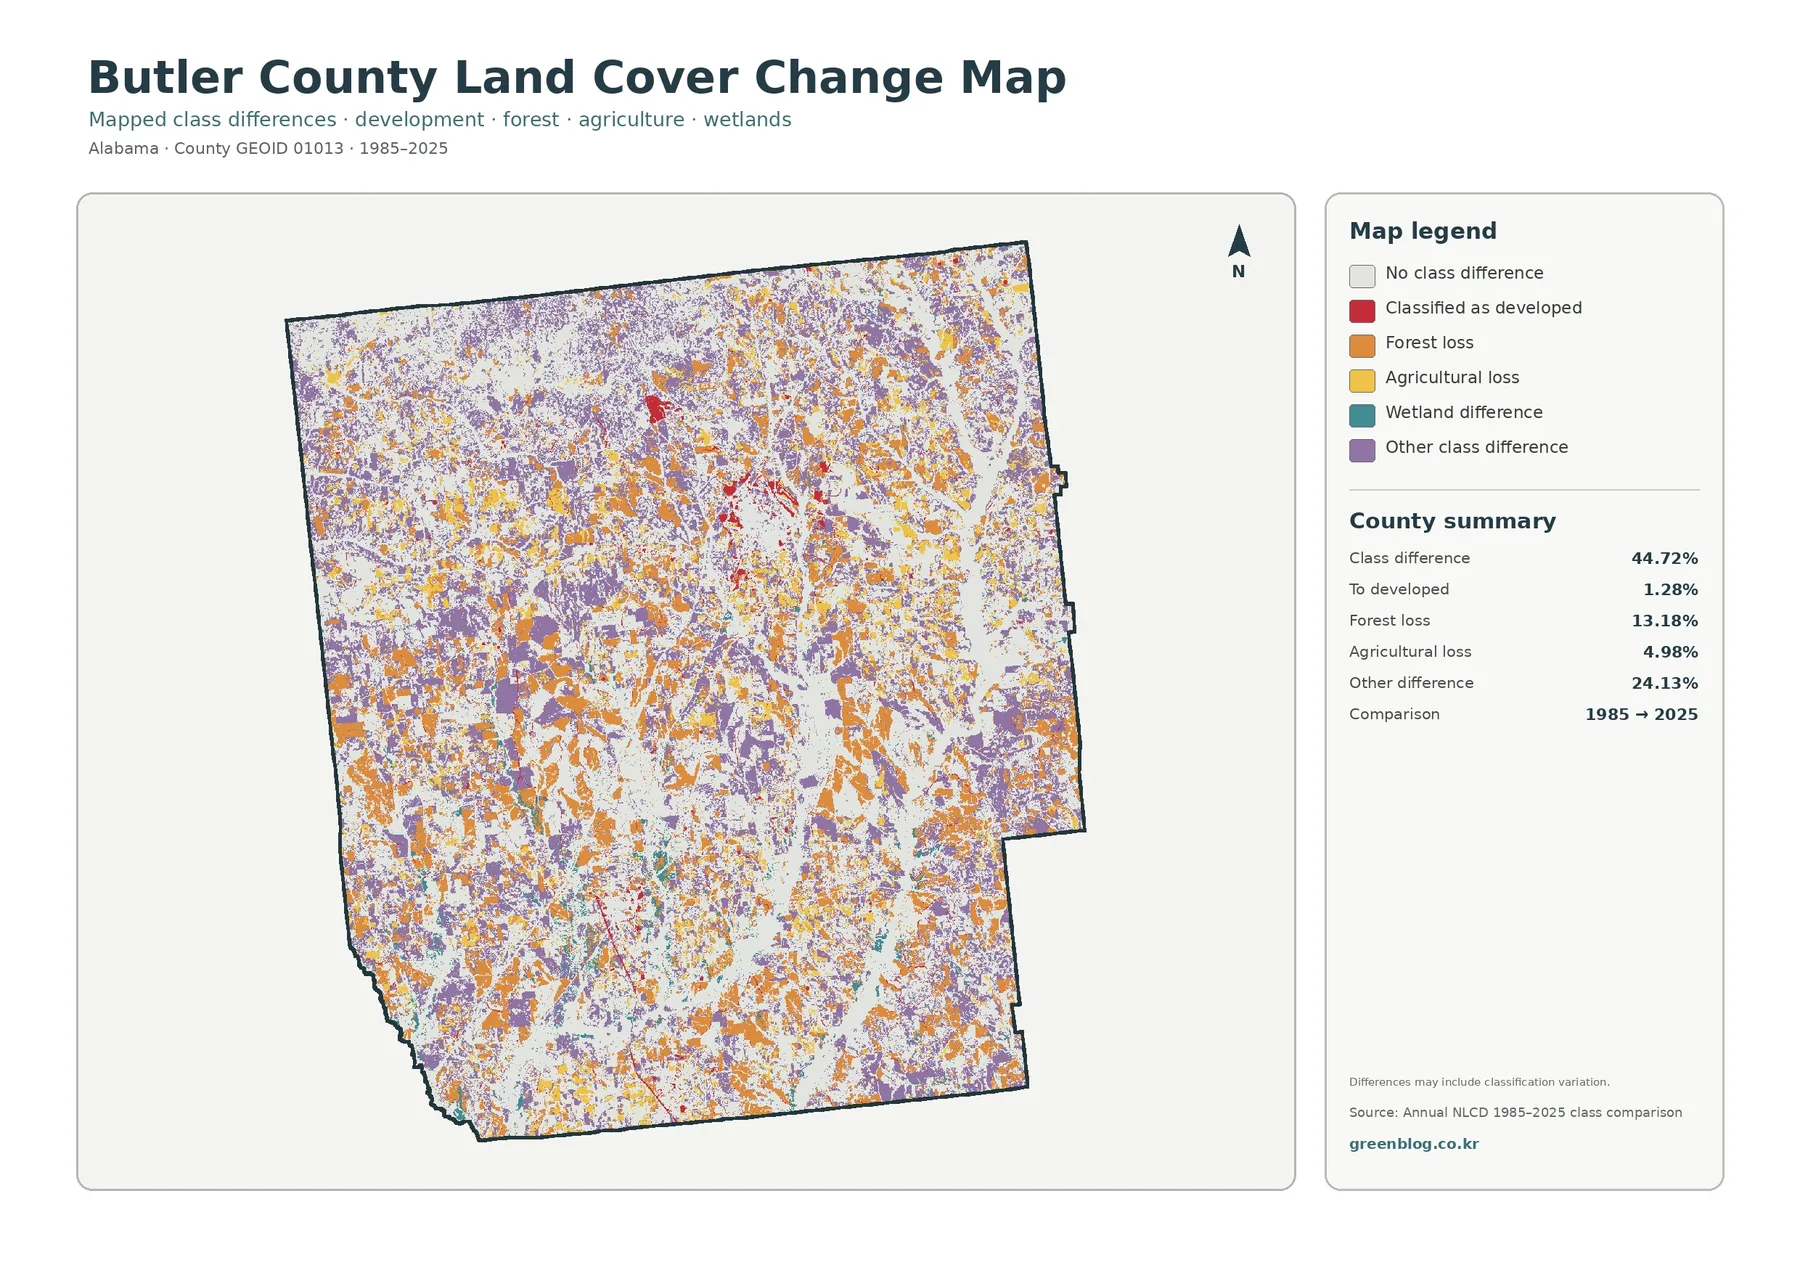
The change map compares mapped classes for 1985 and 2025. It reports a class difference across 44.72% of Butler County. Within that total, 1.28% is labeled as changed to developed, 13.18% as forest loss, 4.98% as agricultural loss, and 24.13% as other class difference. White areas indicate no mapped class difference under this comparison, while red, orange, yellow, teal, and purple identify different categories of change.
The 44.72% figure does not mean that nearly half of the county underwent one simple physical conversion. The map itself warns that the differences may include classification variation. Annual NLCD is designed to support long-term comparison, but satellite observations and classification decisions can assign a cell differently at two dates without telling the reader the exact cause. A colored location therefore shows where the mapped classes differ, not why a landowner or natural process produced that difference.
Forest-loss and other-difference colors are spread widely across the county rather than being limited to a single zone. Changed-to-developed areas are much smaller in total and become more noticeable around the existing settlement pattern and along some linear corridors. Comparing this map with the 2025 impervious layer is useful because it separates two ideas: where hard surfaces are concentrated today and where a land-cover class differs from its 1985 label.
How the four Butler County maps work together
Use the full 2025 land-cover map first when the goal is to understand the county as a whole. It puts the 57.49% forest share in context by showing exactly where wetlands, agriculture, grass, shrub cover, and developed land break up the woodland. The forest-and-farmland version is better when the audience needs a cleaner rural-landscape comparison and does not need every class to have equal visual weight.
The impervious map is more specialized. It makes Greenville and Georgiana stand out against the larger rural area and helps separate a built-surface question from a general land-cover question. The change map is specialized in a different way because it is about two dates. It is most useful after the current maps have established the 2025 pattern, giving the reader a present-day reference before interpreting colored class differences.
For a report or presentation, choosing one or two maps that match the question is usually clearer than placing all four on one crowded page. A forest and farming discussion may need the overall map plus the forest-farmland view. A development discussion may pair the overall map with impervious surfaces. A time-based project can place the 2025 map beside the 1985–2025 comparison so current conditions and change categories remain visually distinct.
Download the original JPG map set
The download ZIP contains four original JPG files: the 2025 land-cover map, the forest and farmland map, the impervious surface and developed-land map, and the 1985–2025 land-cover change map. Each file is 2480×1754 pixels. The files are larger than the web preview images and use the same Butler County boundary with different legends, making it easy to switch between broad landscape context and a focused question without changing geographic extent.
These maps can support classroom exercises, local-reference documents, project planning, and presentation graphics. They are also useful as a first screening step before opening more detailed datasets. For example, a user can identify an area with strong wetland color or a cluster of hard surfaces, then decide whether a parcel map, aerial image, stream dataset, or annual land-cover time series is needed for the next stage of research.
Resolution and classification limits
Annual NLCD is a raster dataset. In simple terms, the ground is divided into a regular grid and each cell receives a land-cover class or numerical value. Annual NLCD land-cover products use 30-meter spatial resolution. A cell may contain trees, grass, pavement, water, and buildings in the real world even though the final product has to summarize that area in a consistent way. Small features can therefore be generalized or omitted.
Zooming farther into the image does not create parcel-level accuracy. Narrow roads and streams can look wider, thinner, or broken compared with detailed local data, and a field edge may not match a legal property line. The impervious layer is also a fractional surface measure rather than a building-footprint survey. These maps are best for countywide patterns and broad local comparisons, not for measuring a driveway, locating a property corner, or making a regulatory decision.
The 2025 map represents the classified surface for that mapping year. Logging, construction, crop rotation, storms, vegetation recovery, and other changes after the observation period are not included. The 1985–2025 map compares two end dates and does not show every intermediate transition. A detailed time-series study should use the individual Annual NLCD years available through MRLC instead of assuming that an endpoint comparison contains the complete history.
Frequently Asked Questions
What is the largest land-cover class in Butler County?
Forest is the largest class in the 2025 summary at 57.49%. Wetlands account for 10.90%, agriculture 10.16%, grassland 8.74%, and shrubland 6.44%. The forest majority is clear, but the map still contains many agricultural, wetland, grass, and shrub patches that make the county visually diverse.
Does the 44.72% class-difference figure mean that almost half the county was developed?
No. The 44.72% value is the total area with a mapped class difference between 1985 and 2025. Only 1.28% is labeled as changed to developed. Forest loss is 13.18%, agricultural loss is 4.98%, and other difference is 24.13%. Classification variation can also contribute, so the total should not be treated as a direct measure of physical development.
Can these maps show property boundaries or zoning in Greenville or Georgiana?
No. These are generalized land-cover and impervious-surface maps rather than parcel, ownership, or zoning maps. They are useful for landscape-scale reference and comparison. Property-specific questions should be checked against current Butler County land records, parcel GIS, or the appropriate local agency.
Map File Information
Butler County Land Cover Maps Four original JPG maps covering 2025 land cover, forest and farmland, impervious surfaces, and the 1985–2025 class comparison.
- Included Files: Use only the versions confirmed in the article and supplied images
- File Type: Use the confirmed download contents
- Intended Use: Printing, education, presentations, and map-based projects
Related Maps
- Autauga County Alabama Land Cover Map
- Baldwin County Alabama Land Cover Map
- Barbour County Alabama Land Cover Map
Sources and references
- MRLC Annual NLCD Data — access to annual land-cover products
- USGS Annual NLCD Land Cover Classification — classification and interpretation reference
- U.S. Census Bureau TIGER/Line Shapefiles — county boundary reference
- Encyclopedia of Alabama – Butler County — county geography, Greenville, roads, and waterways
Green Map creates custom-edited map images using open geographic data sources such as geoBoundaries, Natural Earth, OpenStreetMap, and government open data.
These maps are edited visual materials, not raw data files, and are provided for education, documents, presentations, and graphic reference.