Richmond County covers Staten Island, and its 2025 land-cover summary is dominated by developed land at 78.13%. That figure is only the beginning of the story. A broad forest cluster also occupies the center of the island, with extensive wetland cover toward the west, smaller natural areas in the south, and water or open-cover patches around several edges. The four maps on this page separate those patterns into general land cover, forest and farmland, impervious surface, and mapped class differences from 1985 to 2025.
All four original JPG maps are available together in one ZIP download for printing, classroom work, presentations, and side-by-side reference. Start with the general map for the countywide picture, then use the impervious map to compare hard urban surfaces, the forest-and-farmland view to isolate natural cover, and the class-difference map for the two-date comparison. Land cover describes what is physically covering the ground as classified from remotely sensed data. It does not establish property ownership, zoning, legal wetland limits, or what can be built on a parcel.
Table of Contents
An urban island with large natural breaks
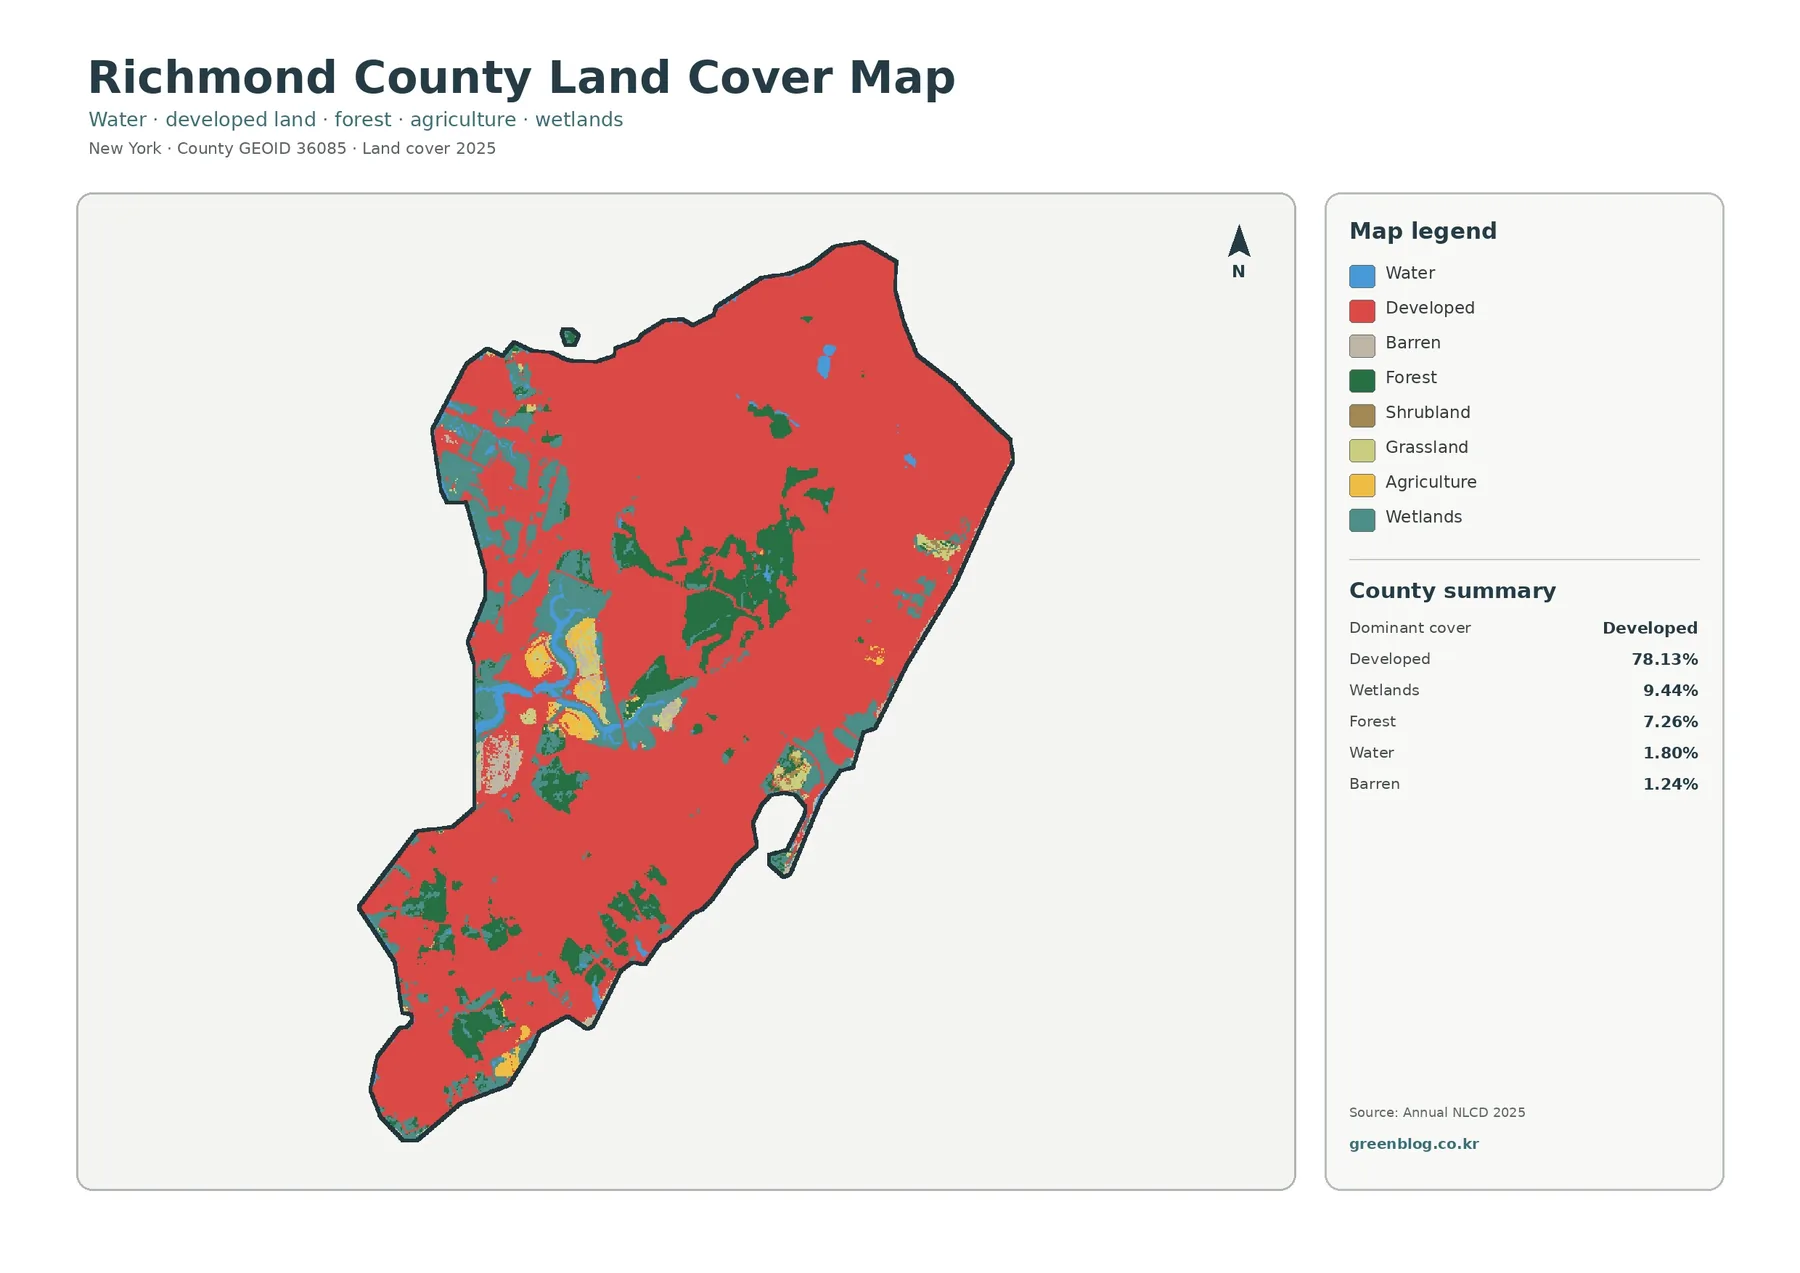
Developed cover fills most of the county on the general map, especially across the north, east, and much of the southern half. Even so, the urban pattern is interrupted by several large areas that are easy to recognize at county scale. A connected green cluster occupies the central part of Staten Island, while broad wetland colors appear farther west. Smaller forest patches occur in the south and southwest, and the northwestern edge contains a more complicated mix of wetlands, water, open cover, and developed land.
The 2025 summary helps put those shapes into proportion. Wetlands account for 9.44% of the mapped area, slightly more than forest at 7.26%. Water is 1.80% and barren cover is 1.24%, while agriculture at 0.99%, grassland at 0.96%, and shrubland at 0.17% make up much smaller shares. This mix matters because Richmond County’s natural cover is not simply a collection of wooded parks. Wetlands form a larger countywide share than forest, and several western areas combine marsh-like cover with water and open land.
Official NYC Parks material on Staten Island natural areas provides useful context for that pattern. The Staten Island Greenbelt includes forest along with freshwater wetlands, grassland, streams, and other natural features, while western sites such as Saw Mill Creek Marsh include marshes and other habitat types. Those descriptions are consistent with the varied colors visible in the center and west of the supplied map. The land-cover boundaries should not be treated as park boundaries, however, because the raster classes describe surface cover rather than ownership or administrative limits.
A quick county overview begins with the contrast between the continuous developed background and the places where natural cover becomes large enough to stand out. That contrast makes Richmond County different from a map where forest or farmland dominates most of the landscape. Here, natural areas appear as substantial breaks inside an overwhelmingly developed island. Once those breaks are located, the other maps can answer more specific questions about how hard the urban surface is and what kinds of natural cover remain.
Hard surfaces vary inside developed neighborhoods
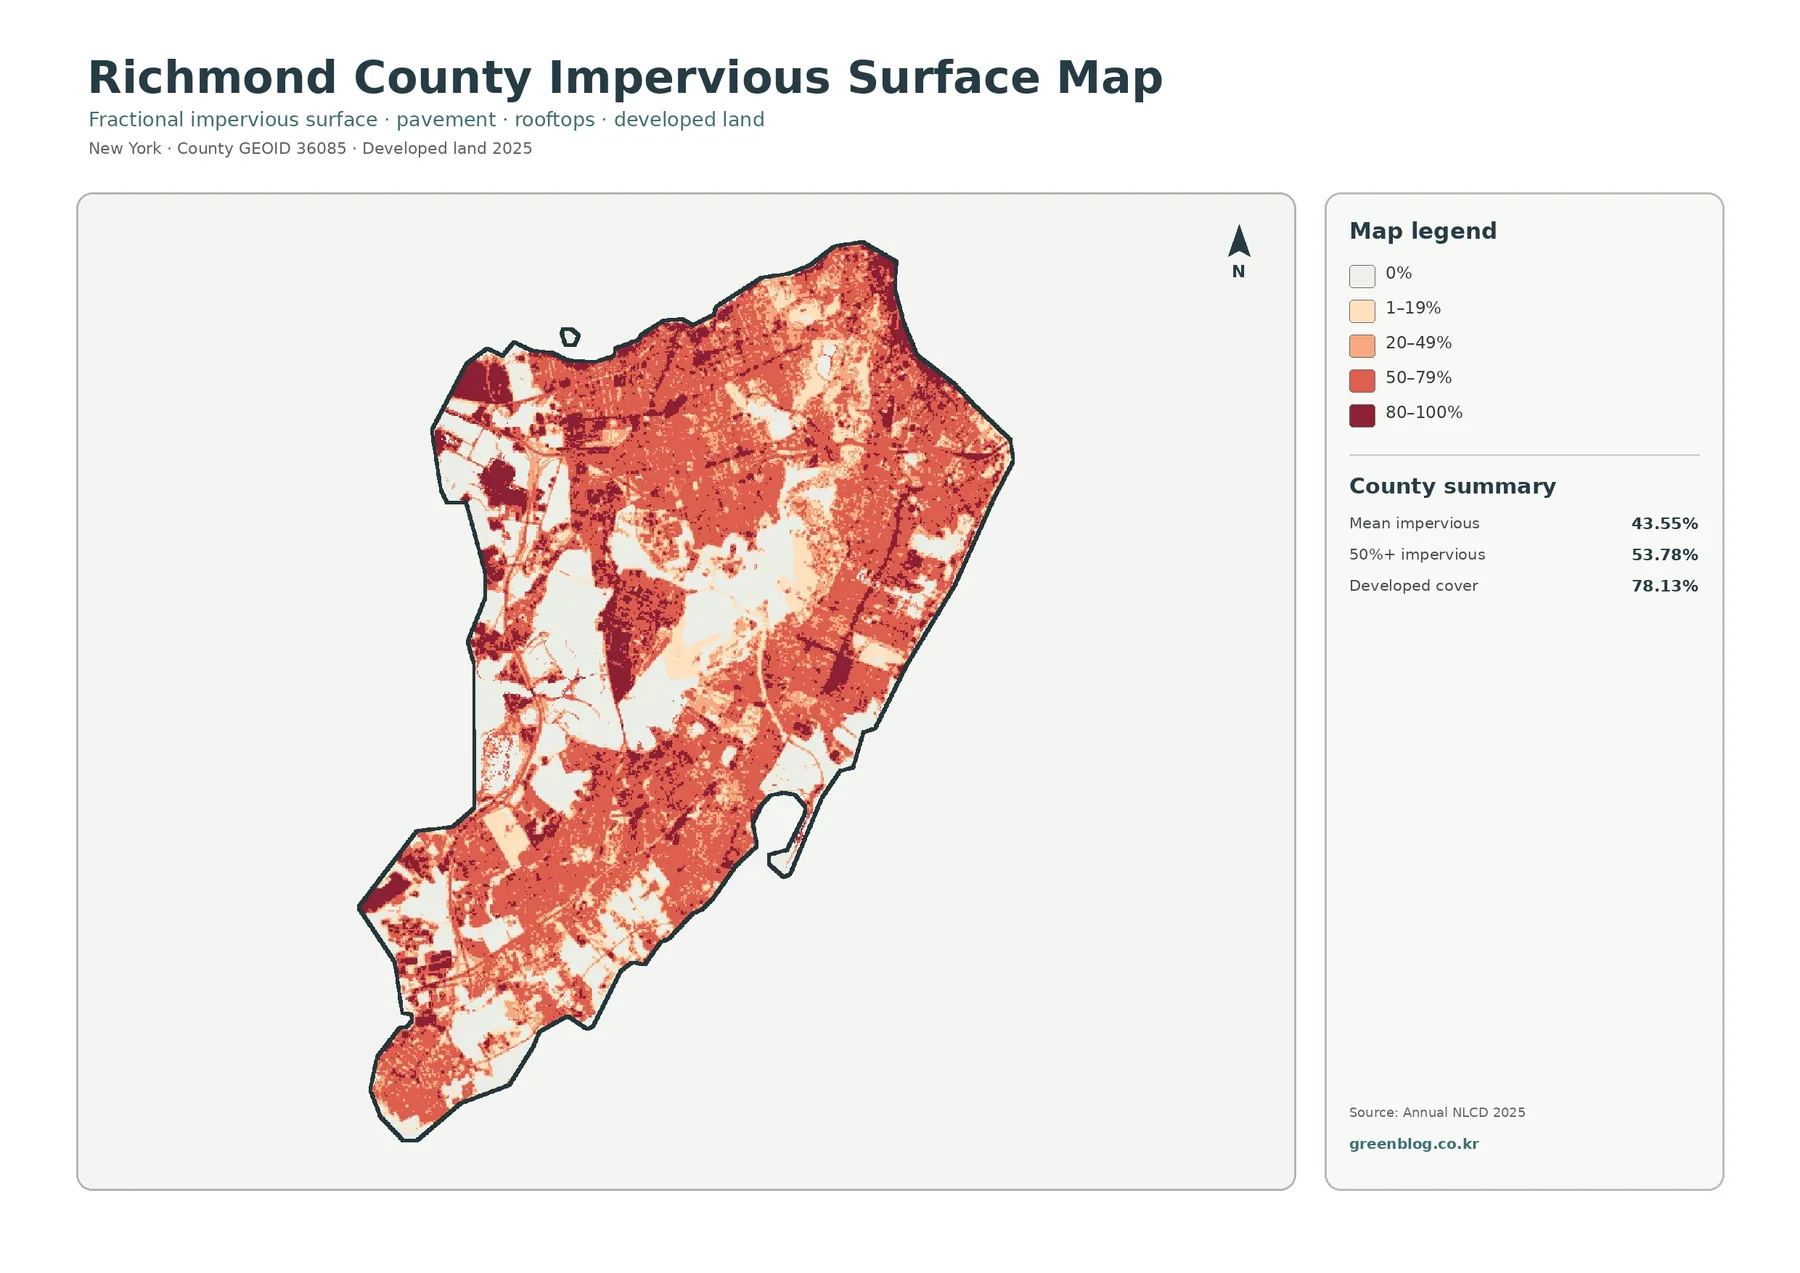
Impervious surface means pavement, rooftops, parking areas, and similar materials that keep most rainfall from soaking directly into the ground. The county has a mean impervious value of 43.55%, and 53.78% of the mapped area falls at 50% impervious or higher. Those numbers are lower than the 78.13% developed-cover share because a developed cell can still contain lawns, trees, soil, gardens, and other permeable surfaces. The two measures describe related but different parts of the urban landscape.
The strongest impervious colors are spread across many northern, eastern, and southern neighborhoods, but they are not uniform. Darker clusters sit beside medium and lighter developed areas, creating a fine-grained pattern that the general land-cover map cannot show. Large pale gaps coincide with the central forest and with broad wetland areas in the west. This makes the impervious map especially useful when the question is not simply whether an area is developed, but how intensely rooftops and pavement cover the ground within that developed setting.
A classroom comparison can use the general map and the impervious map side by side. On the first image, many neighborhoods share the same developed class; on the second, those same places separate into several levels of hard-surface coverage. The contrast is a practical way to explain why “developed” does not mean “completely paved.” It also helps readers see why a large green or wetland area creates a much stronger break in the impervious pattern than a typical residential block with lawns and street trees.
Impervious cover can be relevant to stormwater or urban-heat studies, but this image should not be used as a flood-risk or temperature map. Flooding also depends on elevation, drainage, tides, rainfall, soils, and nearby water. Heat conditions can change with shade, vegetation, building form, wind, and coastal influence. The safe interpretation is narrower: this map identifies where hard surfaces are more or less concentrated across Richmond County and provides a starting layer for a broader environmental analysis.
Forest, wetlands, and small open-cover patches
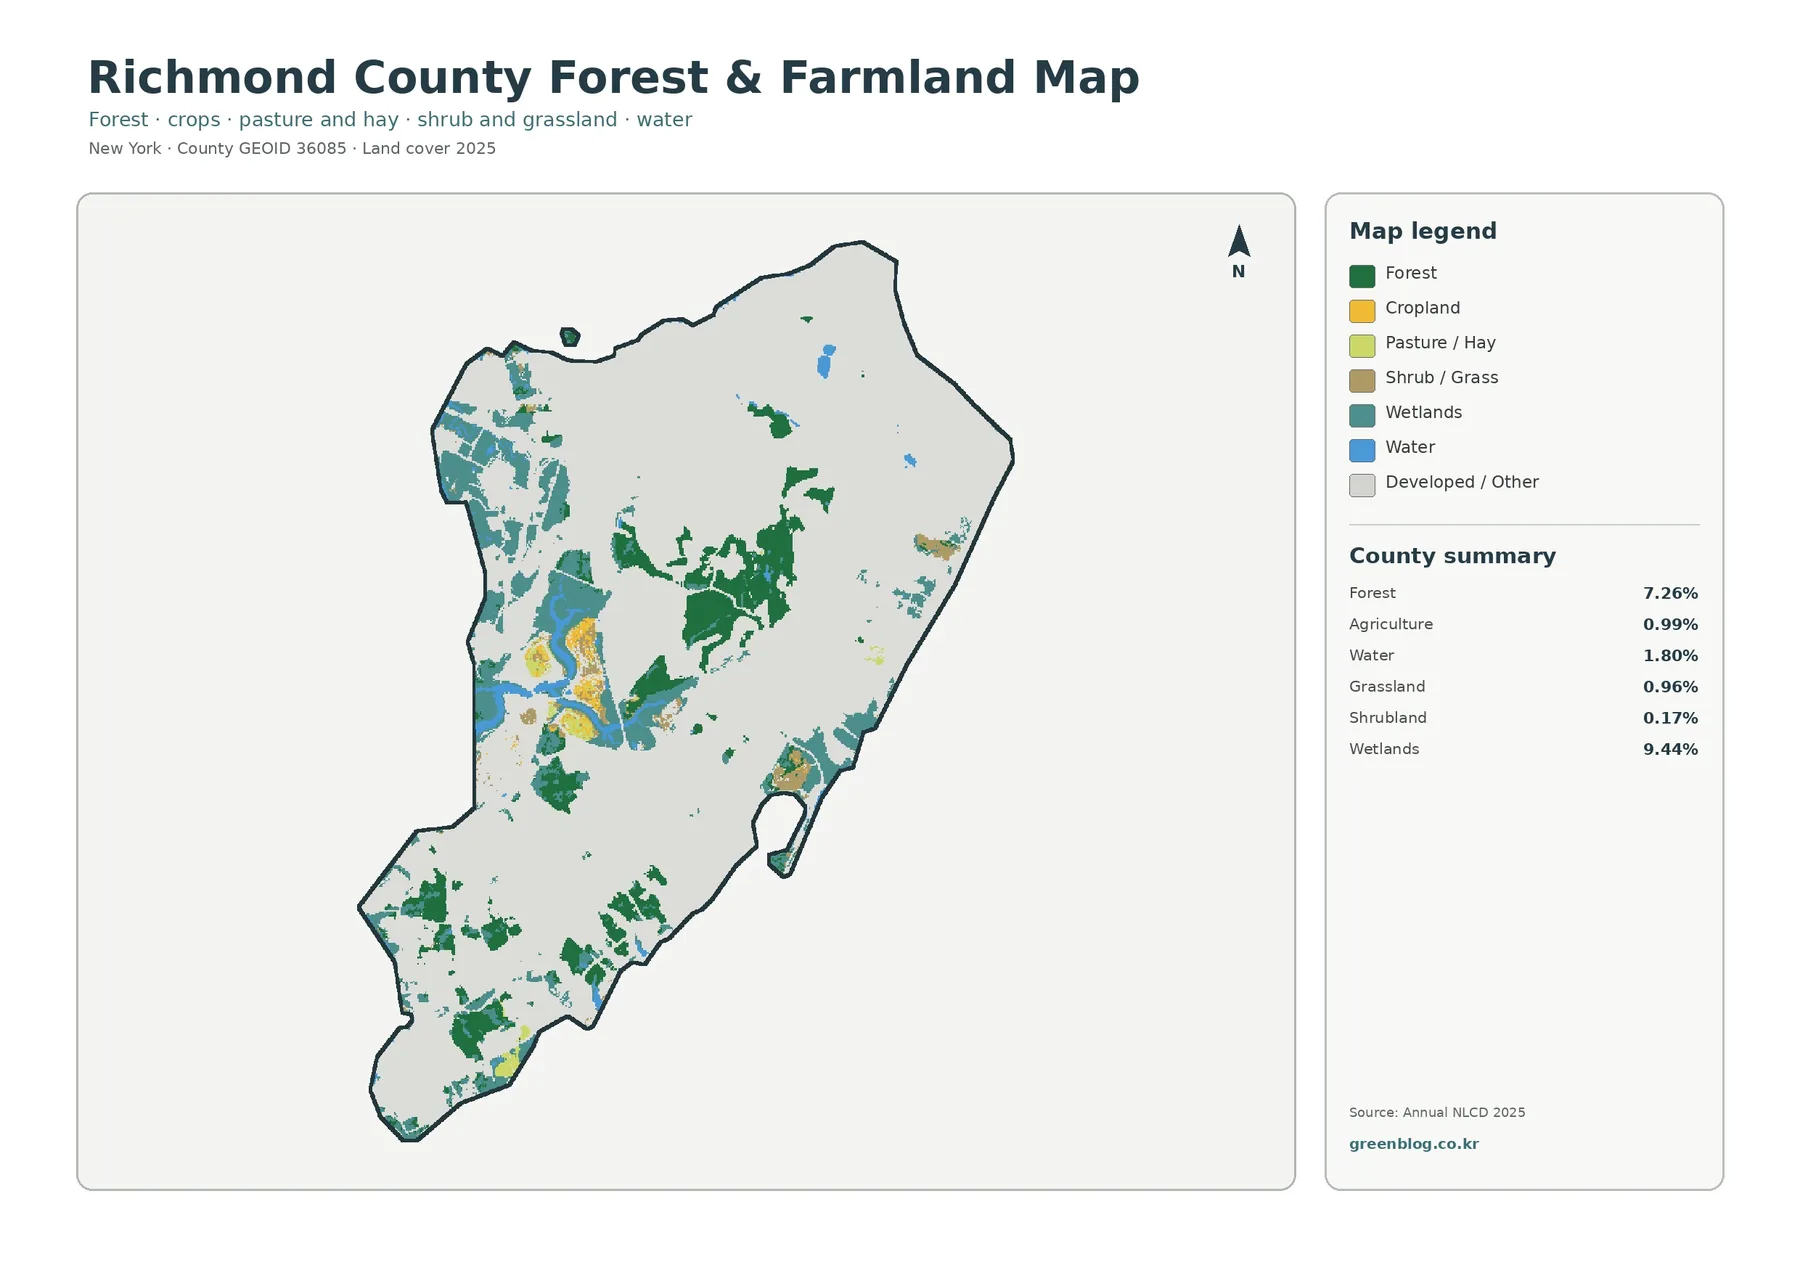
Removing most of the developed detail from view makes the central forest cluster much easier to follow. Several green patches touch or nearly touch through the middle of the island, forming the largest wooded concentration in the county. Smaller patches appear in the south and southwest, with a few isolated pieces elsewhere. The result is not a continuous forested island; instead, it is a developed county with a pronounced central wooded area and a scattering of secondary forest patches.
Wetlands are visually important on this map because their 9.44% share exceeds the forest percentage. Broad teal areas occupy parts of the west and west-central side, often beside water or open-cover colors. These transitions are useful for habitat or watershed discussions because they show where different surface types meet over short distances. Because the 30 m raster cannot preserve every narrow marsh edge, channel, or strip of vegetation, the visible boundaries should be read as generalized land-cover zones.
Agricultural cover is only 0.99% of the county, yet small yellow areas are visible in the west-central part of the map and in a few scattered locations. That classification should not be read as a count of operating farms or as an agricultural zoning layer. Annual NLCD assigns classes from remotely sensed surface conditions, so a cell can resemble crop or pasture cover without answering questions about ownership or legal use. Anyone investigating a specific site should pair this map with local land-use records rather than treating the land-cover label as a parcel description.
The forest-and-farmland view is therefore most useful when the goal is to remove the visual dominance of developed land and concentrate on the remaining natural or open surfaces. It works well for environmental education, habitat comparison, park-context graphics, and a first look at how forests and wetlands are distributed across Staten Island. The general map should remain nearby, because it restores the urban context around those natural patches and prevents the viewer from mistaking an isolated forest cell for a large uninterrupted reserve.
What the 1985–2025 comparison really measures
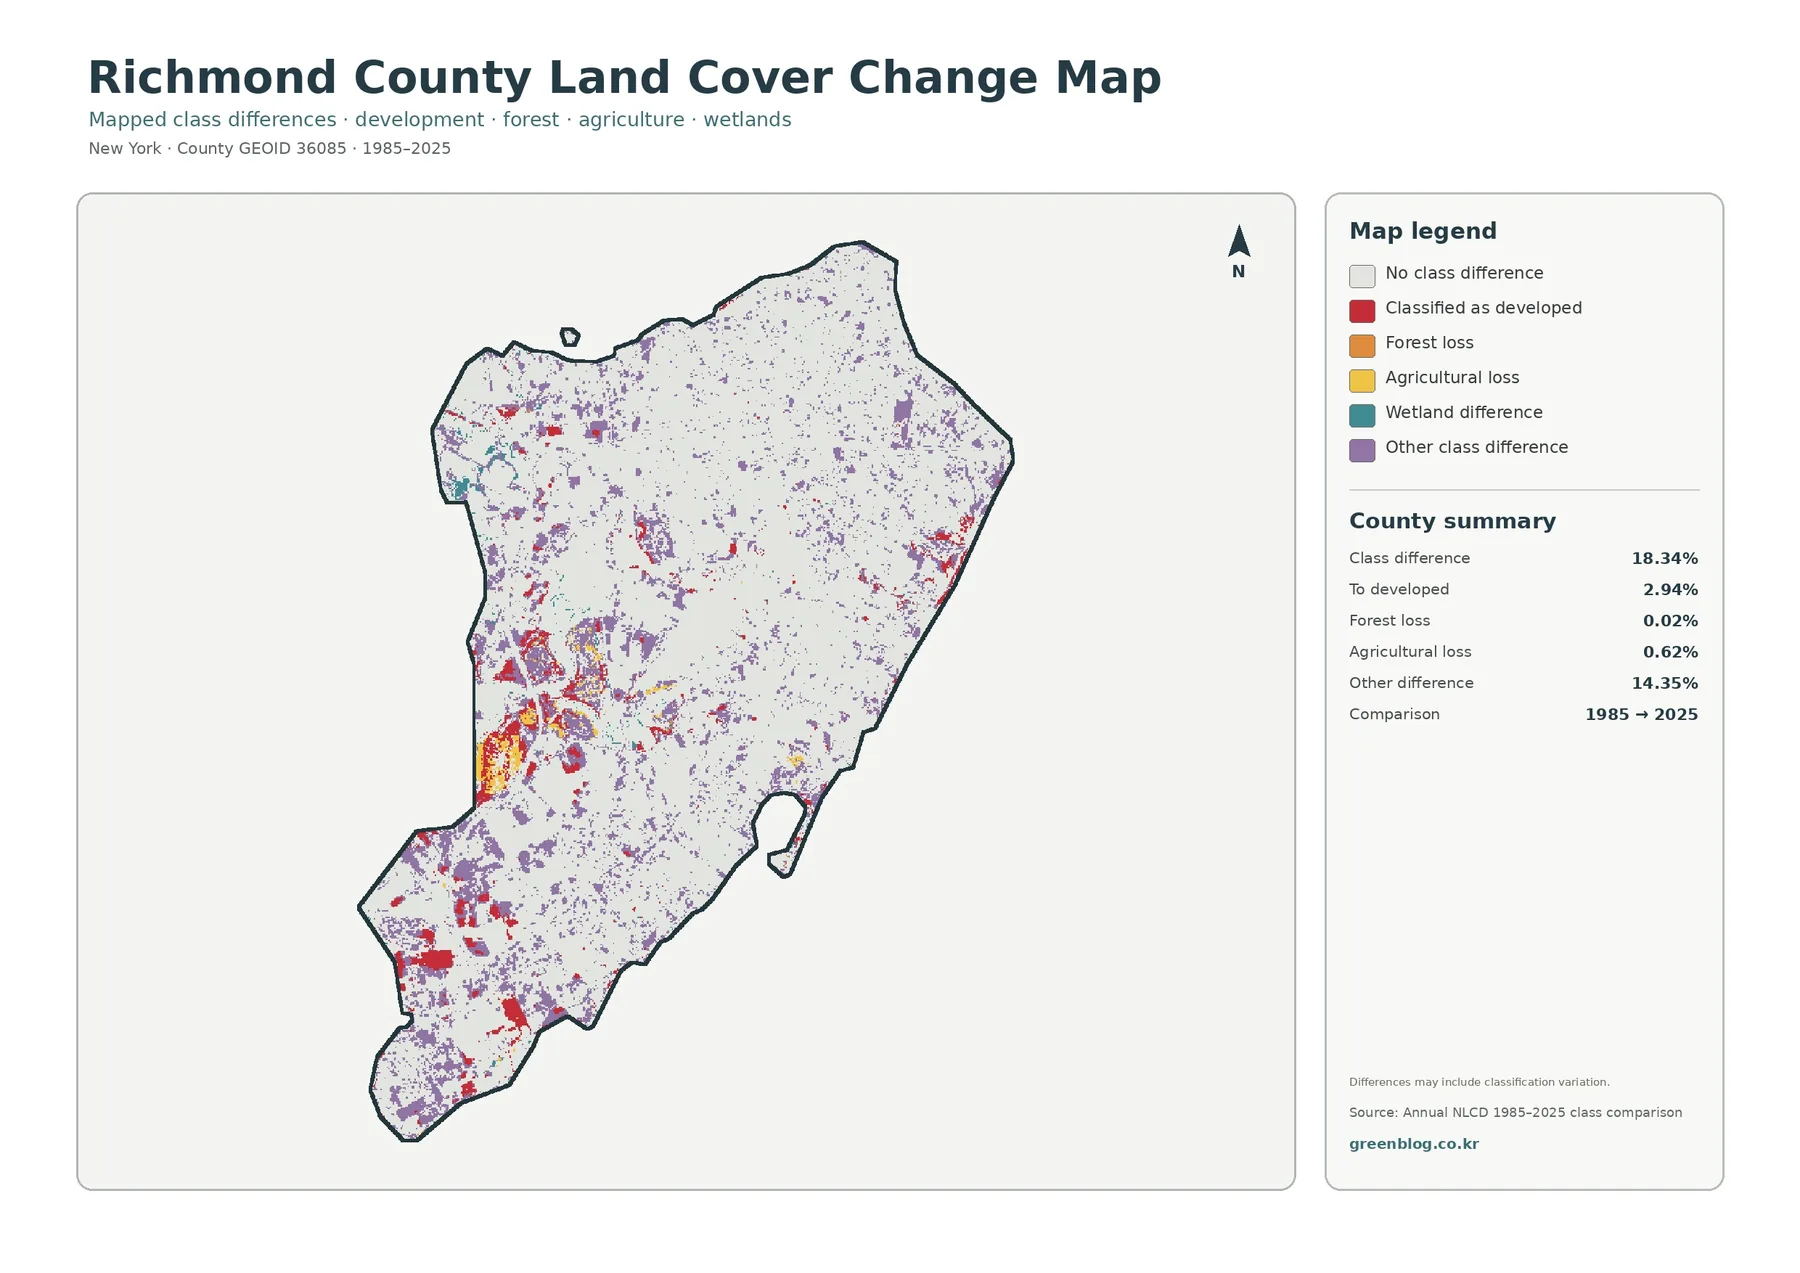
The class-difference map compares the category assigned to each cell in 1985 with the category assigned in 2025. Across Richmond County, 18.34% of cells are marked as different between the two dates. The supplied summary breaks that total into 2.94% classified as change to developed, 0.02% forest loss, 0.62% agricultural loss, and 14.35% other class difference. Because “other difference” is by far the largest component, the 18.34% total should not be described as the amount of new development.
Change colors are especially noticeable in parts of the west-central and southwestern county, while smaller cells are scattered across the north, east, and interior. Red cells classified as change to developed appear in multiple clusters rather than as one simple front moving across Staten Island. Other-difference colors are much more widespread, and wetland-related differences appear in some of the complex western areas. The image is good at directing attention to places that deserve a closer look, but it does not identify the cause of each difference.
Some differences can reflect real changes on the ground, while others may be influenced by imagery conditions, classification methods, or mixed pixels near boundaries. A 30 m cell along a marsh edge, narrow wooded strip, or developed parcel may contain several surface types, and a small shift in the dominant signal can change its assigned class. For that reason, a colored change cell should not be treated as proof of a specific construction project, wetland loss, or forest clearing without additional evidence.
For historical research, use the map as a screening layer. Locate clusters of class difference, compare them with the current land-cover map, and then check dated aerial imagery or local planning and park records if the reason for change matters. That sequence keeps the visual comparison useful without asking it to answer questions that require site-specific documentation. It also makes the 1985–2025 image easier to explain in a presentation because the audience can see the difference between “mapped classification changed” and “a verified land-use event occurred.”
Choosing the right map for a task
Each map works best when it is tied to a specific question. When the goal is a broad description of Richmond County, the general land-cover map provides the clearest balance between developed land, forest, wetlands, water, and small open-cover classes. For Greenbelt or western natural-area questions, the forest-and-farmland map removes much of the urban visual clutter. If a project needs to compare paved or roofed surfaces, the impervious map adds detail that the developed class alone cannot provide.
In most comparisons, the class-difference map works best near the end because the reader already understands the current landscape. By first locating today’s central forest, western wetlands, and developed neighborhoods, it becomes easier to interpret where the two-date differences occur. This order is particularly effective in classroom lessons and slide presentations. It gives each image a clear job instead of forcing one map to carry every explanation.
Environmental and planning-context work can also benefit from pairing two maps rather than using all four at once. General land cover plus impervious surface is a useful combination for discussing urban intensity. Pairing general land cover with the forest-and-farmland view works better for natural-area context. Current cover plus the 1985–2025 comparison is appropriate when the topic is mapped change over time. These pairings make the visual message easier to read and reduce the chance of confusing land cover with zoning, regulation, or legal boundaries.
For printed material, the original JPG files can be placed next to explanatory text, cropped only when the legend and context remain understandable, or presented as a sequence from current cover to specialized views. Each supplied image already contains a title, legend, and county summary, which helps when it is viewed outside this webpage. If precise site decisions are involved, keep the JPG as an overview and provide the appropriate official GIS or parcel source separately.
Download the Richmond County JPG map set
The ZIP contains four original JPG files: the 2025 general land-cover map, the forest-and-farmland map, the impervious-surface/developed-land map, and the 1985–2025 class-difference map. Each file can be opened independently and includes its own legend and county summary. The set is useful for printing, classroom handouts, presentations, local environmental reference, and side-by-side comparisons where a web preview is less convenient.
Select the file that matches the question you need to answer. Use the general map for a one-page county overview, the forest-and-farmland view for natural cover, the impervious image for the intensity of hard surfaces, and the class-difference image for the two-date comparison. Keeping those purposes separate produces clearer captions and more accurate explanations, especially when the maps are reused in a report or presentation.
Scale, classification, and boundary limits
Annual NLCD is raster data, meaning the landscape is divided into grid cells and each cell receives a representative class or value. With the 30 m cells used for this material, one cell can contain part of a street, several trees, lawn, a building, and a wetland edge at the same time. Raster classification generalizes that mixture so the entire county can be compared consistently. It is therefore well suited to broad county patterns, but not to parcel-scale measurements or exact legal boundaries.
Mixed pixels are most important where surface types meet. A narrow stream may not appear as an unbroken water line, a slim strip of trees can be absorbed into a surrounding developed class, and a marsh boundary may shift from cell to cell. The opposite situation is also possible: a large green space can contain roads, buildings, or parking areas that become visible on the impervious map. Reading the four maps together helps reveal those differences, but it does not remove the underlying resolution limit.
Time is another limitation. The current land-cover and impervious maps use the supplied 2025 dataset, so later construction, restoration, vegetation growth, shoreline work, or other changes may not appear. The historical image compares 1985 with 2025 rather than documenting every year in between. When a project requires the latest site condition, check newer imagery and current NYC or New York State records for the specific subject.
Legal interpretation requires a different source altogether. A wetland-class cell is not automatically a regulated wetland boundary, forest cover does not define park ownership, and developed land does not determine zoning or development rights. Use these maps as readable visual references for Richmond County’s surface patterns. For permits, ownership, parcels, official park limits, or regulatory boundaries, rely on the responsible agency’s current authoritative data.
Frequently Asked Questions
What is the dominant land cover in Richmond County?
Developed land is the dominant 2025 class at 78.13%. Wetlands account for 9.44% and forest for 7.26%, with smaller shares of water, barren land, agriculture, grassland, and shrubland. The natural cover is concentrated enough to form large visible breaks within the developed pattern.
Why is developed cover 78.13% while mean impervious surface is 43.55%?
Developed land is a broad land-cover category. A developed cell may still include lawns, trees, soil, and other permeable surfaces. Impervious surface measures the share covered by pavement, rooftops, and similar hard materials, so its percentage is expected to be lower than the total developed-cover share.
Does the 18.34% class difference equal land development from 1985 to 2025?
No. The 18.34% figure is the share of cells whose mapped class differs between the two dates. Only 2.94% is specifically labeled as change to developed, while 14.35% falls under other class difference. Classification variation can also contribute to the result.
Can these maps show exact park, wetland, or property boundaries?
No. They can show the broad location of forest, wetland, water, and developed cover, but they are not legal boundary maps. Use current NYC or New York State GIS data when you need official park limits, regulated wetland boundaries, parcels, ownership, or zoning.
Map File Information
Download the Richmond County 2025 land-cover, forest/farmland, impervious/developed surface, and 1985–2025 class-difference maps as four original JPG files in one ZIP.
- Included Files: Land cover, forest/farmland, impervious/developed surface, and land-cover change maps
- File Type: One ZIP containing four original JPG files
- Intended Use: Printing, education, presentations, local comparison, and map-based projects
Related Maps
- Albany County Land Cover Map
- Allegany County New York Land Cover Map
- Bronx County New York Land Cover Map
Sources and references
- MRLC Annual NLCD Data – official access point for the land-cover and impervious-surface datasets used for this map series
- USGS Annual NLCD Land Cover Classification – USGS background and definitions for the Annual NLCD land-cover classes
- NYC Parks Natural Areas – official descriptions of the Staten Island Greenbelt, Saw Mill Creek Marsh, and other forest, wetland, grassland, and stream areas
- NYC Planning Special Natural Area District-1 – official context for Staten Island’s central hills, trees, ponds, creeks, and wetlands
Green Map creates custom-edited map images using open geographic data sources such as geoBoundaries, Natural Earth, OpenStreetMap, and government open data.
These maps are edited visual materials, not raw data files, and are provided for education, documents, presentations, and graphic reference.