Forest is the clearest feature in Otsego County’s 2025 land-cover picture. It accounts for 54.61% of the mapped county, while agriculture covers 27.81%, developed land 8.06%, wetlands 7.70%, and water 1.39%. The map is not simply a solid forest block, however. Farm fields break through wooded areas in many parts of the county, development becomes more concentrated near the larger southern settlement area and near the south end of Otsego Lake, and wetlands appear in scattered pockets among forest and open land.
Four map views are included here: current land cover, forest and farmland, impervious surface and developed land, and mapped class differences from 1985 to 2025. The four original JPG maps are also available in one download for printing, classroom work, presentations, and county-scale comparisons. These maps describe what covers the ground; they do not show parcel ownership, zoning, building rights, or the legal boundaries of agricultural or regulated wetland districts.
Table of Contents
A county where forest and farmland share the same landscape
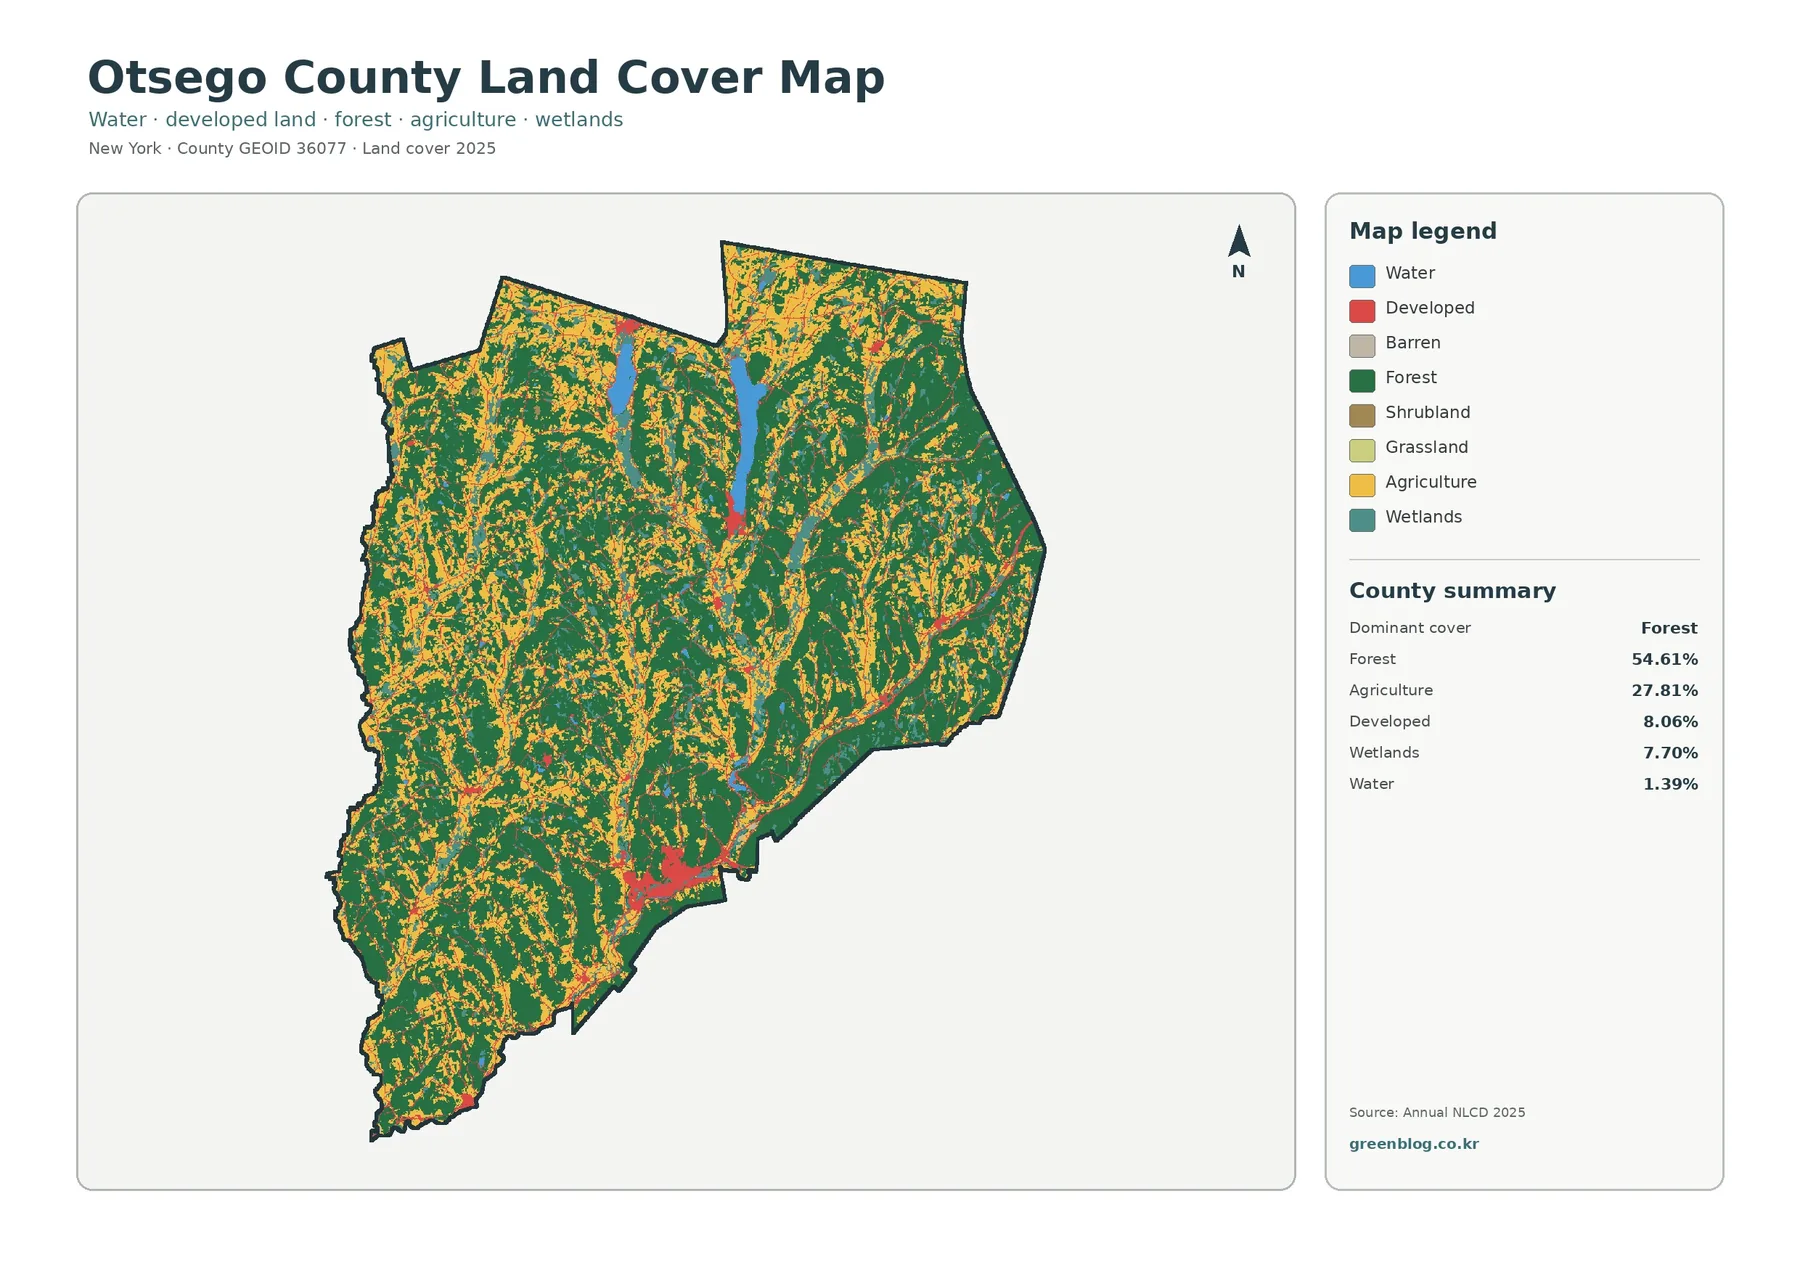
The countywide map is dominated by dark green, but the yellow agricultural cells are extensive enough to shape the view almost everywhere. Large wooded areas remain visible in the east, center, west, and north, while farmland appears as repeated patches and bands between them. The pattern is mixed rather than sharply divided. A reader moving across the map encounters wooded blocks, agricultural openings, smaller wetland areas, and occasional developed clusters instead of a single clean boundary between “forest country” and “farm country.”
The summary numbers help put that visual pattern in perspective. Forest and agriculture together make up more than four-fifths of the mapped area. Developed cover, at 8.06%, is much smaller in total area, yet its red cells stand out because they are concentrated rather than evenly spread. Wetlands at 7.70% form another meaningful part of the county, especially where teal patches occur among woods and around low-lying or water-adjacent areas. Open water is only 1.39% by area, but the long lake in the north-central portion is visually prominent.
That elongated water body corresponds to Otsego Lake, an easy geographic reference for reading the rest of the county. Near its southern end, a narrow developed concentration is visible in the Cooperstown area. Farther south, a larger and denser red cluster aligns with the Oneonta area near the county’s lower edge. Smaller developed spots appear elsewhere. Because the map itself is not a street or municipal-boundary map, those place references should be used as orientation points rather than exact limits of a city or village.
Wetland cells deserve separate attention because they do not mean the same thing as legally regulated wetland boundaries. The 7.70% figure comes from a land-cover classification. It identifies places whose surface characteristics were classified as wetland in the mapped product, not parcels that have passed a legal jurisdictional determination. For permit work or property-specific decisions, the relevant state or federal wetland records and field information are still necessary.
Following the forest–farmland pattern without turning it into a parcel map
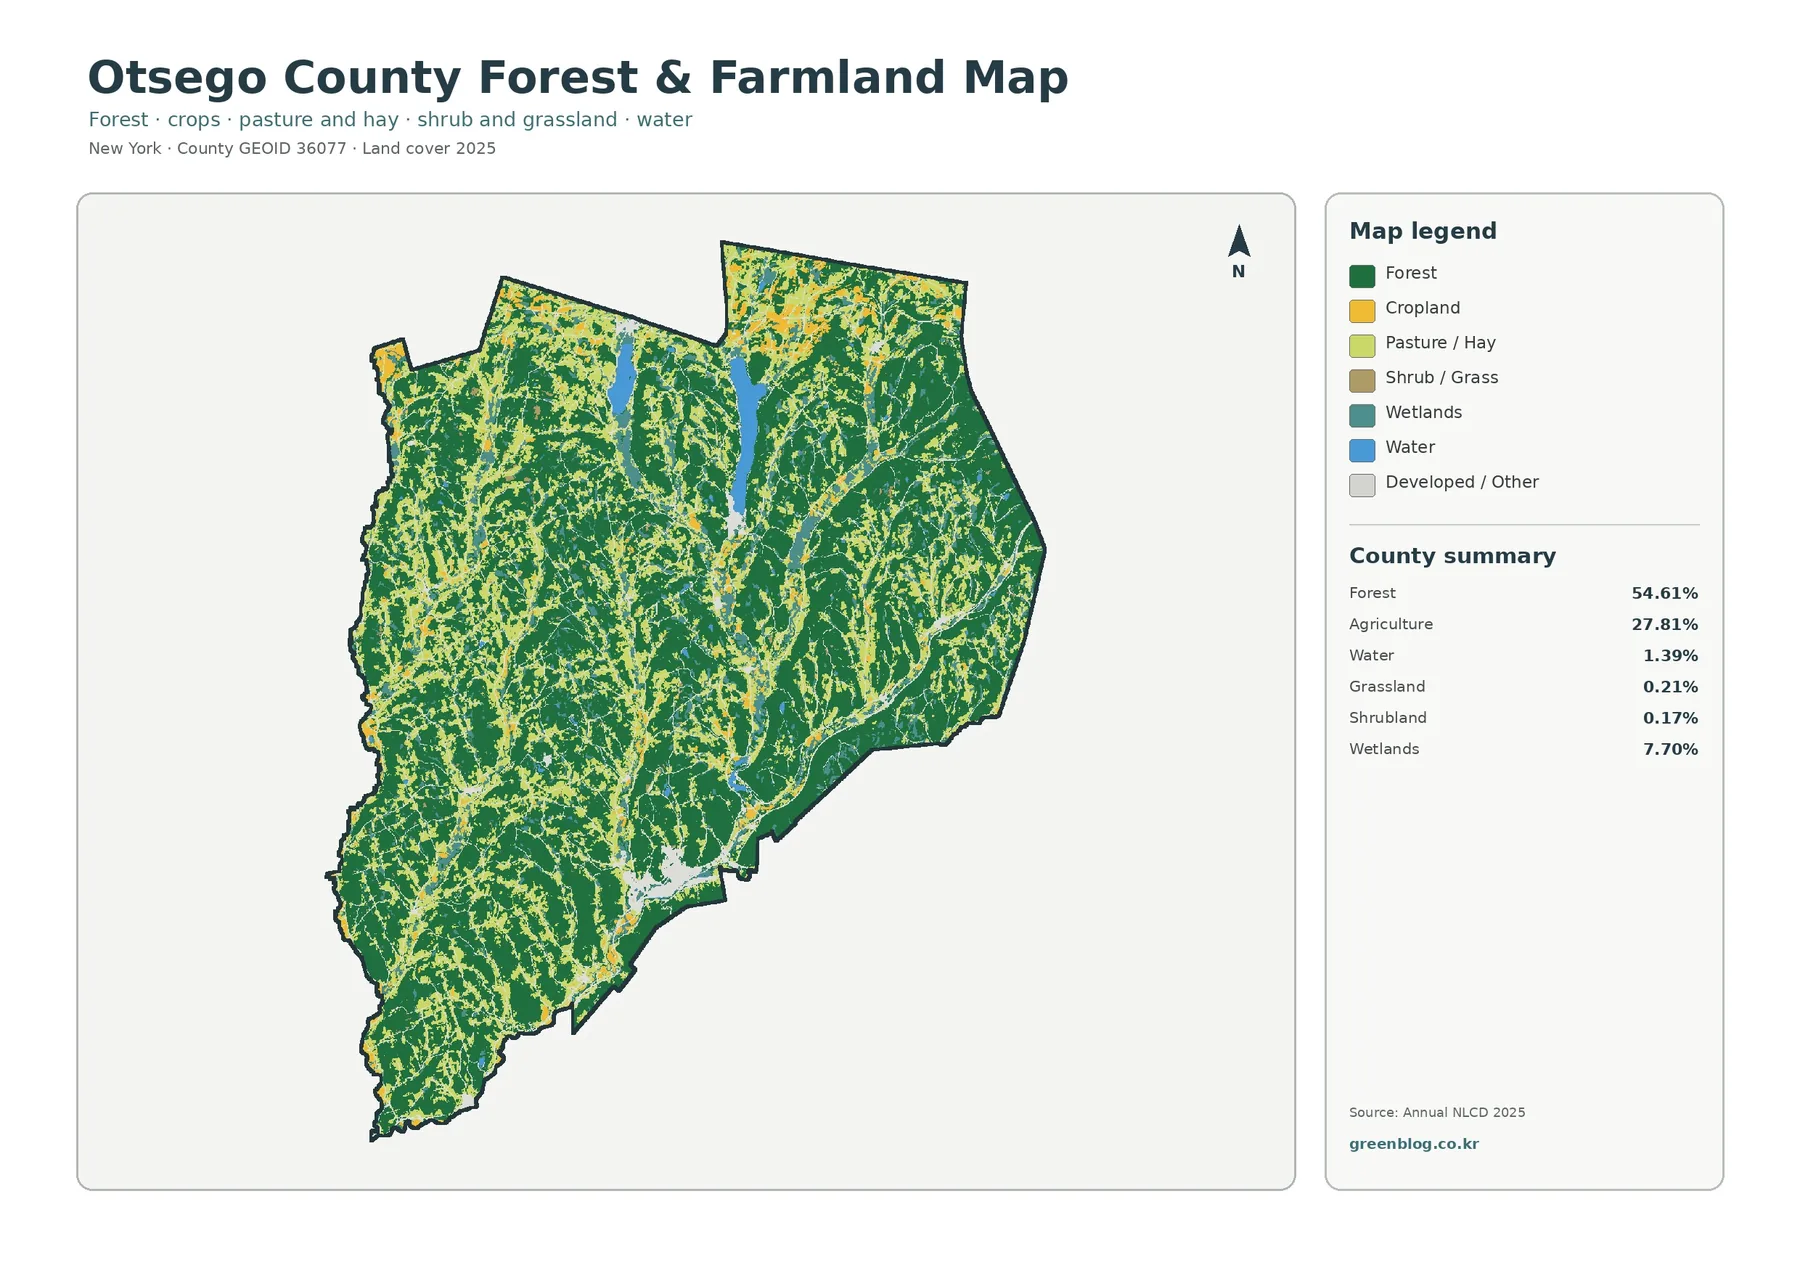
The forest-and-farmland view removes much of the visual competition from developed and miscellaneous classes. Forest remains the largest cover at 54.61%, and agriculture at 27.81% becomes easier to follow through the openings between wooded areas. Agriculture is not confined to one corner. It occurs in many separate blocks, with particularly noticeable concentrations across western, central, and southern parts of the county, while additional agricultural patches continue into the north and east.
Grassland and shrubland are minor parts of the county summary, at 0.21% and 0.17% respectively. Those small totals are useful context: the main story of the open landscape is agriculture, not a countywide expanse of grass or shrub. At the same time, the map does not tell us what crop is being grown, whether land is pasture or hay at a particular parcel, or whether a field is enrolled in any preservation program. Its purpose is broader classification at a county scale.
This distinction matters in Otsego County because the county government separately administers an Agricultural District program. The county Planning Department explains that an agricultural district is an administrative program centered on viable agricultural land and specifically notes that it is not a zoning district. A yellow agricultural cell on this map therefore should not be treated as proof that a parcel is inside the official Agricultural District. The county’s district maps and parcel viewer are the appropriate sources for that question.
Forest cover needs the same careful treatment. Green cells indicate a surface classified as forest in the 2025 land-cover product. They do not identify ownership, management status, tree species, timber value, or whether harvesting is allowed. For a presentation about the county’s landscape, the map can show where large wooded areas are located relative to farms and settlements. A forestry or property-management decision requires additional records and field-scale information.
Otsego Lake, smaller waters, and the wetland pattern
Although open water represents only 1.39% of the county summary, Otsego Lake gives the map a strong visual anchor. Forest extends around much of the surrounding area, agricultural cells appear nearby, and development is more noticeable at the lake’s southern end than along most of its shoreline. This makes the lake useful for explaining how several land-cover classes can meet within a relatively compact part of the county without implying that one class caused another.
Smaller streams and ponds are harder to read at this scale. Raster land-cover products divide the landscape into cells, so very narrow features may be simplified, interrupted, or absorbed into a neighboring class. A small creek can be ecologically important even when it does not appear as a continuous blue line. Anyone studying drainage networks, stream names, or channel geometry should pair this map with a dedicated hydrography source rather than relying on the land-cover layer alone.
Wetlands cover 7.70%, substantially more than open water. Teal cells occur as scattered pockets and wider patches among forest and agricultural areas. Their distribution can help a student or planner identify places where a closer wetland or watershed review may be useful. It cannot provide wetland type, legal status, seasonal water depth, or flood frequency. Those questions require more specific environmental datasets and, for site work, current field information.
Why developed cover is 8.06% but mean imperviousness is only 1.31%
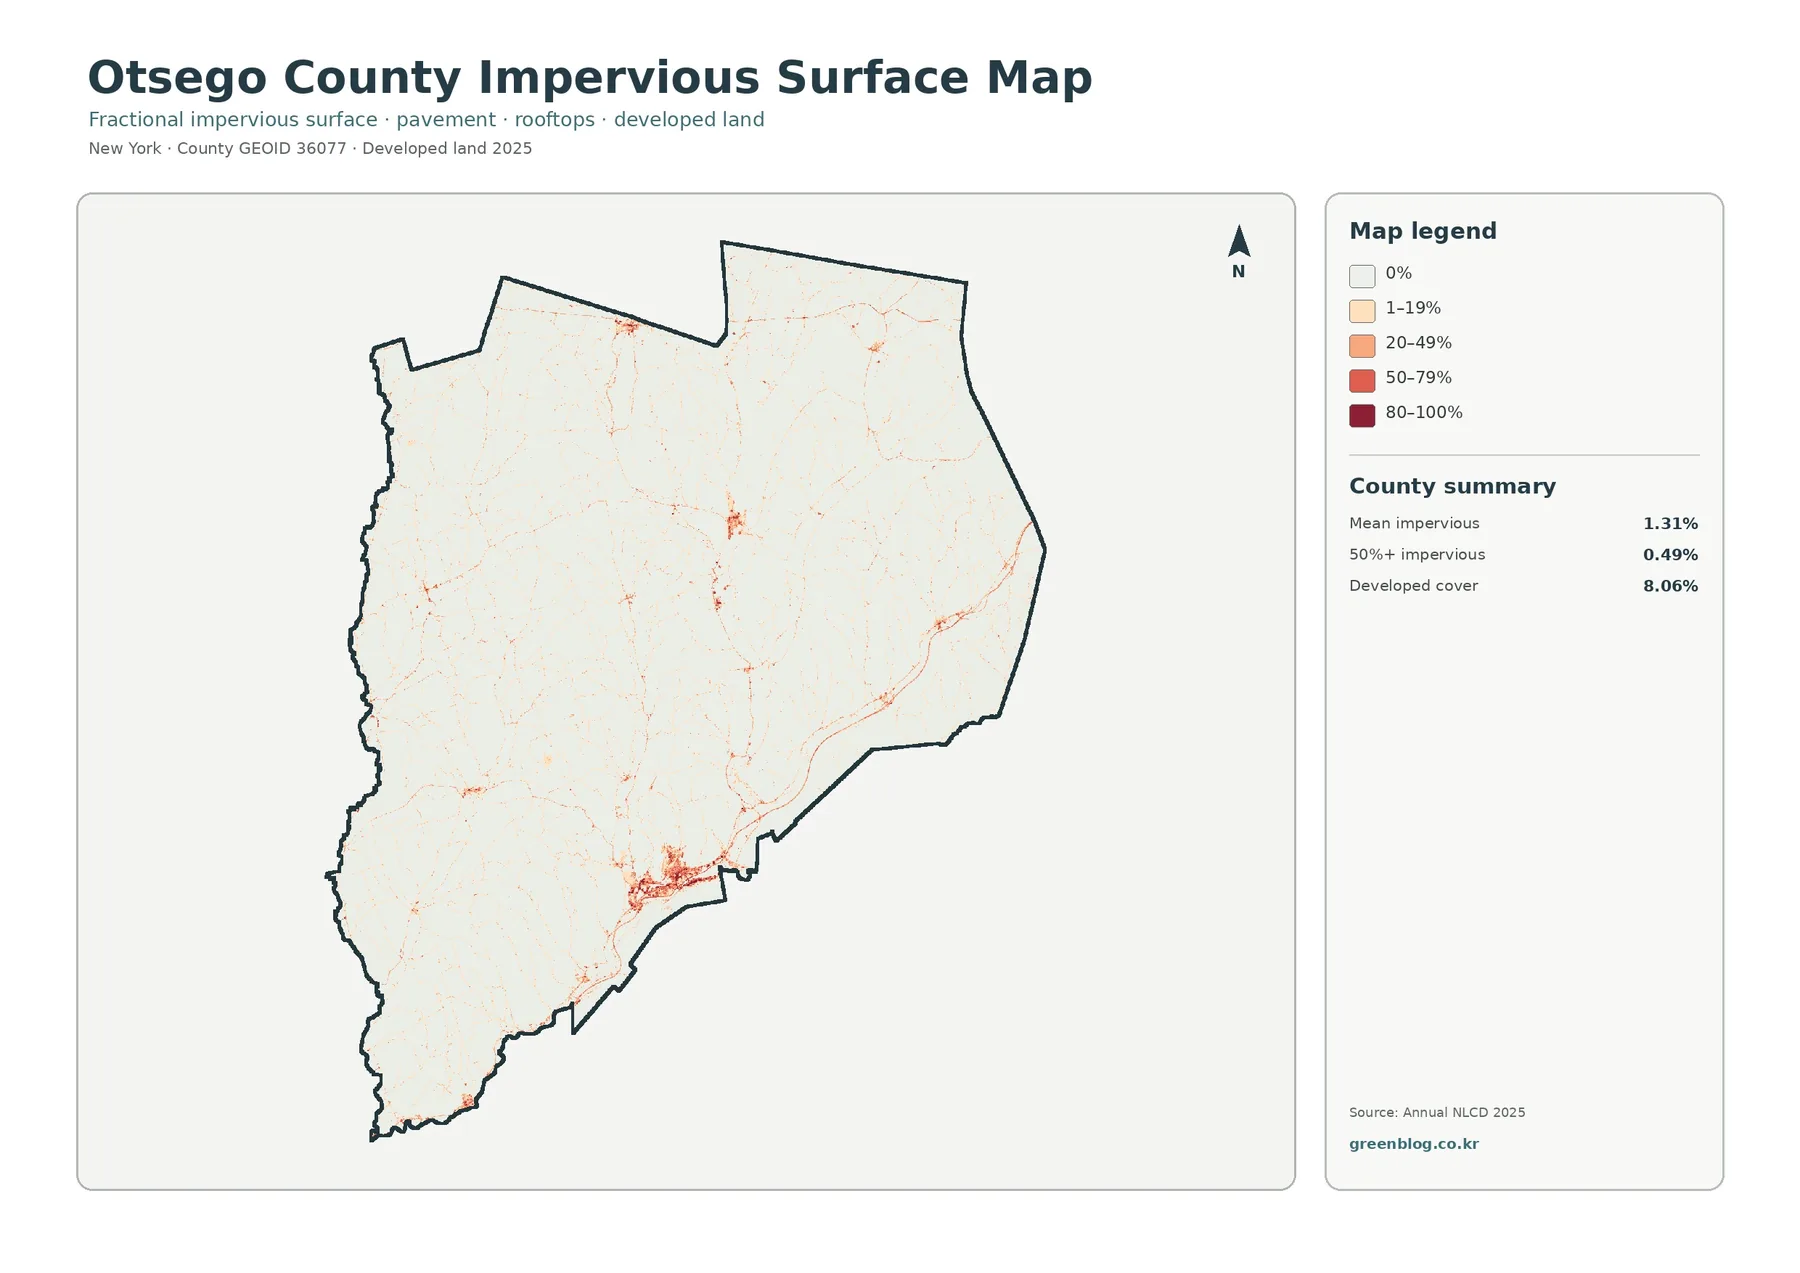
Impervious surface means a hard surface such as pavement or a rooftop where water does not readily soak into the ground. The countywide mean shown on the map is 1.31%, and areas with at least 50% impervious surface account for 0.49%. Those values are much lower than the 8.06% developed-cover figure because developed land can contain lawns, trees, gardens, bare soil, and other surfaces that still allow infiltration.
The strongest impervious concentration appears in the large southern developed cluster. Smaller bright and dark spots mark other settlement centers, while thin lines trace parts of the road and built-surface network. Near the south end of Otsego Lake, another localized concentration is visible. Most of the county remains very light, reinforcing the contrast between compact built-up locations and the much broader forest-and-farm landscape.
This map is useful when the question is not simply “where is developed land?” but “where are hard surfaces most concentrated?” A low-density residential area may count as developed cover while retaining large lawns and tree cover, so its impervious percentage can remain modest. A small commercial block or dense street area can occupy less land yet display a much higher hard-surface percentage. Placing the general land-cover map beside this one makes that difference easy to explain.
Imperviousness should not be treated as a stand-alone flood or water-quality rating. Runoff also depends on rainfall, soil, slope, drainage infrastructure, vegetation, and nearby water levels. For county-scale screening, this view can identify places where hard surfaces are clustered, but engineering design, stormwater review, or hazard assessment requires more detailed hydrologic and site information.
Reading the 1985–2025 class-difference map cautiously
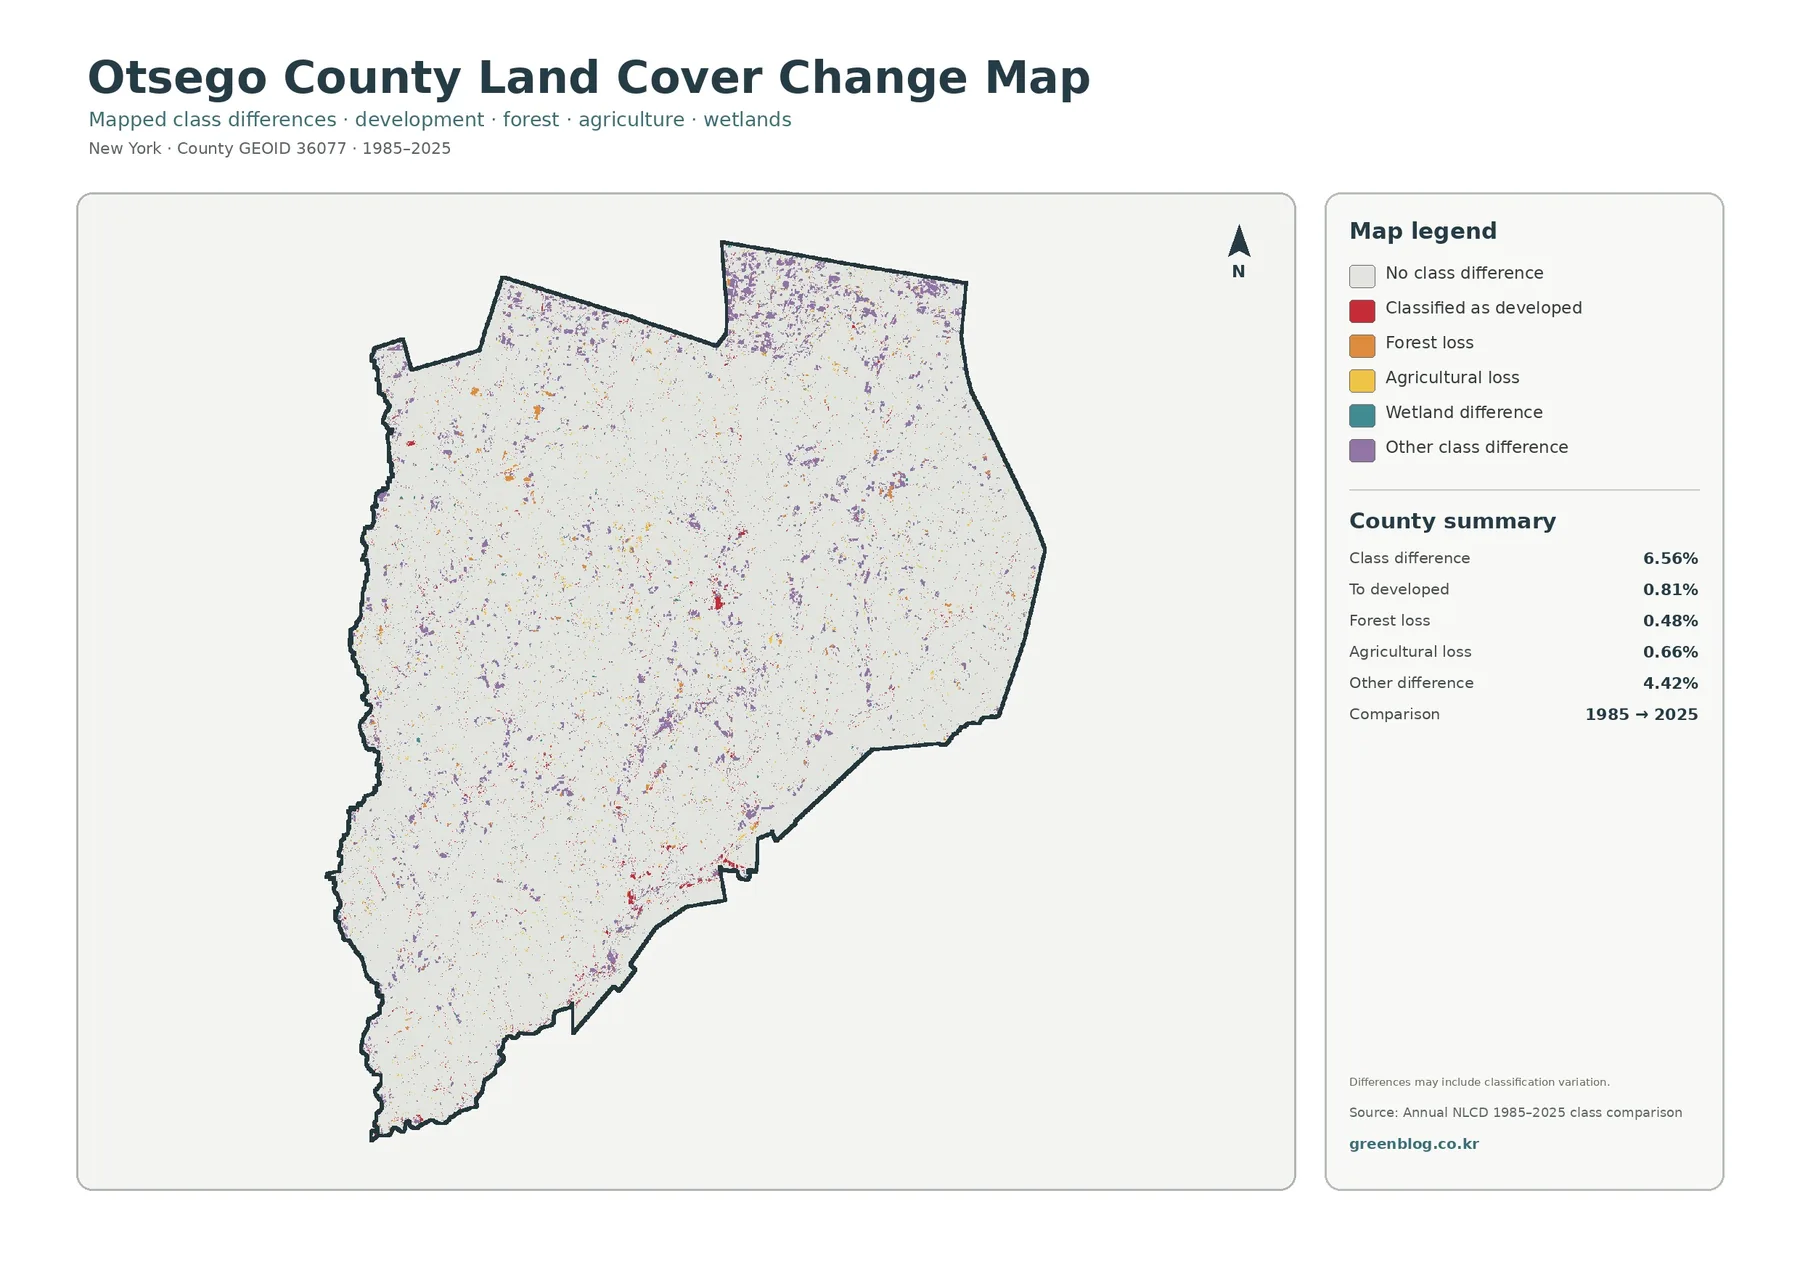
The long-term comparison reports a class difference across 6.56% of the county between 1985 and 2025. Within the summarized categories, 0.81% is shown as classified to developed, 0.48% as forest loss, 0.66% as agricultural loss, and 4.42% as other class difference. Most of the map remains in the light “no class difference” category, while colored change cells appear as scattered points, small patches, and short corridors.
Some of the more visible red change cells occur around developed locations, including the larger southern cluster, but they do not form one continuous band across the county. Forest-loss and agricultural-loss colors are also dispersed. The largest summarized category is “other difference,” so it would be misleading to describe the 6.56% total as if it were mainly urban growth, deforestation, or farm conversion. A safer use is to locate areas that deserve a closer before-and-after check.
The note printed on the map is important: mapped differences may include classification variation. Annual NLCD uses Landsat observations and modeling to produce a long annual record, and USGS states that the 2026 update extended the collection through 2025. Where forest edges, farm fields, roads, yards, or wetlands share a cell, the most likely class can differ between years even when the physical change is subtle. Method improvements through a long time series can also affect the comparison.
For that reason, 6.56% should not be presented as a direct “land-use change rate.” It is a comparison of mapped classes at two points in time. A property-level claim about development, clearing, farming, or wetland alteration should be checked with historic aerial imagery, current imagery, parcel records, and any relevant local planning documents. The change map is most valuable as a screening and teaching tool, not as final proof of what happened on a specific parcel.
Choosing a map for a report, class, or county reference
For a quick county overview, start with the 2025 general land-cover map. It communicates the dominance of forest and the large agricultural share while still showing development, wetlands, and water. When a project is specifically about rural landscape or the relationship between wooded and agricultural areas, the forest-and-farmland view is cleaner because it reduces emphasis on unrelated classes and makes the green-and-yellow distribution easier to compare.
Use the impervious map when the issue is built-surface intensity. Its 1.31% mean and the 0.49% share above 50% imperviousness give a different perspective from the 8.06% developed-cover number. For a lesson on long-term change, place the 1985–2025 comparison after the current maps. Readers can first understand the present landscape and then check where class differences appear, which reduces the temptation to interpret every change color without context.
Agriculture-related presentations need one extra note. Otsego County’s official Agriculture page separates the Agricultural District program from zoning and provides district maps and parcel-viewer guidance. If a report discusses farm policy, protected agricultural land, or a particular parcel, use those official district records alongside this land-cover map. The yellow cells in the land-cover product describe surface classification, not participation in the county program.
Keep the map title and legend visible when printing or cropping. Colors do not carry the same meaning across all four products. Dark green on the current map is forest, while the change map uses separate colors for loss or class differences. Red developed cover is also different from the red category showing cells classified to developed in the comparison. Removing the legend can turn a clear graphic into an ambiguous one.
The download ZIP contains all four original JPG files: the 2025 land-cover map, forest-and-farmland map, impervious-surface/developed-land map, and 1985–2025 class-difference map. Using the original files is preferable to a browser screenshot when a larger image is needed for a handout, slide, report, or side-by-side comparison. The same map set can be used as four separate figures or arranged together as a sequence from current cover to specialized views and change.
Scale, raster cells, and other limits that matter
Annual land-cover products are raster datasets. In plain terms, the landscape is divided into a grid and each cell receives a representative value. USGS describes the NLCD record as Landsat-based and notes the 30-meter spatial resolution of legacy NLCD products, with Annual NLCD continuing a comparable national land-cover record. That scale is well suited to broad county patterns, but it should not be confused with a parcel survey or a detailed engineering base map.
Mixed cells are especially important in a county where woods, fields, roads, wetlands, and small settlements meet frequently. A single cell can contain more than one real surface, yet the categorical land-cover layer must assign one most likely class. Edges may therefore look stepped, narrow features may disappear, and small patches can be generalized into a surrounding class. Reading groups of cells as a landscape pattern is usually more appropriate than treating every cell edge as an exact ground boundary.
The observation year is another limit. A 2025 land-cover map represents the dataset’s 2025 classification, so construction, clearing, restoration, agricultural shifts, or water changes after that observation period may not be reflected. The same caution applies to historical comparisons: a map between 1985 and 2025 summarizes differences between two mapped classifications and does not describe every intermediate event or its cause.
Legal and administrative boundaries are outside the purpose of these maps. Agricultural cover is not an Agricultural District map, forest cover does not establish ownership or management rights, wetland cover does not define regulatory jurisdiction, and developed cover does not show residential, commercial, or industrial zoning. Property decisions should be based on the responsible agency’s current parcel, zoning, environmental, and permitting records.
Used with those limits in mind, the four maps complement one another well. The general map answers what covers the county now. The forest-and-farmland map makes the rural pattern easier to compare. Impervious surface adds information about hard-surface concentration, and the historical comparison points to places where classifications differ through time. The best map depends on the question, and difficult questions often benefit from two or more of the views together.
Frequently Asked Questions
What is the largest land-cover class in Otsego County in 2025?
Forest is the largest class at 54.61%. Agriculture follows at 27.81%, with developed land at 8.06%, wetlands at 7.70%, and water at 1.39%. Across the county, forest is widespread, but farmland also occupies substantial areas rather than being limited to a single small district.
Why is developed cover 8.06% when mean impervious surface is only 1.31%?
Developed cover can include lawns, trees, gardens, and other permeable surfaces around buildings and roads. Impervious surface measures the hard portion, such as pavement and rooftops. The county map reports a 1.31% mean impervious value and shows 0.49% of the area at 50% imperviousness or higher, so the two measures answer different questions.
Does the 6.56% class difference mean 6.56% of the county was physically converted?
No. It means the mapped class differs between the 1985 and 2025 comparison for 6.56% of the area. Real landscape change can be part of that result, but classification variation, mixed cells, and methodological differences can contribute as well. Parcel-level conclusions need supporting imagery, records, or field evidence.
Is agricultural land cover the same as the Otsego County Agricultural District?
No. The land-cover map classifies the surface, while the county Agricultural District is a separate administrative program. Otsego County’s Planning Department explicitly states that agricultural districts are not zoning districts. Use the county’s district maps or parcel viewer when the official district status of a property matters.
Which four original maps come in the ZIP download?
The ZIP contains the four original JPG maps used for this page: 2025 land cover, forest and farmland, impervious surface and developed land, and the 1985–2025 class-difference map. They can be used separately or together for printing, reference, classroom activities, presentation graphics, and county-scale comparison.
Map File Information
Otsego County Land Cover Maps Download the four original JPG maps: 2025 land cover, forest and farmland, impervious surface and developed land, and the 1985–2025 class-difference map.
- Included Files: Use only the versions confirmed in the article and supplied images
- File Type: Use the confirmed download contents
- Intended Use: Printing, education, presentations, and map-based projects
Related Maps
- Albany County Land Cover Map
- Allegany County New York Land Cover Map
- Bronx County New York Land Cover Map
Sources and References
- MRLC Annual NLCD Data – access to Annual NLCD land-cover and related products
- USGS About Annual NLCD – Annual NLCD methods, long-term record, and the update adding 2025 data
- U.S. Census Bureau TIGER/Line Shapefiles – county-boundary and geographic reference data
- Otsego County Planning Department – official county planning, Mapping & GIS, agriculture, and natural-resource information
- Otsego County Agriculture – official Agricultural District, farmland-protection, map, and parcel-viewer information
- Cornell Cooperative Extension Schoharie and Otsego Counties – research-based local agriculture and natural-resource education
Green Map creates custom-edited map images using open geographic data sources such as geoBoundaries, Natural Earth, OpenStreetMap, and government open data.
These maps are edited visual materials, not raw data files, and are provided for education, documents, presentations, and graphic reference.