Nassau County is one of the most heavily developed parts of Long Island, yet its southern edge opens into bays, tidal marshes, and barrier-island water. The four maps below separate current land cover, forests and farms, impervious surfaces, and mapped class differences between 1985 and 2025.
Each WebP provides a quick preview, and the four original JPG maps are available together in one ZIP. Download the set for classroom comparisons, regional reference, presentation graphics, or reports that need readable legends and a consistent county boundary.
Table of Contents
Start with the contrast between the interior and coast
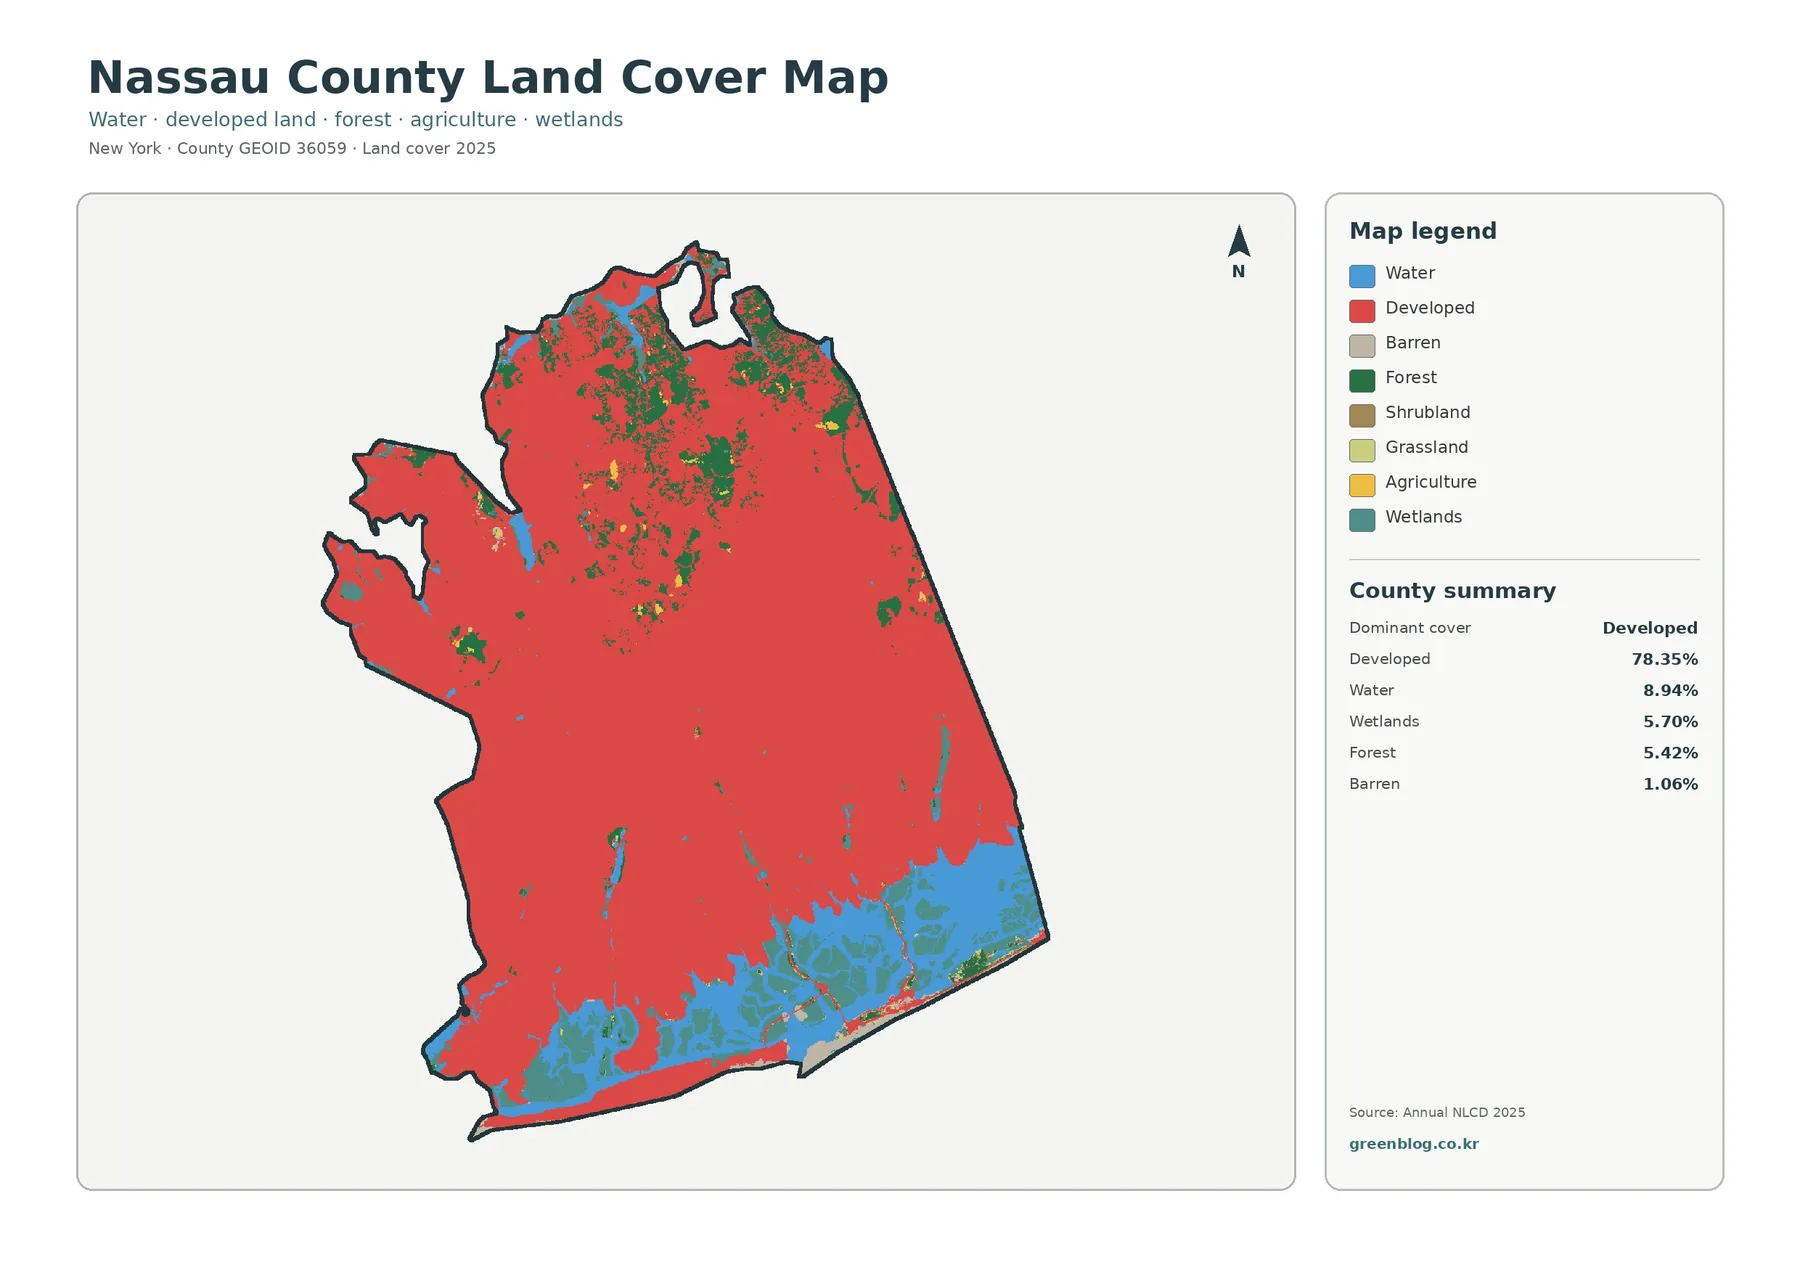
The 2025 summary assigns 78.35 percent of Nassau County to developed cover. Water accounts for 8.94 percent, wetlands for 5.70 percent, forest for 5.42 percent, and barren land for 1.06 percent. Agriculture, grassland, and shrubland appear in the legend but occupy only small shares. Those figures immediately distinguish Nassau from an upstate farming or forest county, although the map still contains important natural areas.
Development covers nearly the entire central body of the county. The pattern begins at the Queens boundary in the west and continues through communities around Hempstead, Mineola, and the east. Red remains widespread on the North Shore, but irregular bays and wooded fragments break it into a more varied outline. The South Shore changes most sharply: broad blue and teal areas replace the inland red where open water, tidal channels, and wetlands meet the barrier-island setting.
Land cover describes what a satellite-based classification recognizes on the ground. It does not identify ownership, zoning, public access, building rights, or a parcel’s approved use. A low-density neighborhood with houses, lawns, and trees can still belong to a developed class. The map should therefore be read as a countywide environmental summary rather than a legal land-use plan.
Small forests matter in a county dominated by development
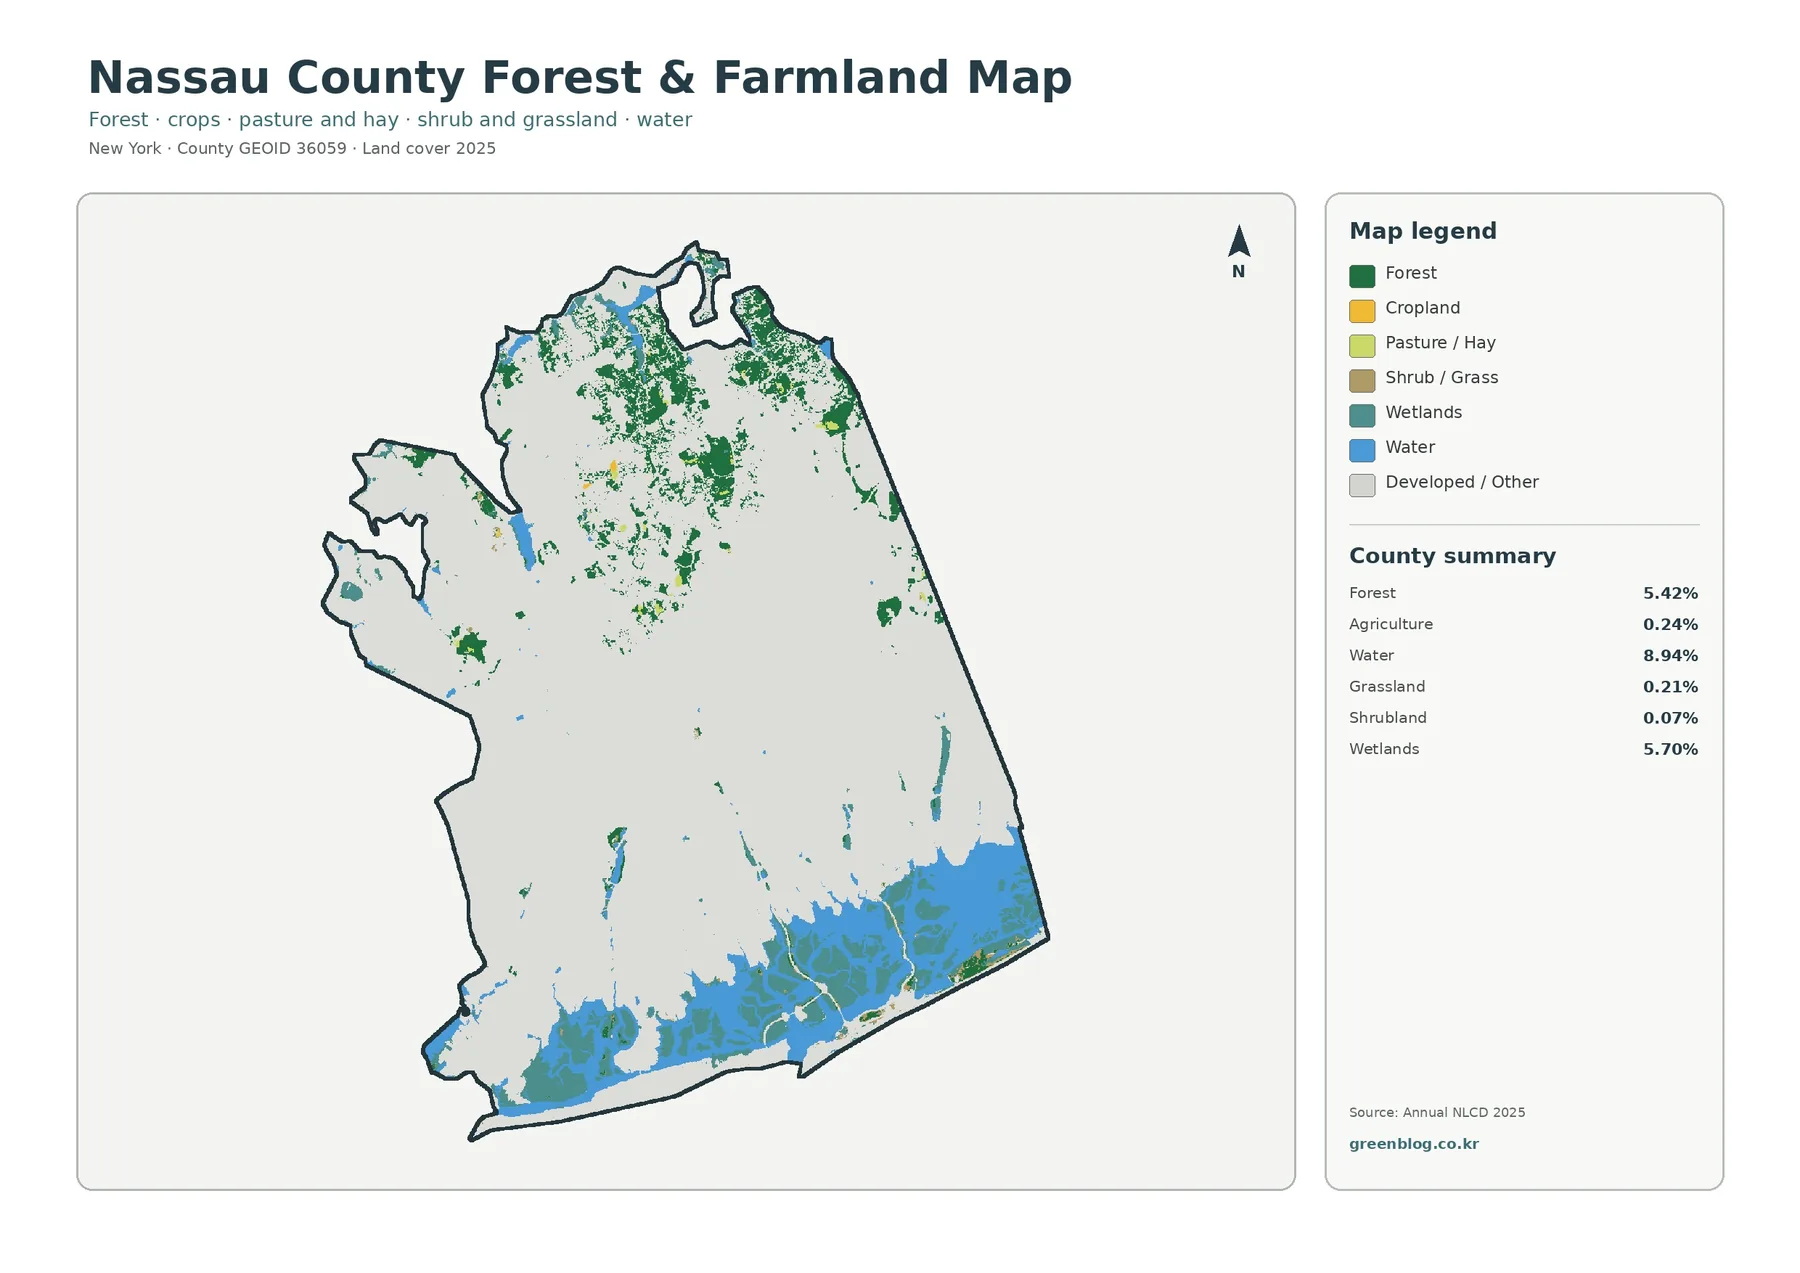
The forest-and-farmland view turns developed and other cover gray. That design makes scarce green and open areas easier to find than they are in the general map. The largest concentration of woodland lies in the northern and northeastern portion of the county. Smaller green patches occur through the north-central area and appear occasionally within the developed interior.
Forest represents 5.42 percent of the mapped area. Its shape is fragmented rather than continuous: gray development separates many green patches, and even larger northern areas contain breaks. This pattern can support an initial study of where tree cover or habitat remains within a suburban county. It cannot identify tree species, canopy height, habitat condition, park ownership, or whether the public may enter a particular green area.
Agriculture is only 0.24 percent, grassland 0.21 percent, and shrubland 0.07 percent. At county scale, their colors appear as tiny spots that may disappear when the image is reduced. The useful question is not where a broad farm belt lies, because none exists here. Instead, the map shows how rare agricultural or open-cover cells have become inside a landscape dominated by homes, businesses, roads, and institutional grounds.
The southern coastal system takes over the lower part of this focused map. Blue water lies beside teal wetland in bays, channels, and marsh islands. Their boundaries are irregular and closely interwoven. New York State maintains a separate official tidal-wetlands inventory for regulatory purposes. Use that inventory for jurisdiction or permit questions; the land-cover layer is better suited to a broad visual comparison.
Impervious cover adds detail to the suburban landscape
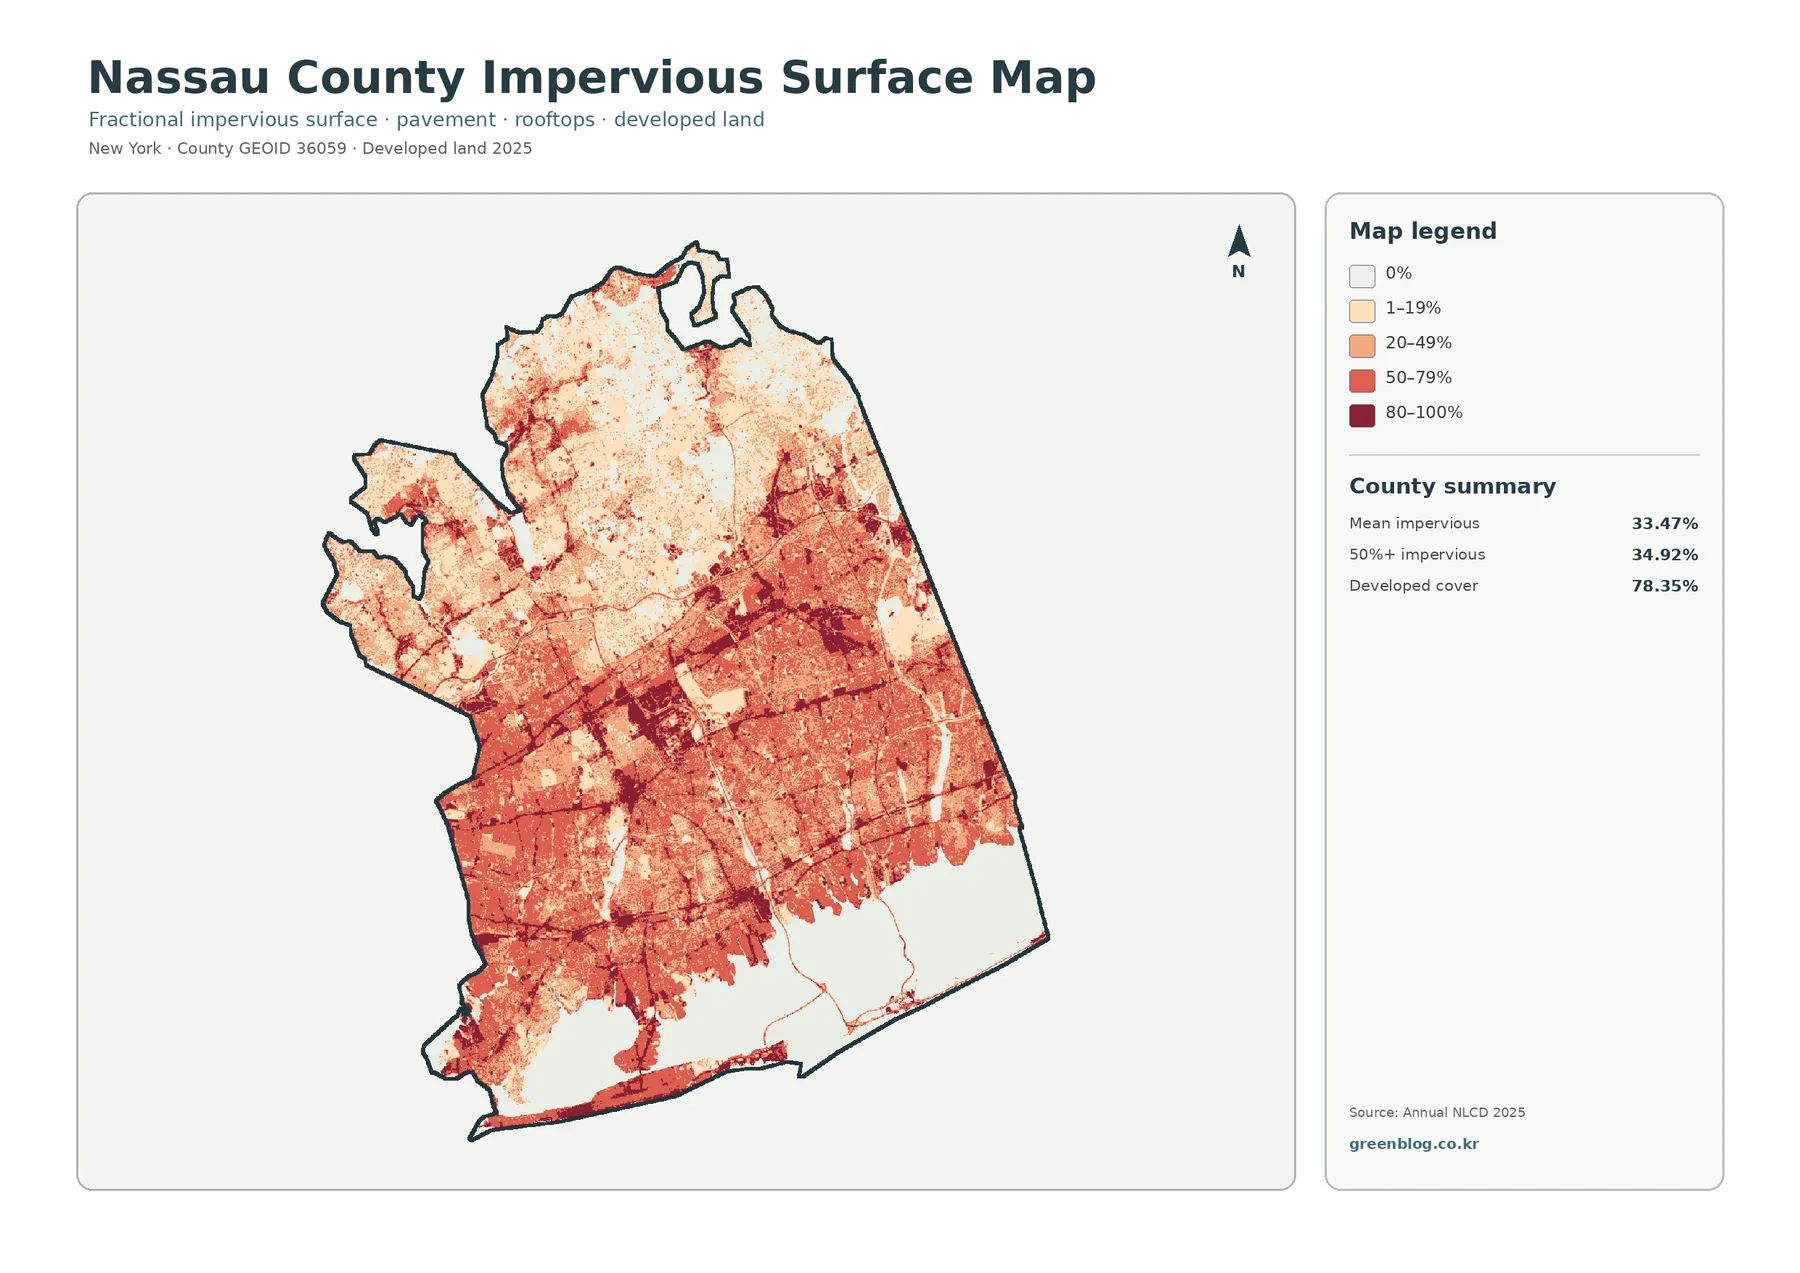
Impervious surfaces include roofs, paved streets, parking lots, and other hard materials that do not readily absorb rainfall. The map estimates their share within each grid cell and groups the result into zero, 1–19, 20–49, 50–79, and 80–100 percent. Darker red does not merely mean “developed.” It identifies cells where hard surfaces occupy a larger fraction of the ground.
Nassau’s mean impervious value is 33.47 percent. Cells at or above 50 percent impervious cover account for 34.92 percent of the mapped county. Deep reds form broad clusters across the western and south-central interior, with strong linear traces along major transportation and commercial routes. Residential areas farther east and north often appear lighter because lawns and trees reduce the hard-surface share even though the general map still classifies them as developed.
The difference between 78.35 percent developed land and 33.47 percent mean imperviousness is informative. Developed land is a categorical description that may include substantial vegetation around buildings. Imperviousness measures only the hard part of the same setting. A suburban block can therefore be developed throughout while its roofs and pavement cover much less than the entire block.
White and pale areas correspond to larger parks, wooded estates, golf courses, wetlands, and open water, depending on location. Along the southern bays, the near-zero coastal pattern forms a sharp boundary with the built interior. The impervious map is helpful for introducing runoff or urban heat, but it cannot determine flood danger by itself. Drainage infrastructure, elevation, soil, rainfall, groundwater, and tidal conditions all affect actual risk.
The change map records differences, not a single trend
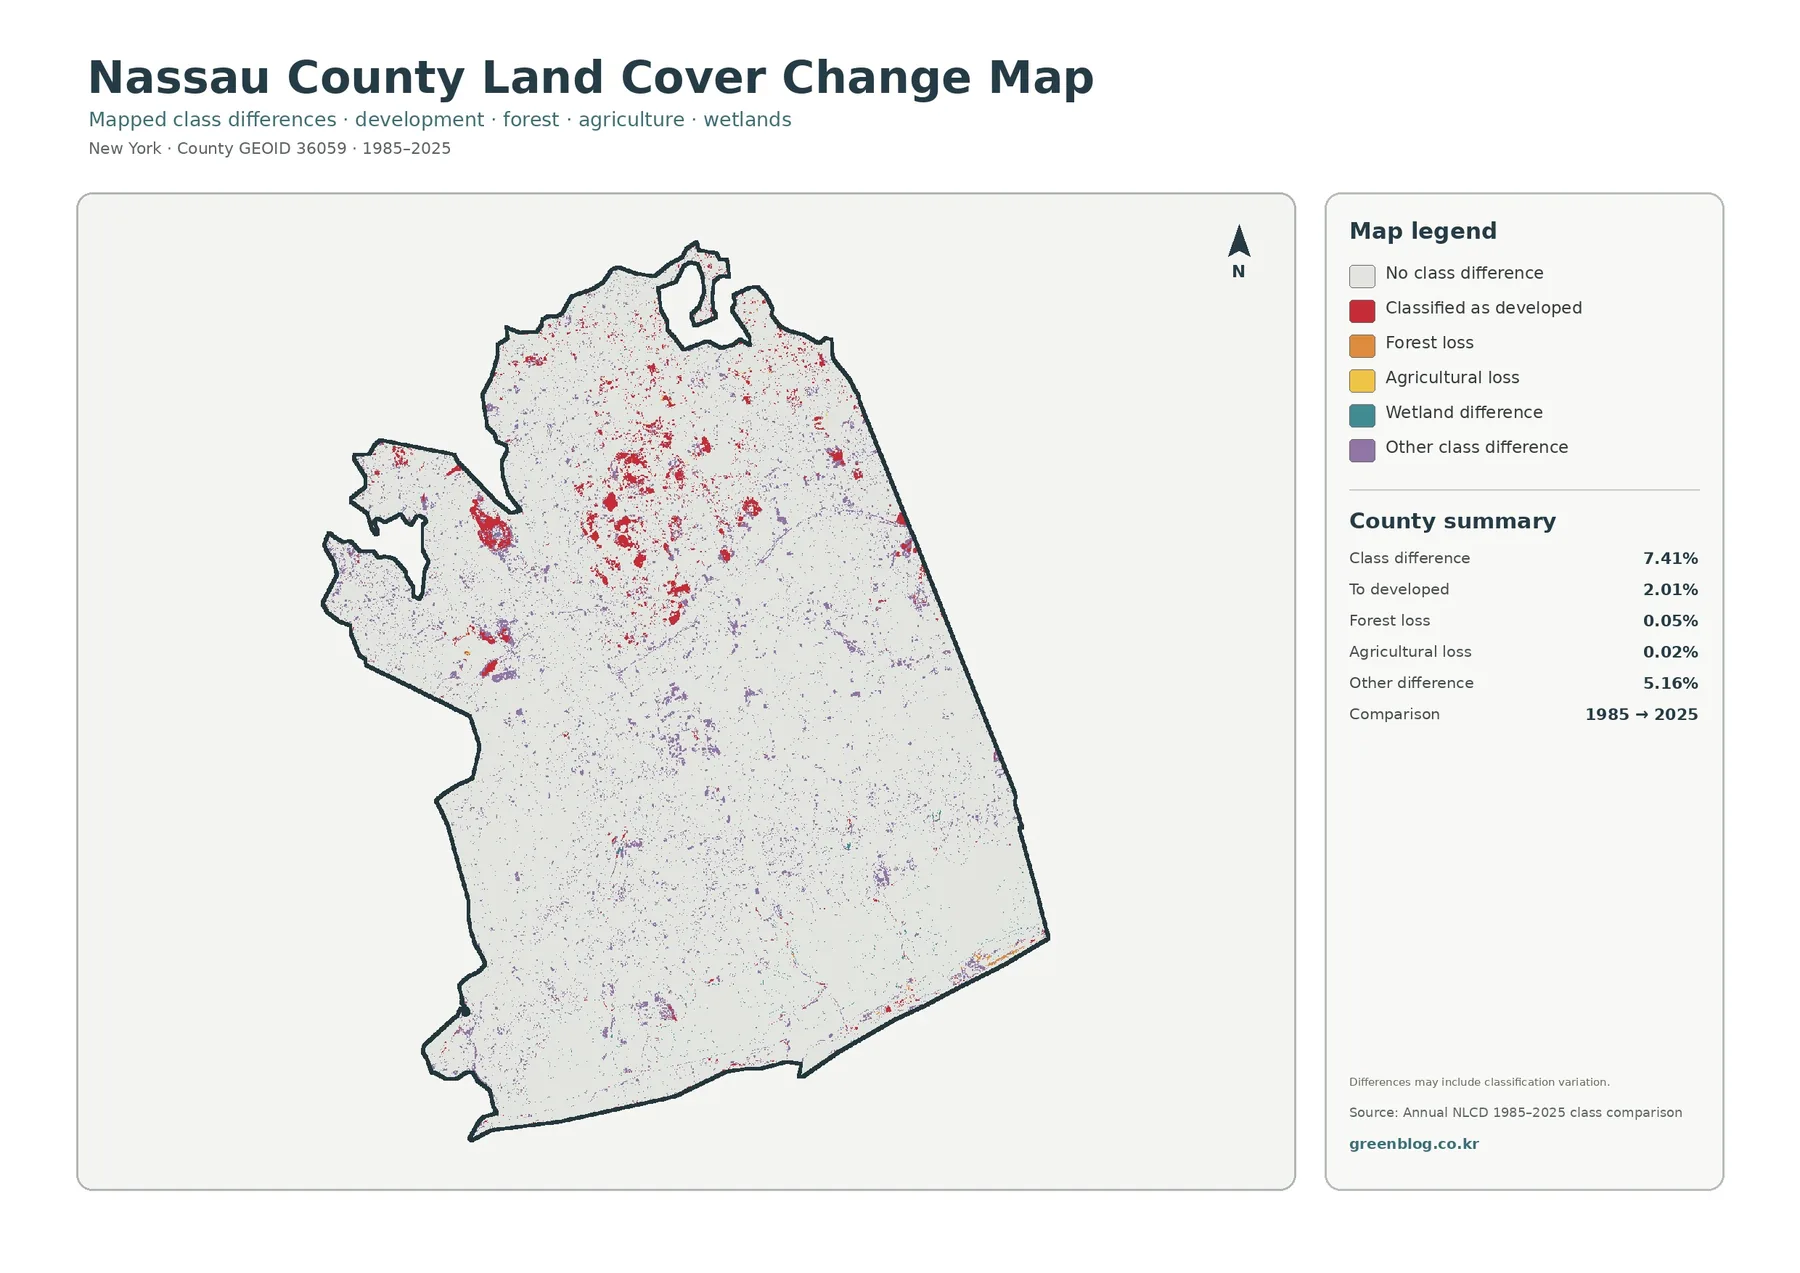
The 1985–2025 comparison leaves matching classes white and colors cells that differ. Red indicates land classified as developed by 2025, orange marks forest loss, yellow marks agricultural-cover loss, teal marks a wetland difference, and purple collects other class differences. The summary reports a total class difference of 7.41 percent. That is far smaller than the current developed share, which suggests that much of the county remained within the same broad class across the comparison.
Areas classified to developed make up 2.01 percent. Several noticeable red clusters sit in the north and northwest, while smaller marks are scattered across the rest of the county. Forest loss is listed at 0.05 percent and agricultural loss at 0.02 percent. The largest component is the 5.16 percent “other difference” category. Calling all 7.41 percent new construction would therefore be incorrect.
Some colored cells represent real surface change, but a four-decade comparison can also capture changes in sensors, imagery, and classification methods. Coastal edges are especially sensitive because water levels and vegetation conditions vary. Small parks, forest edges, and mixed residential cells may also switch categories without a dramatic ground-level transformation. Historical aerial photography and annual source data are necessary before attributing a specific cause.
Three anchor areas make the set easier to read
Use the South Shore as the first anchor. Its blue water and teal wetland shapes are distinctive in the general and forest-focused maps, then become white or nearly white in the impervious view. In the comparison map, small coastal colors should be interpreted carefully because tidal position and classification variation can affect the edge between land and water.
The heavily built western interior provides a second anchor. It appears solidly developed in the first image and contains many dark impervious cells in the third. Comparing those two views separates a broad developed category from the places with the greatest concentration of roofs and pavement. The change layer then reveals whether selected locations also carry red 1985–2025 difference cells.
Northern woodland fragments form the third reference. They are somewhat hidden among the general map’s developed colors but become clearer when gray replaces development in the forest-and-farmland image. The same locations tend to be lighter in the impervious view. Together, those observations help readers follow one place through four different questions without assuming that identical colors always mean identical categories.
Ideas for lessons, planning context, and presentations
A classroom exercise can begin with the apparent mismatch between developed cover and imperviousness. Ask students to divide a typical residential lot into building, driveway, lawn, and trees. They can then explain why an area may be classified as developed while remaining well below 100 percent impervious. Locating the map’s 50-percent-plus cells adds a real countywide example.
For a coastal lesson, compare the 8.94 percent water share with the 5.70 percent wetland share. Trace the two colors around the southern bays and note how narrow channels create a much more complex shape than the percentages alone convey. Pairing this exercise with the official New York tidal-wetlands information introduces the difference between a generalized land-cover product and a regulatory inventory.
Local planning reference should focus on large patterns rather than parcel decisions. The maps can help identify broad study areas such as fragmented northern tree cover, dense western impervious surfaces, or the wetland-water boundary. Nassau County’s Open Space and Parks Advisory Committee and comprehensive-planning materials provide the policy context for parks and natural resources. A green land-cover cell, however, is not automatically protected or publicly accessible.
Choose one image when clarity matters. The general map is best for a complete environmental overview; the forest view works for habitat and open-space discussions; the impervious product supports development-intensity or stormwater topics; and the comparison map belongs in work explicitly addressing time. If several maps appear on one slide, keep each legend large enough to read and label the dates directly.
Download all four original JPG maps
The ZIP contains the Nassau County general land-cover map, forest-and-farmland map, impervious/developed-land map, and 1985–2025 class-difference map. Each original JPG includes the county outline, north arrow, legend, source period, and map-specific summary. Use individual files for reports and slides, or print the full set for side-by-side comparison.
The WebP images in the article are optimized for preview. The downloadable JPGs retain the source dimensions supplied with the package and are more convenient for print layouts. Keep the 2025 date or 1985–2025 period visible when cropping a map, and check the underlying providers’ attribution guidance before republication.
Limits of a 30-meter coastal land-cover map
Annual NLCD products generally use 30-meter raster cells. A raster cell is one square in a digital grid. A Nassau cell may contain a house, lawn, sidewalk, trees, and part of a street, yet the categorical layer must choose one representative cover. Narrow creeks, isolated buildings, slim wooded strips, and small marsh channels may be simplified at this scale.
Coastal classification has additional complications. Tides, seasonal vegetation, storms, and the date of source imagery can alter the apparent boundary between open water, wetland, barren shore, and developed land. Recent construction or restoration after the observation period will not appear. Site-specific work should combine the maps with current aerial imagery, field inspection, official wetland mapping, elevation, drainage, and parcel information.
Cite percentages with both the measure and date. Developed cover at 78.35 percent is a 2025 categorical share. Mean imperviousness at 33.47 percent is a different surface measure. The 2.01 percent classified to developed belongs only to the 1985–2025 comparison. Keeping those labels attached prevents three useful statistics from being blended into one misleading statement.
Frequently Asked Questions
What is the dominant cover in Nassau County?
Developed land is the dominant 2025 class at 78.35 percent. Water covers 8.94 percent, wetlands 5.70 percent, forest 5.42 percent, and barren land 1.06 percent. Development fills most of the interior, while water and wetlands are concentrated along the southern coast.
Why is the mean impervious value lower than developed cover?
Developed classes can include vegetation around homes and other buildings. Imperviousness counts only hard surfaces such as roofs and pavement. A suburban neighborhood may therefore be developed throughout while lawns and trees keep its impervious percentage well below the developed-cover share.
Does the 7.41 percent difference mean new development?
No. Only 2.01 percent is labeled as classified to developed. Other differences account for 5.16 percent, while mapped forest and agricultural losses are 0.05 and 0.02 percent. Classification variation may also contribute, so the total cannot be treated as one type of change.
What does the download include?
The ZIP includes four original JPG files: general land cover, forest and farmland, impervious/developed land, and the 1985–2025 comparison. The article’s WebP images are quick previews; the JPG maps are better suited to printing, offline reference, and presentation layouts.
Map File Information
Get the four original JPG maps—general cover, forest and farmland, impervious surface, and the 1985–2025 comparison—in one ZIP.
- Included Files: Use only the versions confirmed in the article and supplied images
- File Type: Use the confirmed download contents
- Intended Use: Printing, education, presentations, and map-based projects
Related Maps
- Albany County Land Cover Map
- Allegany County New York Land Cover Map
- Bronx County New York Land Cover Map
Sources and references
- MRLC Annual NLCD Data — official land-cover and impervious-surface products
- USGS Annual NLCD Land Cover Classification — class definitions and interpretation guidance
- U.S. Census Bureau TIGER/Line Shapefiles — county boundary data
- Nassau County Open Space & Parks Advisory Committee — official county open-space and parks context
- NYSDEC Tidal Wetlands — official tidal-wetland mapping and program information for Long Island
Green Map creates custom-edited map images using open geographic data sources such as geoBoundaries, Natural Earth, OpenStreetMap, and government open data.
These maps are edited visual materials, not raw data files, and are provided for education, documents, presentations, and graphic reference.