Livingston County has an unusually clear internal contrast on the 2025 land-cover map. Broad agricultural ground dominates the northern and western portions, while larger blocks of woodland become more common toward the south and east. Agriculture accounts for 50.90% of the mapped county area, compared with 32.61% forest. Developed cover is much smaller at 10.38%, and wetlands and open water together occupy less than six percent.
Instead of presenting four maps as separate products, this page uses them to answer four different questions about the same landscape. The first image shows the overall mix of cover types. The second strips away much of the urban detail so the farm-to-forest transition is easier to see. The third focuses on hard surfaces such as pavement and rooftops. The fourth highlights where the mapped class differs between 1985 and 2025. The original JPG versions of all four images are bundled in one ZIP for download.
Table of Contents
The strongest pattern is a north-to-south change in land cover
The county does not look uniform from one edge to the other. Across much of the north and west, agricultural colors occupy large connected areas. Farther south, forest cover grows broader and more continuous. The eastern side also contains more wooded ground than the heavily farmed northwest. That shift gives Livingston County a recognizable internal geography even before individual settlements or roads are considered.
The 50.90% agricultural share is large enough to shape most of the map, but it does not erase the 32.61% forest share. Woodland appears both as large southern blocks and as smaller pieces scattered within farm country. This mixture is important because it means an agricultural countywide majority does not translate into a completely open landscape.
Wetlands cover 4.15%, while open water accounts for 1.53%. A long narrow water feature near the center is one of the easiest landmarks to follow across all four map views. Smaller wet areas occur elsewhere and often interrupt otherwise continuous agricultural or forest patterns.
Developed land accounts for 10.38% of the county and remains concentrated around a limited number of settlement areas and connecting routes rather than spreading evenly across the map. The result is a landscape where built surfaces remain visually secondary to farms and woodland, even though they are locally important.
Start with the full 2025 land-cover image
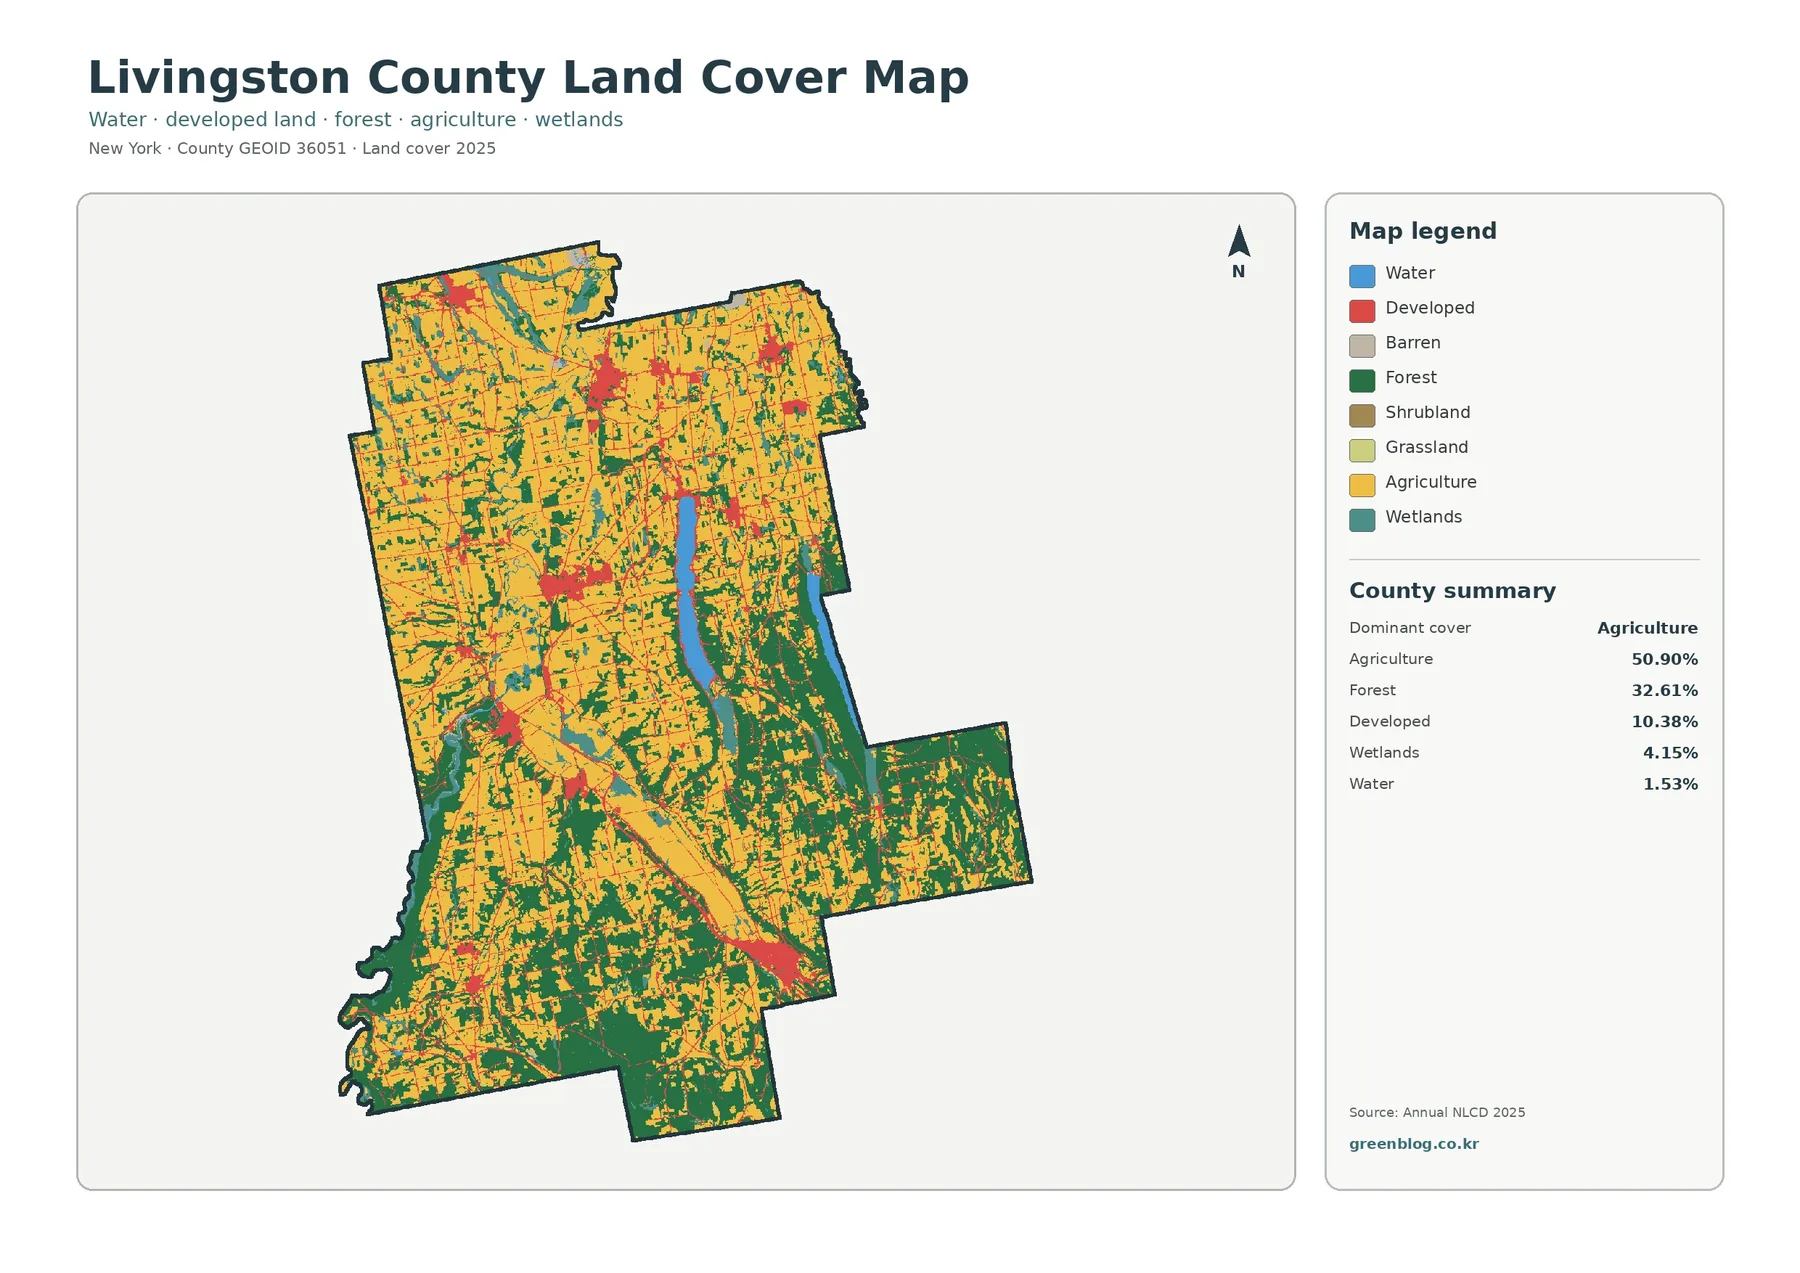
The full map works best as an orientation image. Agricultural areas are easiest to pick out across the upper and western portions, while forest becomes more continuous below and toward the east. Developed cover forms smaller red concentrations between those larger rural classes. Water and wetland colors provide narrow breaks that help separate one part of the county from another.
One advantage of this view is that it keeps the minor classes visible instead of reducing the county to only farms and woods. Even small wetland or water areas can matter visually because they interrupt large blocks of agriculture. The same is true for developed centers: their countywide share is modest, but their location makes them easy to identify.
The image should be read at county scale. Because the dataset uses raster cells rather than parcel lines, a single cell can summarize a mixture of grass, trees, pavement, bare soil, or buildings. A sharp color edge on the screen is therefore not a legal boundary. That edge represents a generalized classification boundary instead.
That distinction also applies to the labels themselves. ‘Agriculture’ describes the mapped surface class and does not identify the crop, ownership, or zoning of a parcel. ‘Developed’ similarly describes a built surface pattern rather than a legal land-use category.
The rural-cover view reveals the agricultural belt more clearly
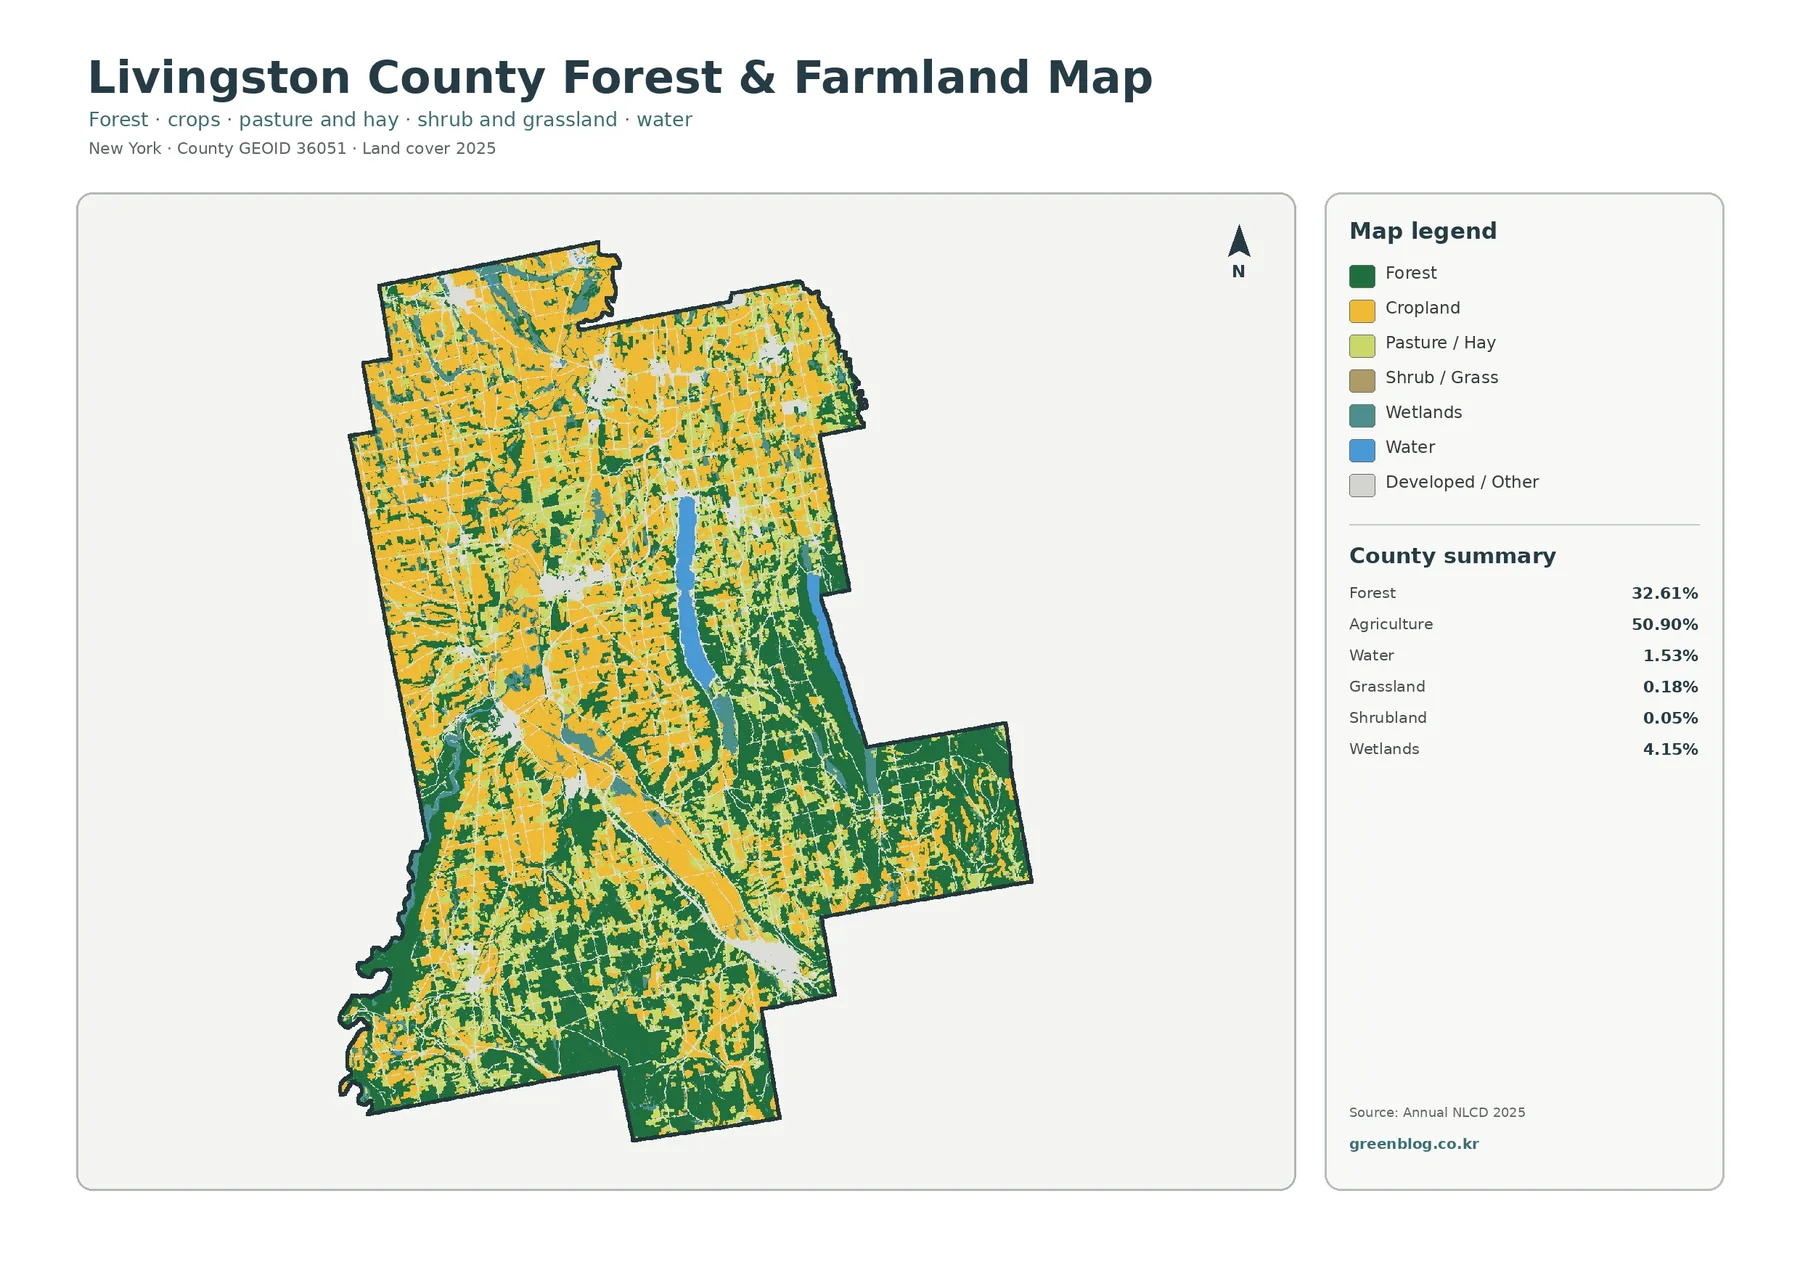
When developed and miscellaneous classes are visually reduced, the agricultural structure becomes much easier to follow. Cropland and pasture or hay stretch across a large portion of the county, especially toward the north and west. Forest occupies more connected ground toward the south and southeast.
This simplified version is useful because the 50.90% agricultural total contains more than one rural surface type. Cropland and pasture or hay are shown separately, so the farm landscape does not appear as a single unbroken category. The contrast between those agricultural classes and the 32.61% forest share is more legible here than on the full map.
The central water feature remains visible and acts as a reference line. Around it, agricultural cover narrows or changes shape, while woodland becomes more prominent in nearby areas. Wetlands also remain on the map, helping explain why some transitions are irregular rather than straight.
This map is not intended to identify individual farm operations. For county-scale reading, this view is more useful for showing how farm country is arranged and where it gives way to larger wooded areas.
Hard-surface intensity is concentrated in a few places
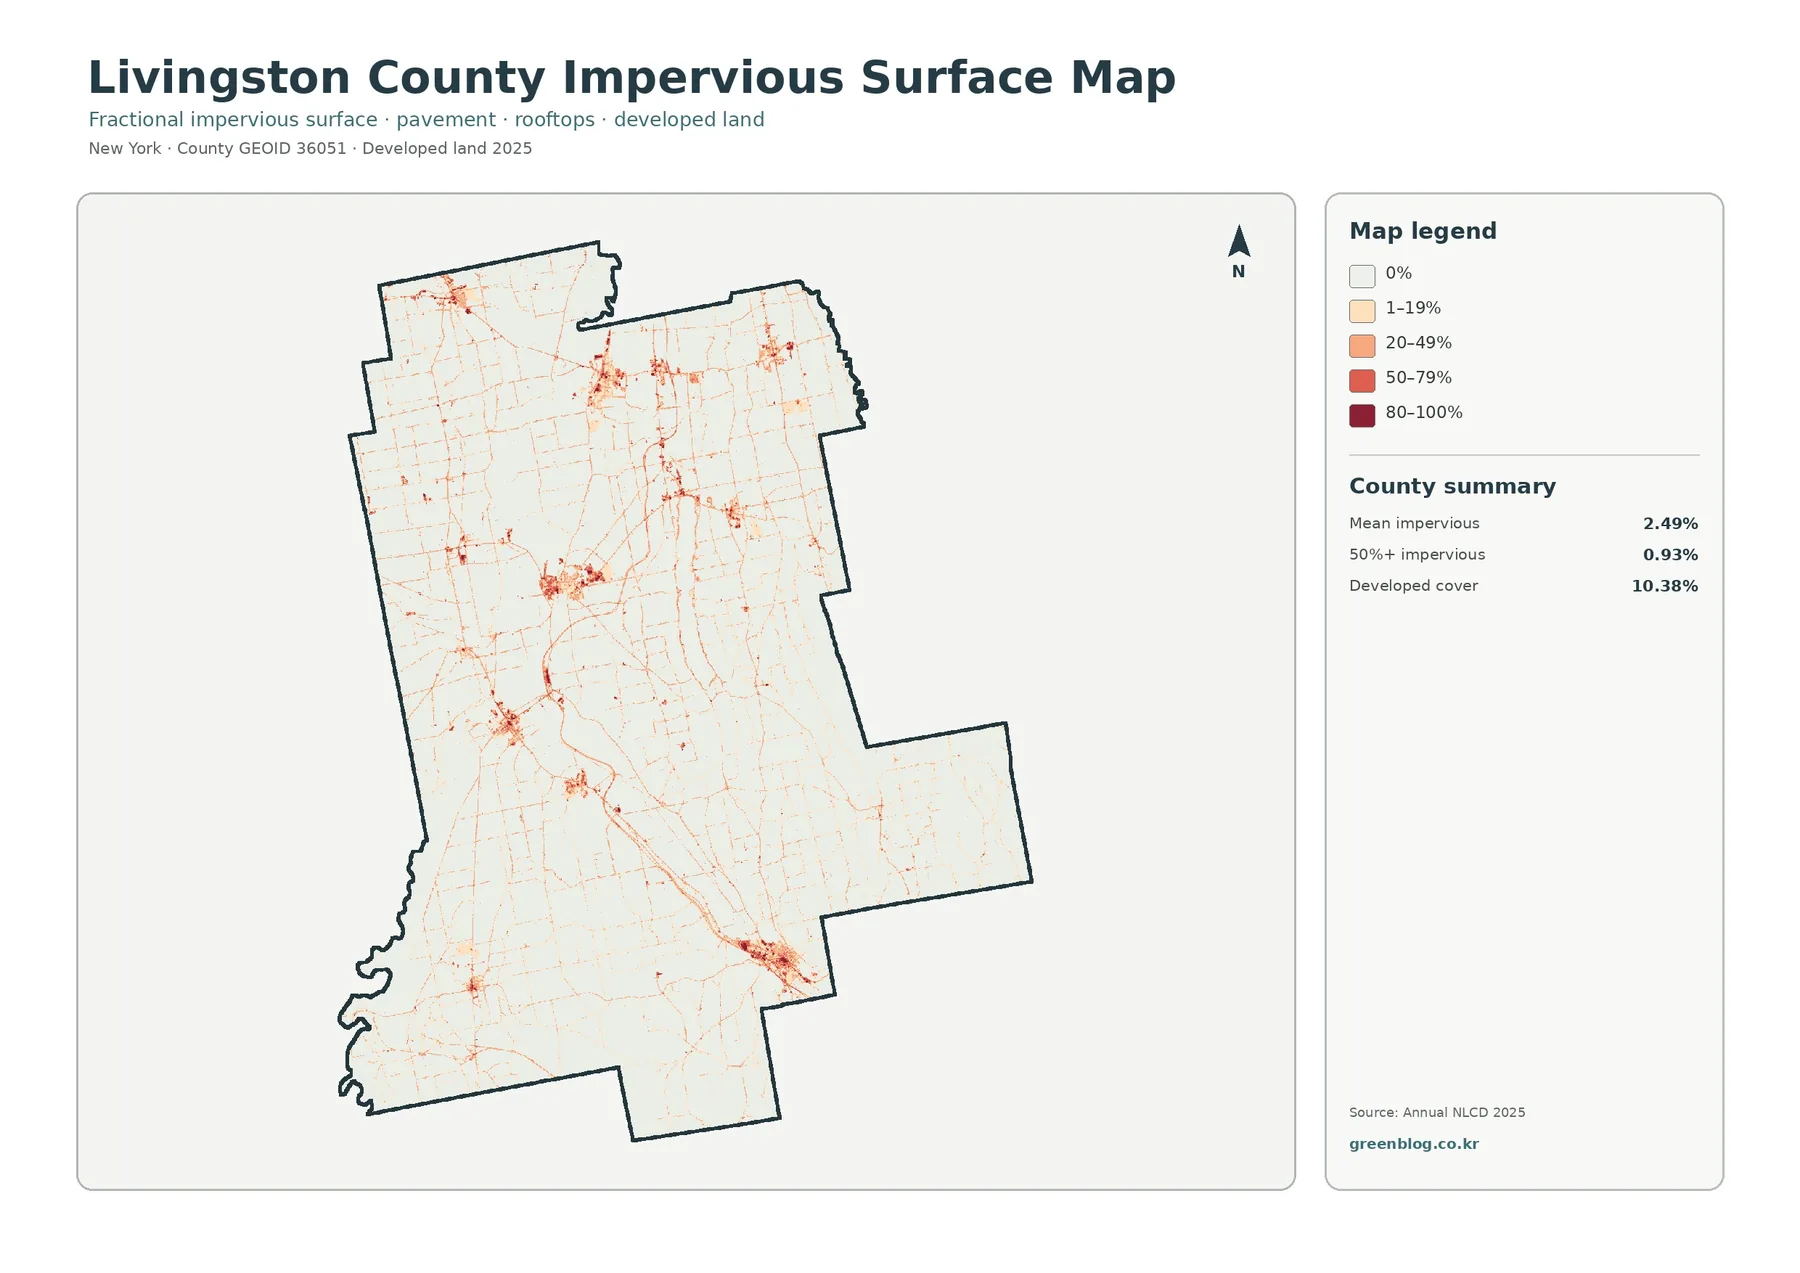
Livingston County’s mean impervious value is 2.49%, and only 0.93% of the mapped area reaches at least 50% impervious cover. Those figures are much lower than the 10.38% developed-land share because a developed cell can still contain lawns, trees, soil, and other surfaces alongside buildings and roads.
Looking at hard-surface percentages answers a different question from the general land-cover image. Instead of asking whether an area is classified as developed, it shows how much of each cell is actually covered by hard surface. The strongest values appear around several settlement centers and along a limited number of connecting corridors.
Away from those centers, the map quickly fades into low-intensity classes. Large farm and forest areas contain little dark impervious color. This contrast makes the layer especially useful for explaining the difference between a county that contains developed places and a county whose entire surface is heavily built.
Runoff or flood risk cannot be inferred from this layer alone. Imperviousness is only one part of the picture because drainage systems, soil, elevation, streams, wetlands, and rainfall conditions also affect how water moves across the landscape.
The 1985–2025 comparison shows scattered class differences
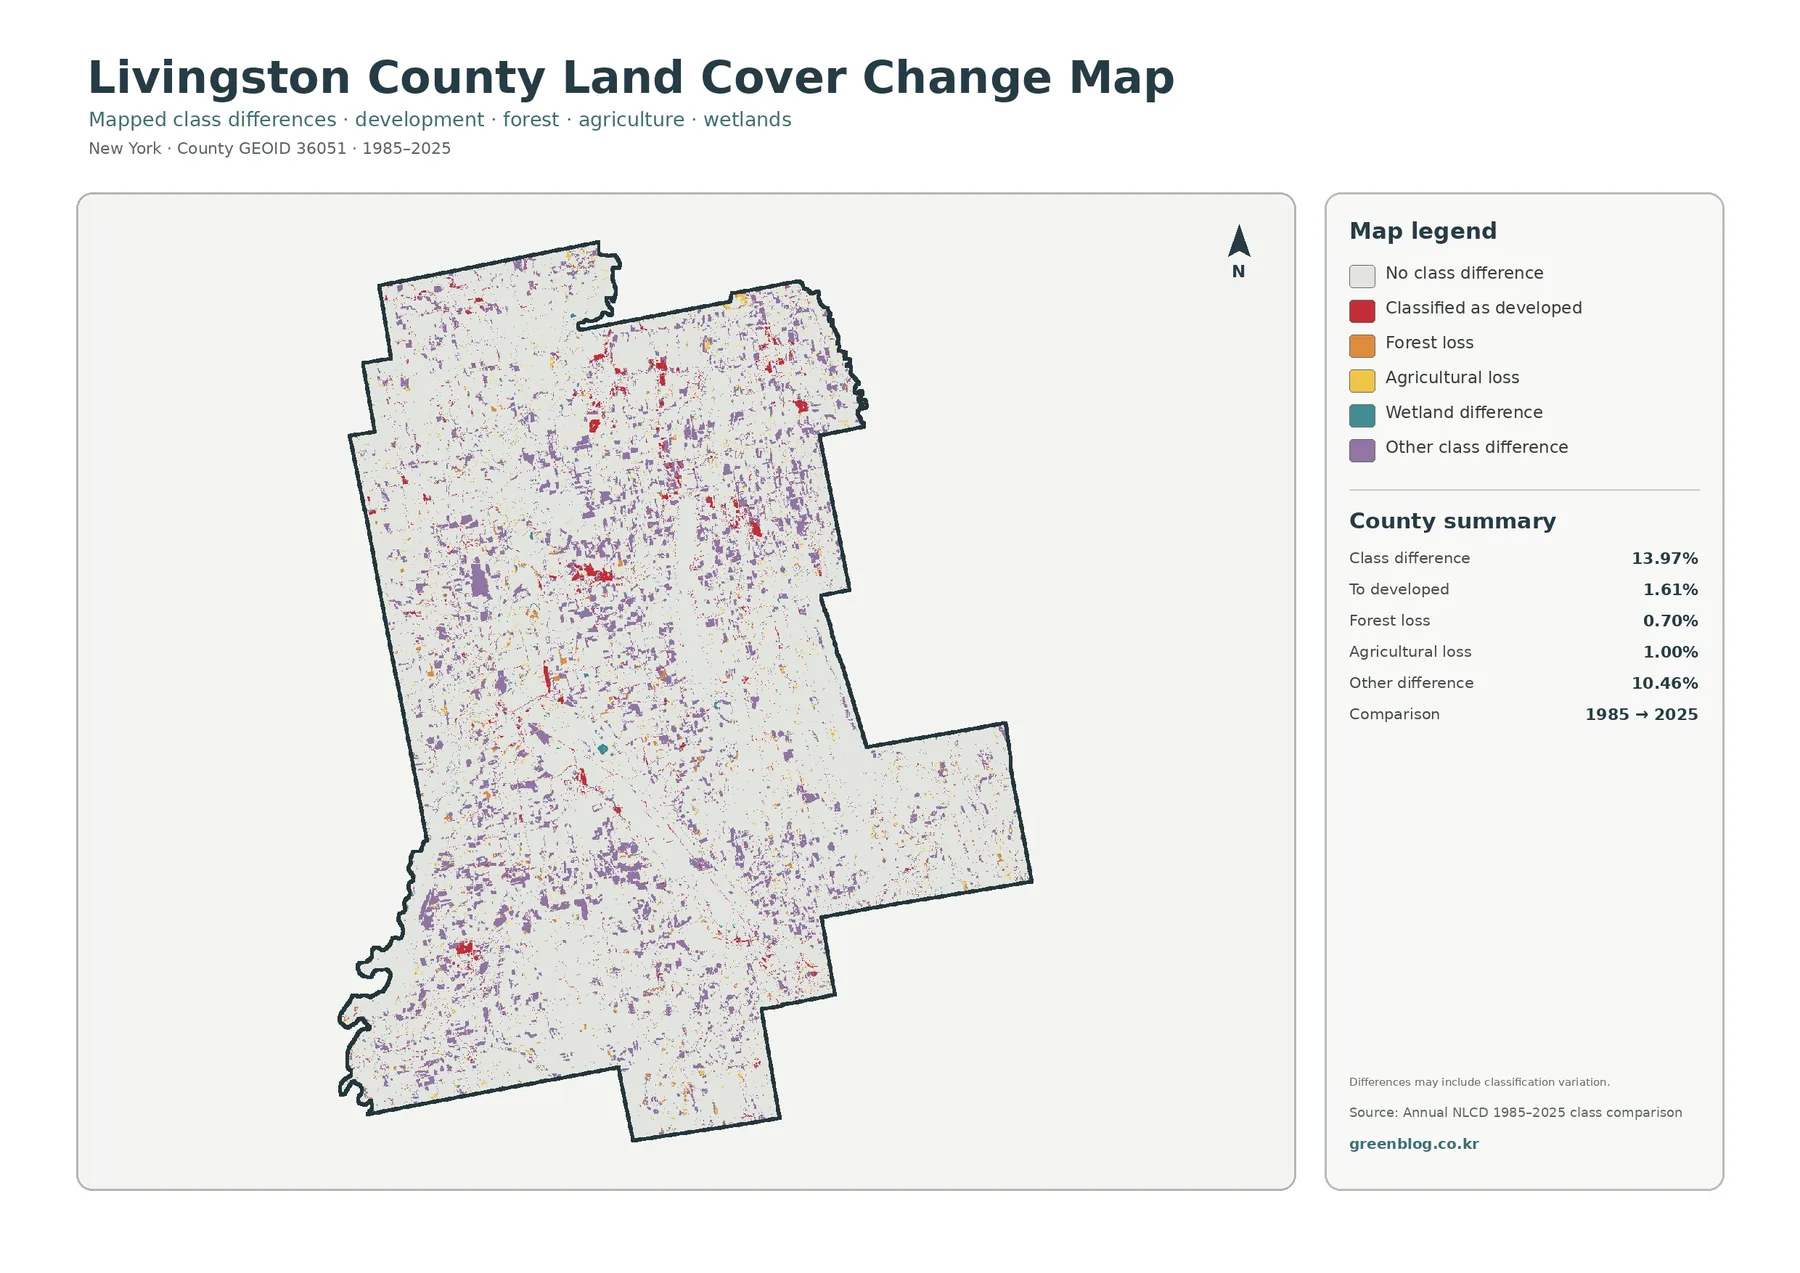
Across Livingston County, 13.97% of the mapped area falls into a different class in the 1985–2025 comparison. The largest share is the general ‘other difference’ group at 10.46%. Smaller portions are mapped as a shift to developed cover at 1.61%, agricultural loss at 1.00%, and forest loss at 0.70%.
These differences are not concentrated in one giant block. Instead, the map contains many smaller patches spread through both agricultural and wooded areas. Some developed-change cells appear near existing settlement zones, while other categories are more dispersed.
A change color should be treated as a signal to investigate, not as a complete historical explanation. Classification can vary because of real land-surface change, but also because of mixed pixels, imagery conditions, or changes in how a cell is categorized. For a specific site, historical aerial photography or local records provide a better way to determine what actually happened.
The map is most useful when larger clusters are compared rather than isolated single cells. Repeated patches across one part of the county can point to a broader pattern worth examining with more detailed evidence.
Use the four views as a sequence, not as duplicates
A practical reading order begins with the complete land-cover image. That establishes the countywide balance between farms, woodland, developed areas, water, and wetlands. The rural-cover map can then be used to study the agricultural belt and the wooded south in more detail.
When the focus shifts from land-cover type to surface intensity, the hard-surface view becomes the useful next step. It shows which developed places contain more pavement and rooftops and which remain relatively open. The final comparison map adds a time dimension by locating differences between the two classification periods.
This sequence works well in presentations and classrooms because each map adds one layer of interpretation without requiring a new geographic boundary. A reader can follow the same location through all four images and see how its classification, rural context, hard-surface share, and long-term comparison differ.
Download the Livingston County map package
The ZIP package contains four original JPG files for Livingston County: the full 2025 land-cover image, the forest-and-farmland view, the impervious-surface map, and the 1985–2025 comparison. These files are intended for users who need larger copies than the WebP previews shown on the page.
What the maps should not be used for
These images are not parcel maps, zoning maps, or legal land-use records. They summarize the physical cover of the ground at raster-cell scale. Narrow roads, small buildings, field edges, and tiny wetland features may be simplified or absorbed into a neighboring class.
Exact building footprints are not shown in the hard-surface layer either. It estimates how much of a cell is covered by hard surfaces. Enlarging the image makes the cells easier to see but does not create new survey-level information.
The 2025 classification is a snapshot for that mapped period, and the 1985–2025 comparison is a comparison between classified datasets. Current construction, ownership, zoning, permits, and other administrative information must be checked through separate official sources.
Frequently Asked Questions
Which land-cover type occupies the largest share of Livingston County?
Agriculture is the largest category at 50.90%. Forest is second at 32.61%, with the most extensive wooded areas appearing toward the south and east.
How much of Livingston County has high impervious cover?
The countywide mean impervious value is 2.49%. Only 0.93% of the mapped area reaches at least 50% impervious cover, so the highest concentrations are limited to a relatively small number of developed locations.
What is inside the downloadable ZIP?
The ZIP includes four original JPG maps: full land cover, forest and farmland, impervious surface and developed land, and the 1985–2025 land-cover comparison. Map File Information Livingston County Land Cover Map Files
Map File Information
Download the map files associated with this page for reference, printing, and compatible visual projects.
- Included Files: Use only the versions confirmed in the article and supplied images
- File Type: Use the confirmed download contents
- Intended Use: Printing, education, presentations, and map-based projects
Related Maps
- Albany County Land Cover Map
- Allegany County New York Land Cover Map
- Bronx County New York Land Cover Map
Sources and reference data
The map set is based on Annual NLCD land-cover information together with U.S. Census geographic boundary data. The three official links below provide the source classifications and boundary files used for this type of county map.
USGS Annual NLCD Land Cover Classification
U.S. Census Bureau TIGER/Line Shapefiles
Green Map creates custom-edited map images using open geographic data sources such as geoBoundaries, Natural Earth, OpenStreetMap, and government open data.
These maps are edited visual materials, not raw data files, and are provided for education, documents, presentations, and graphic reference.