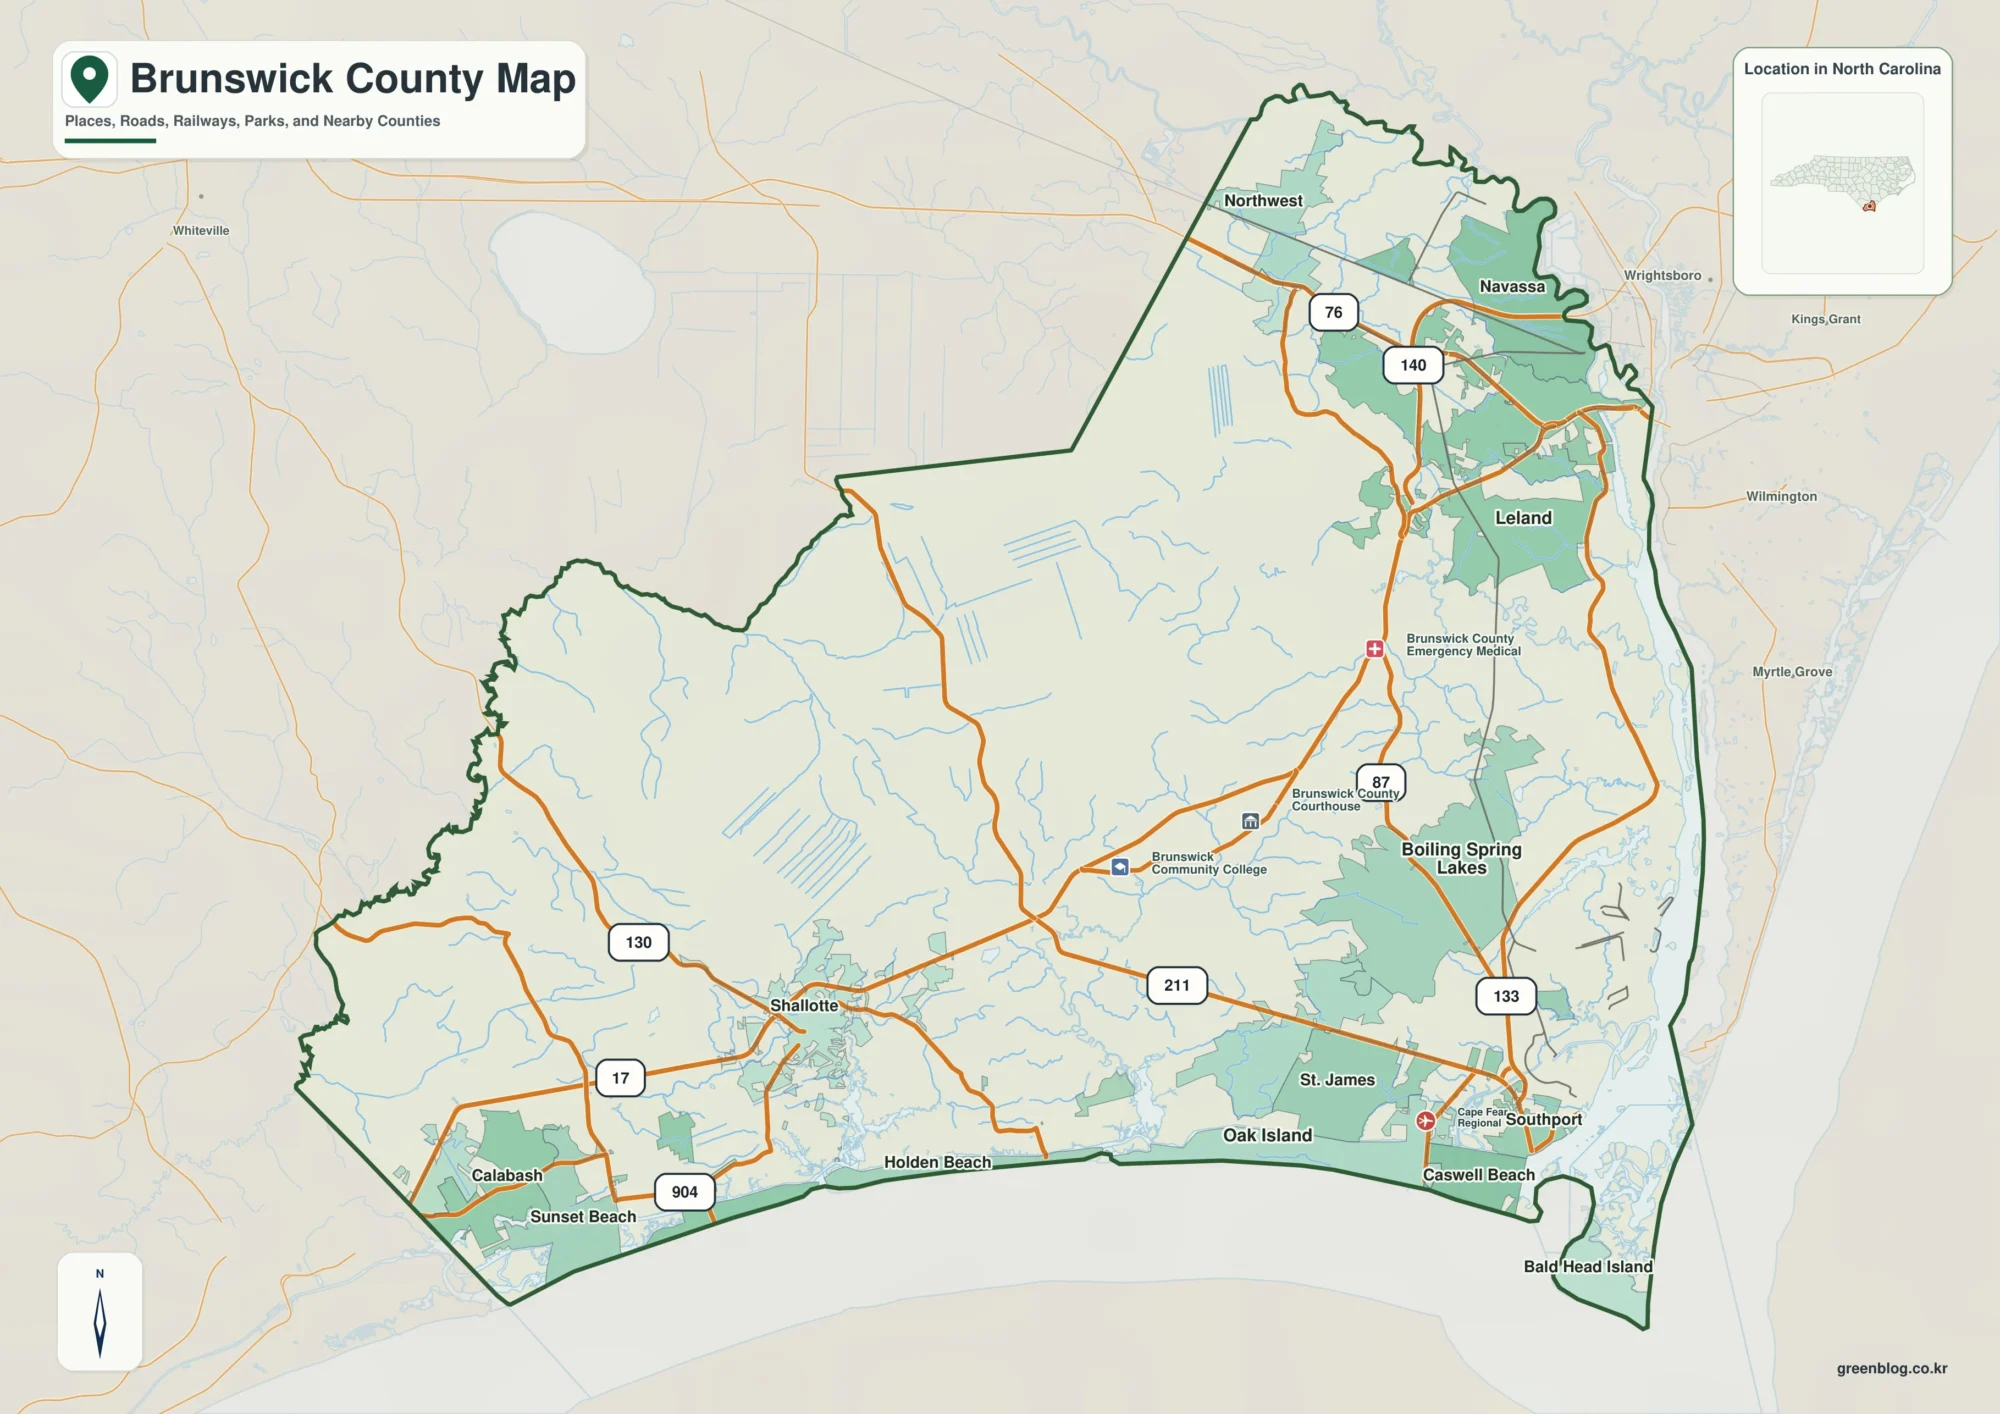
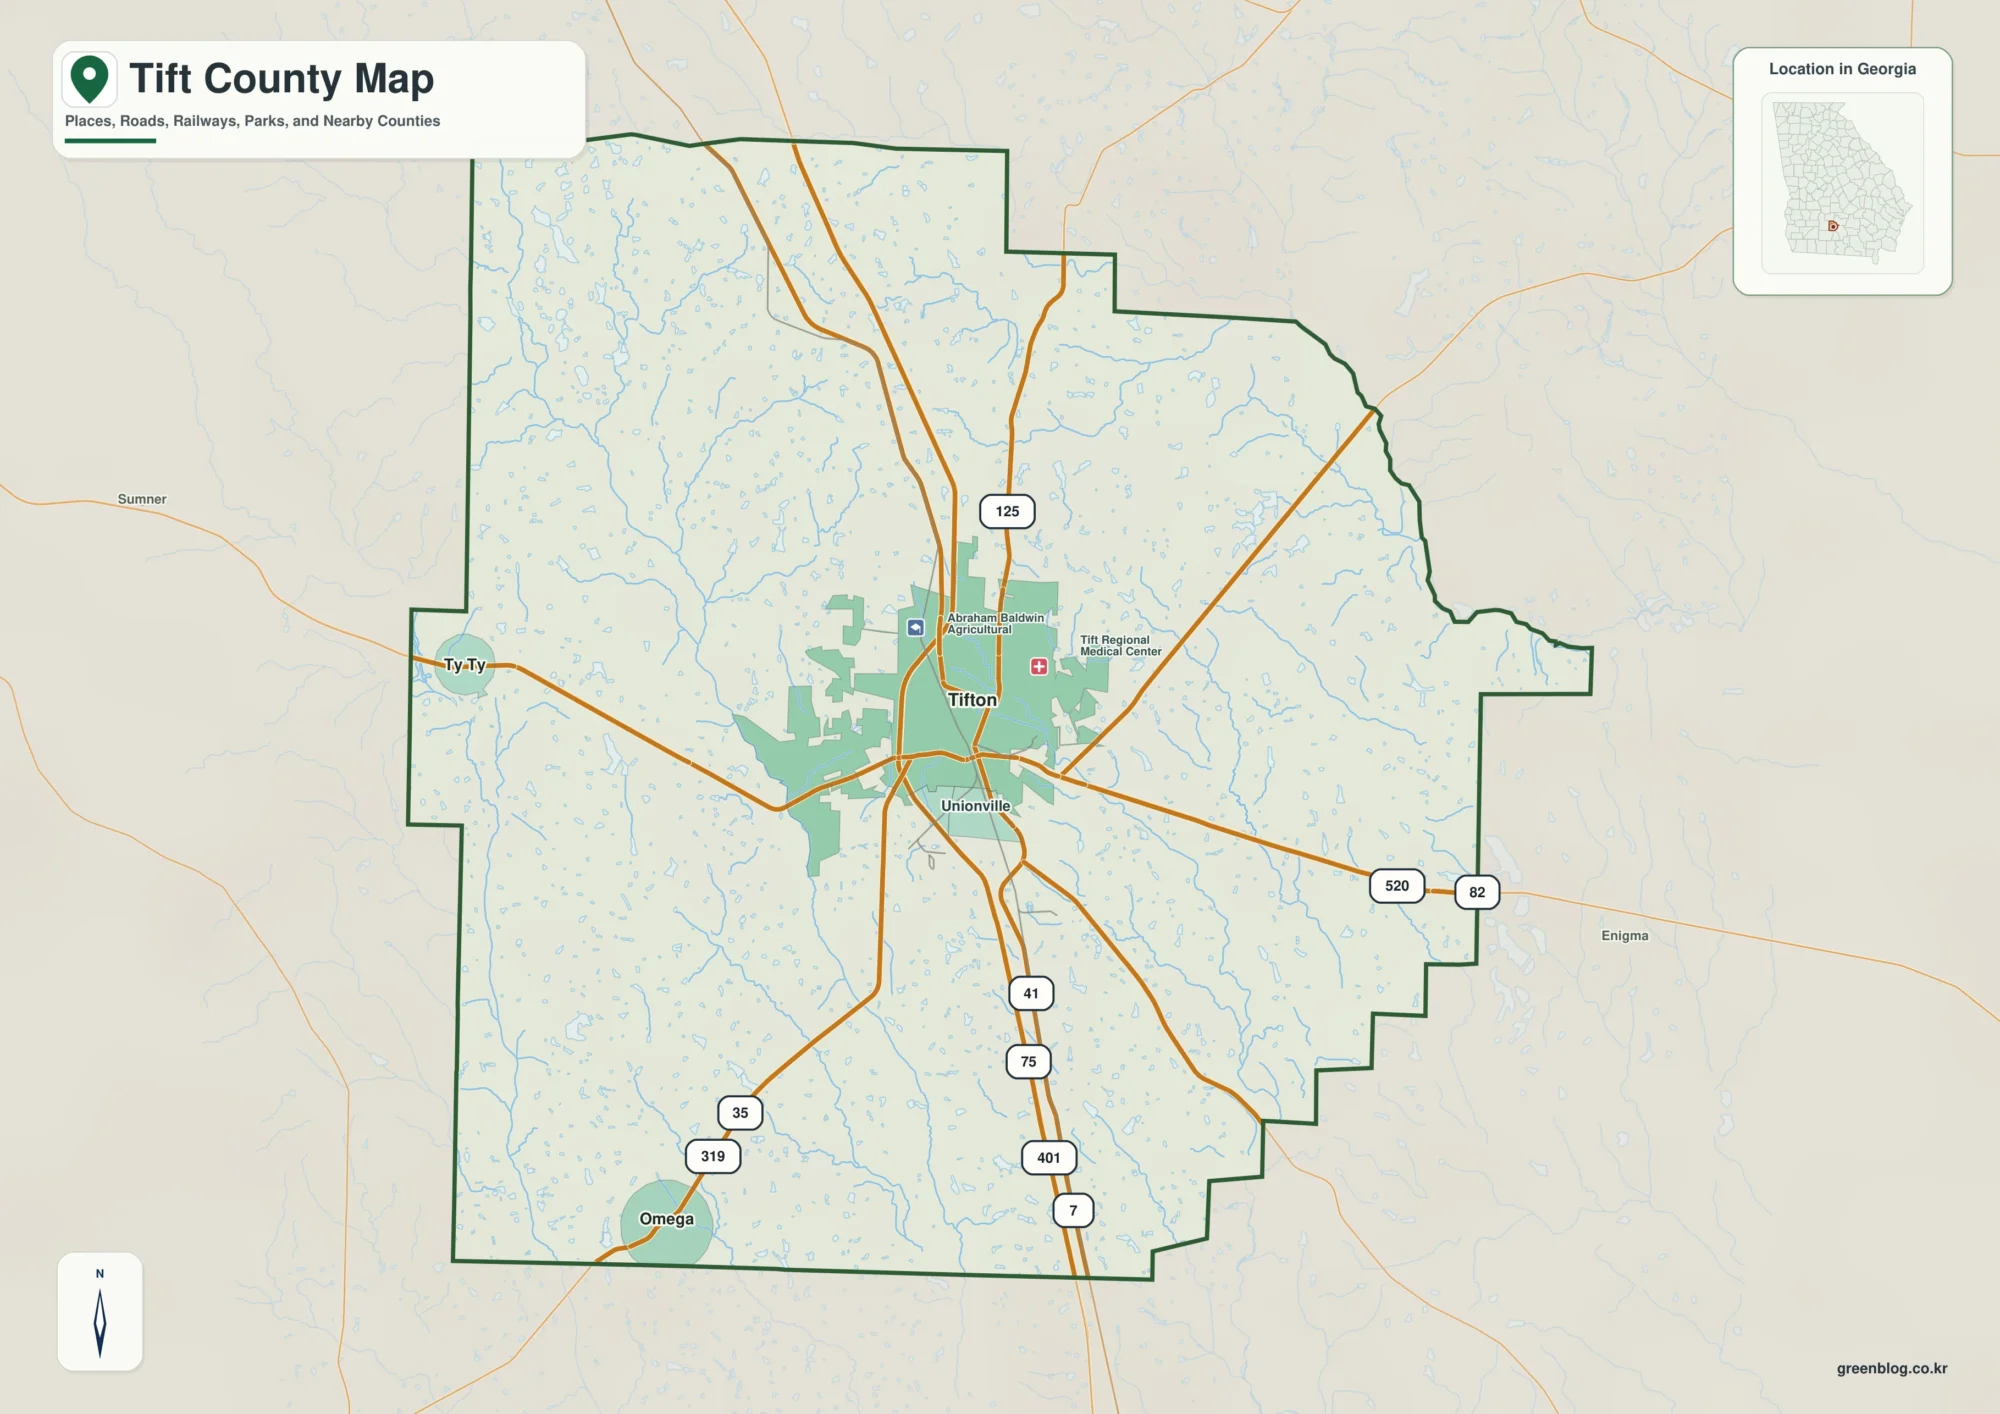
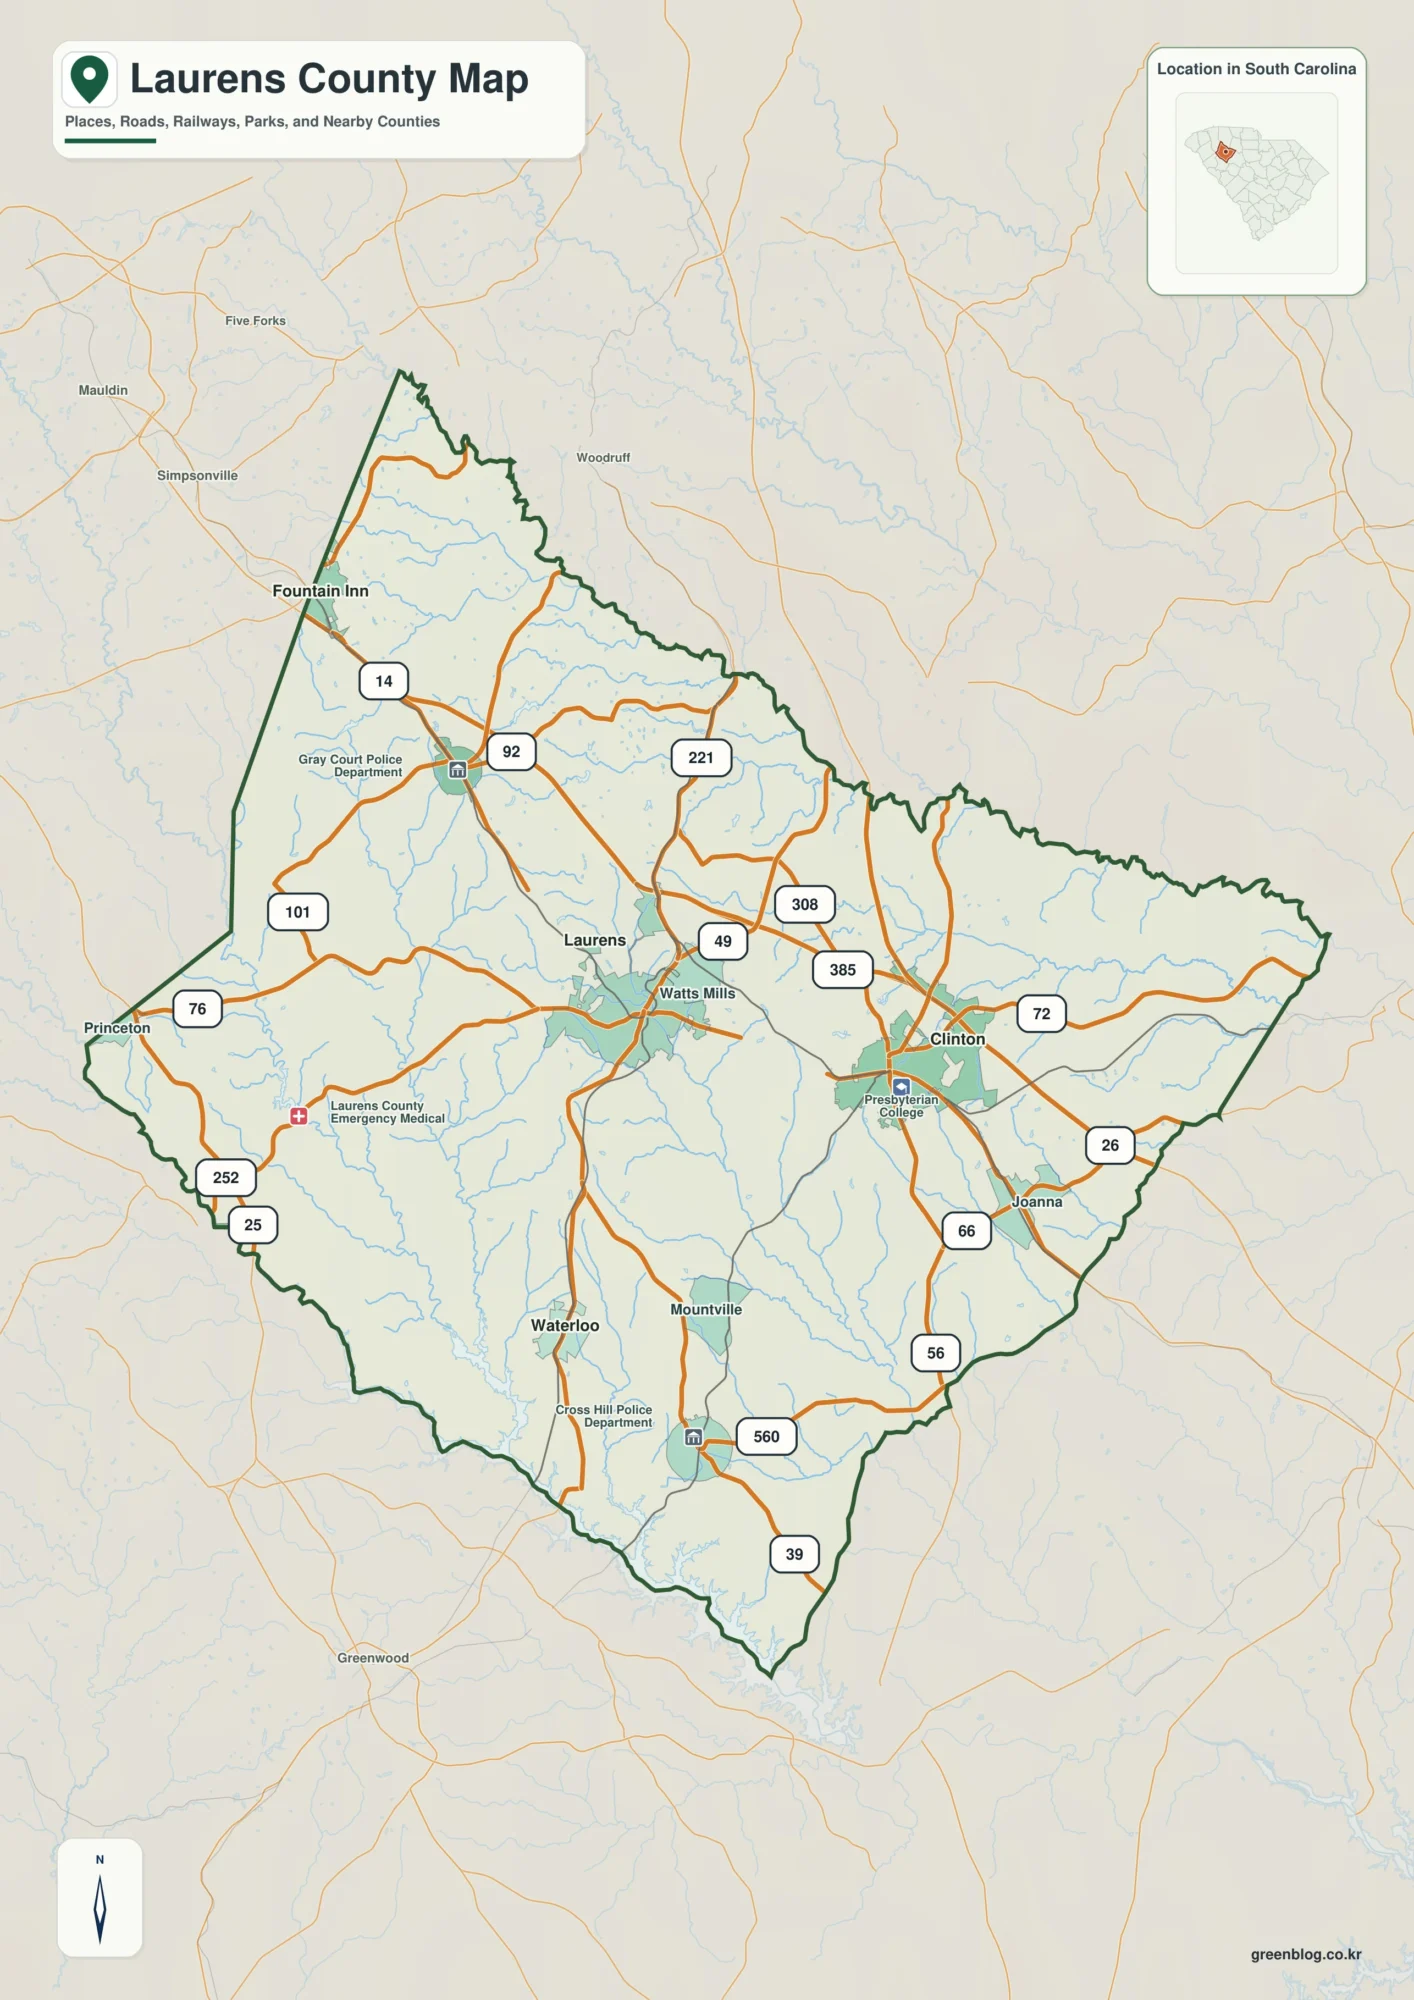
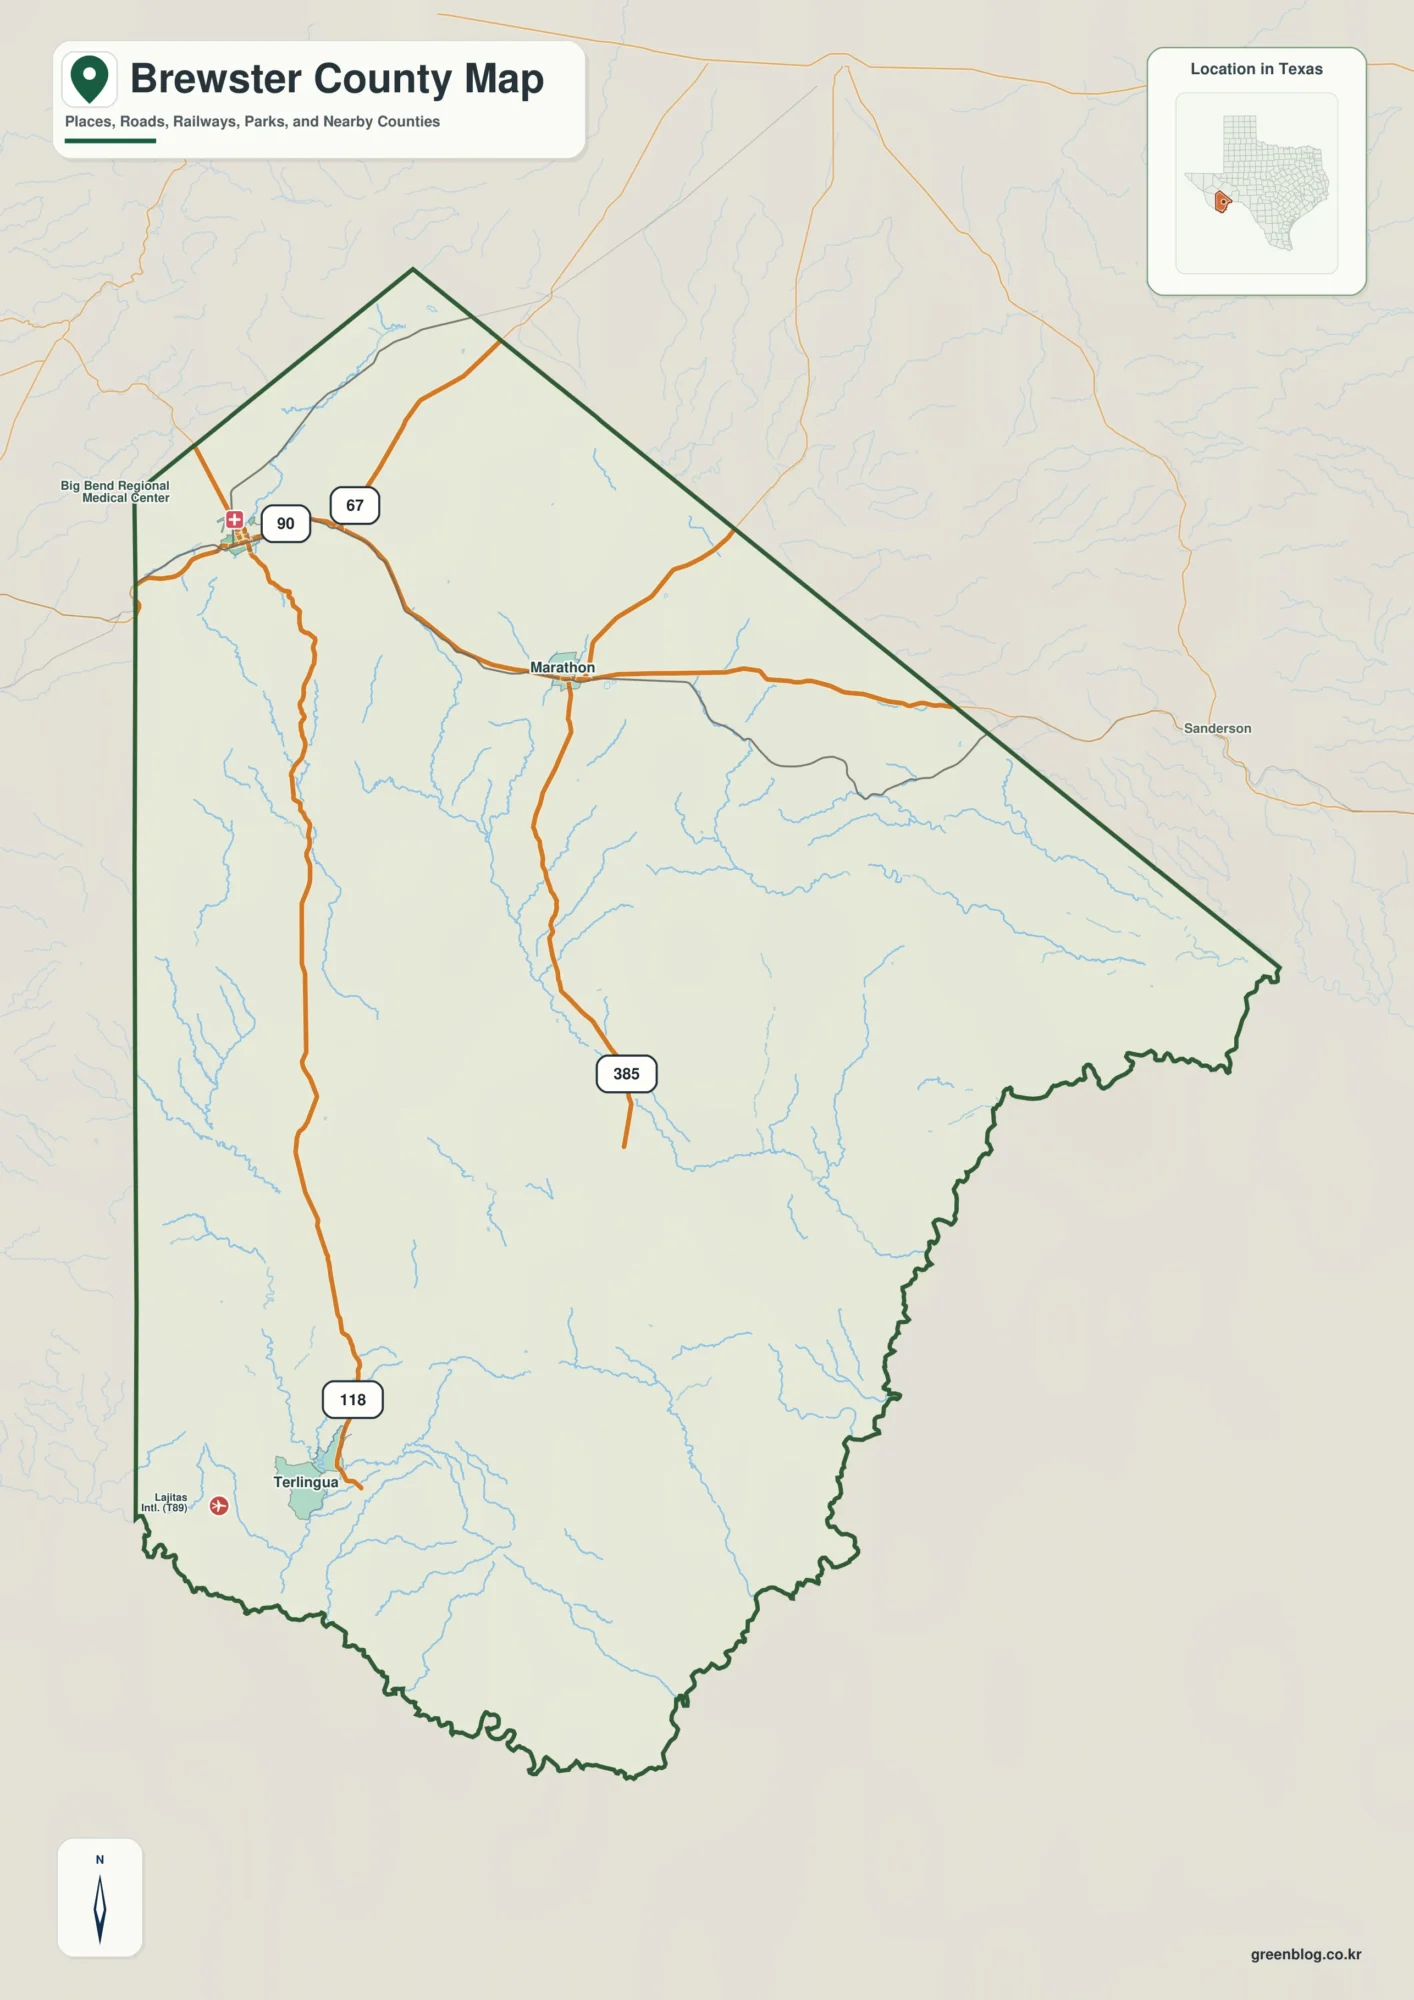
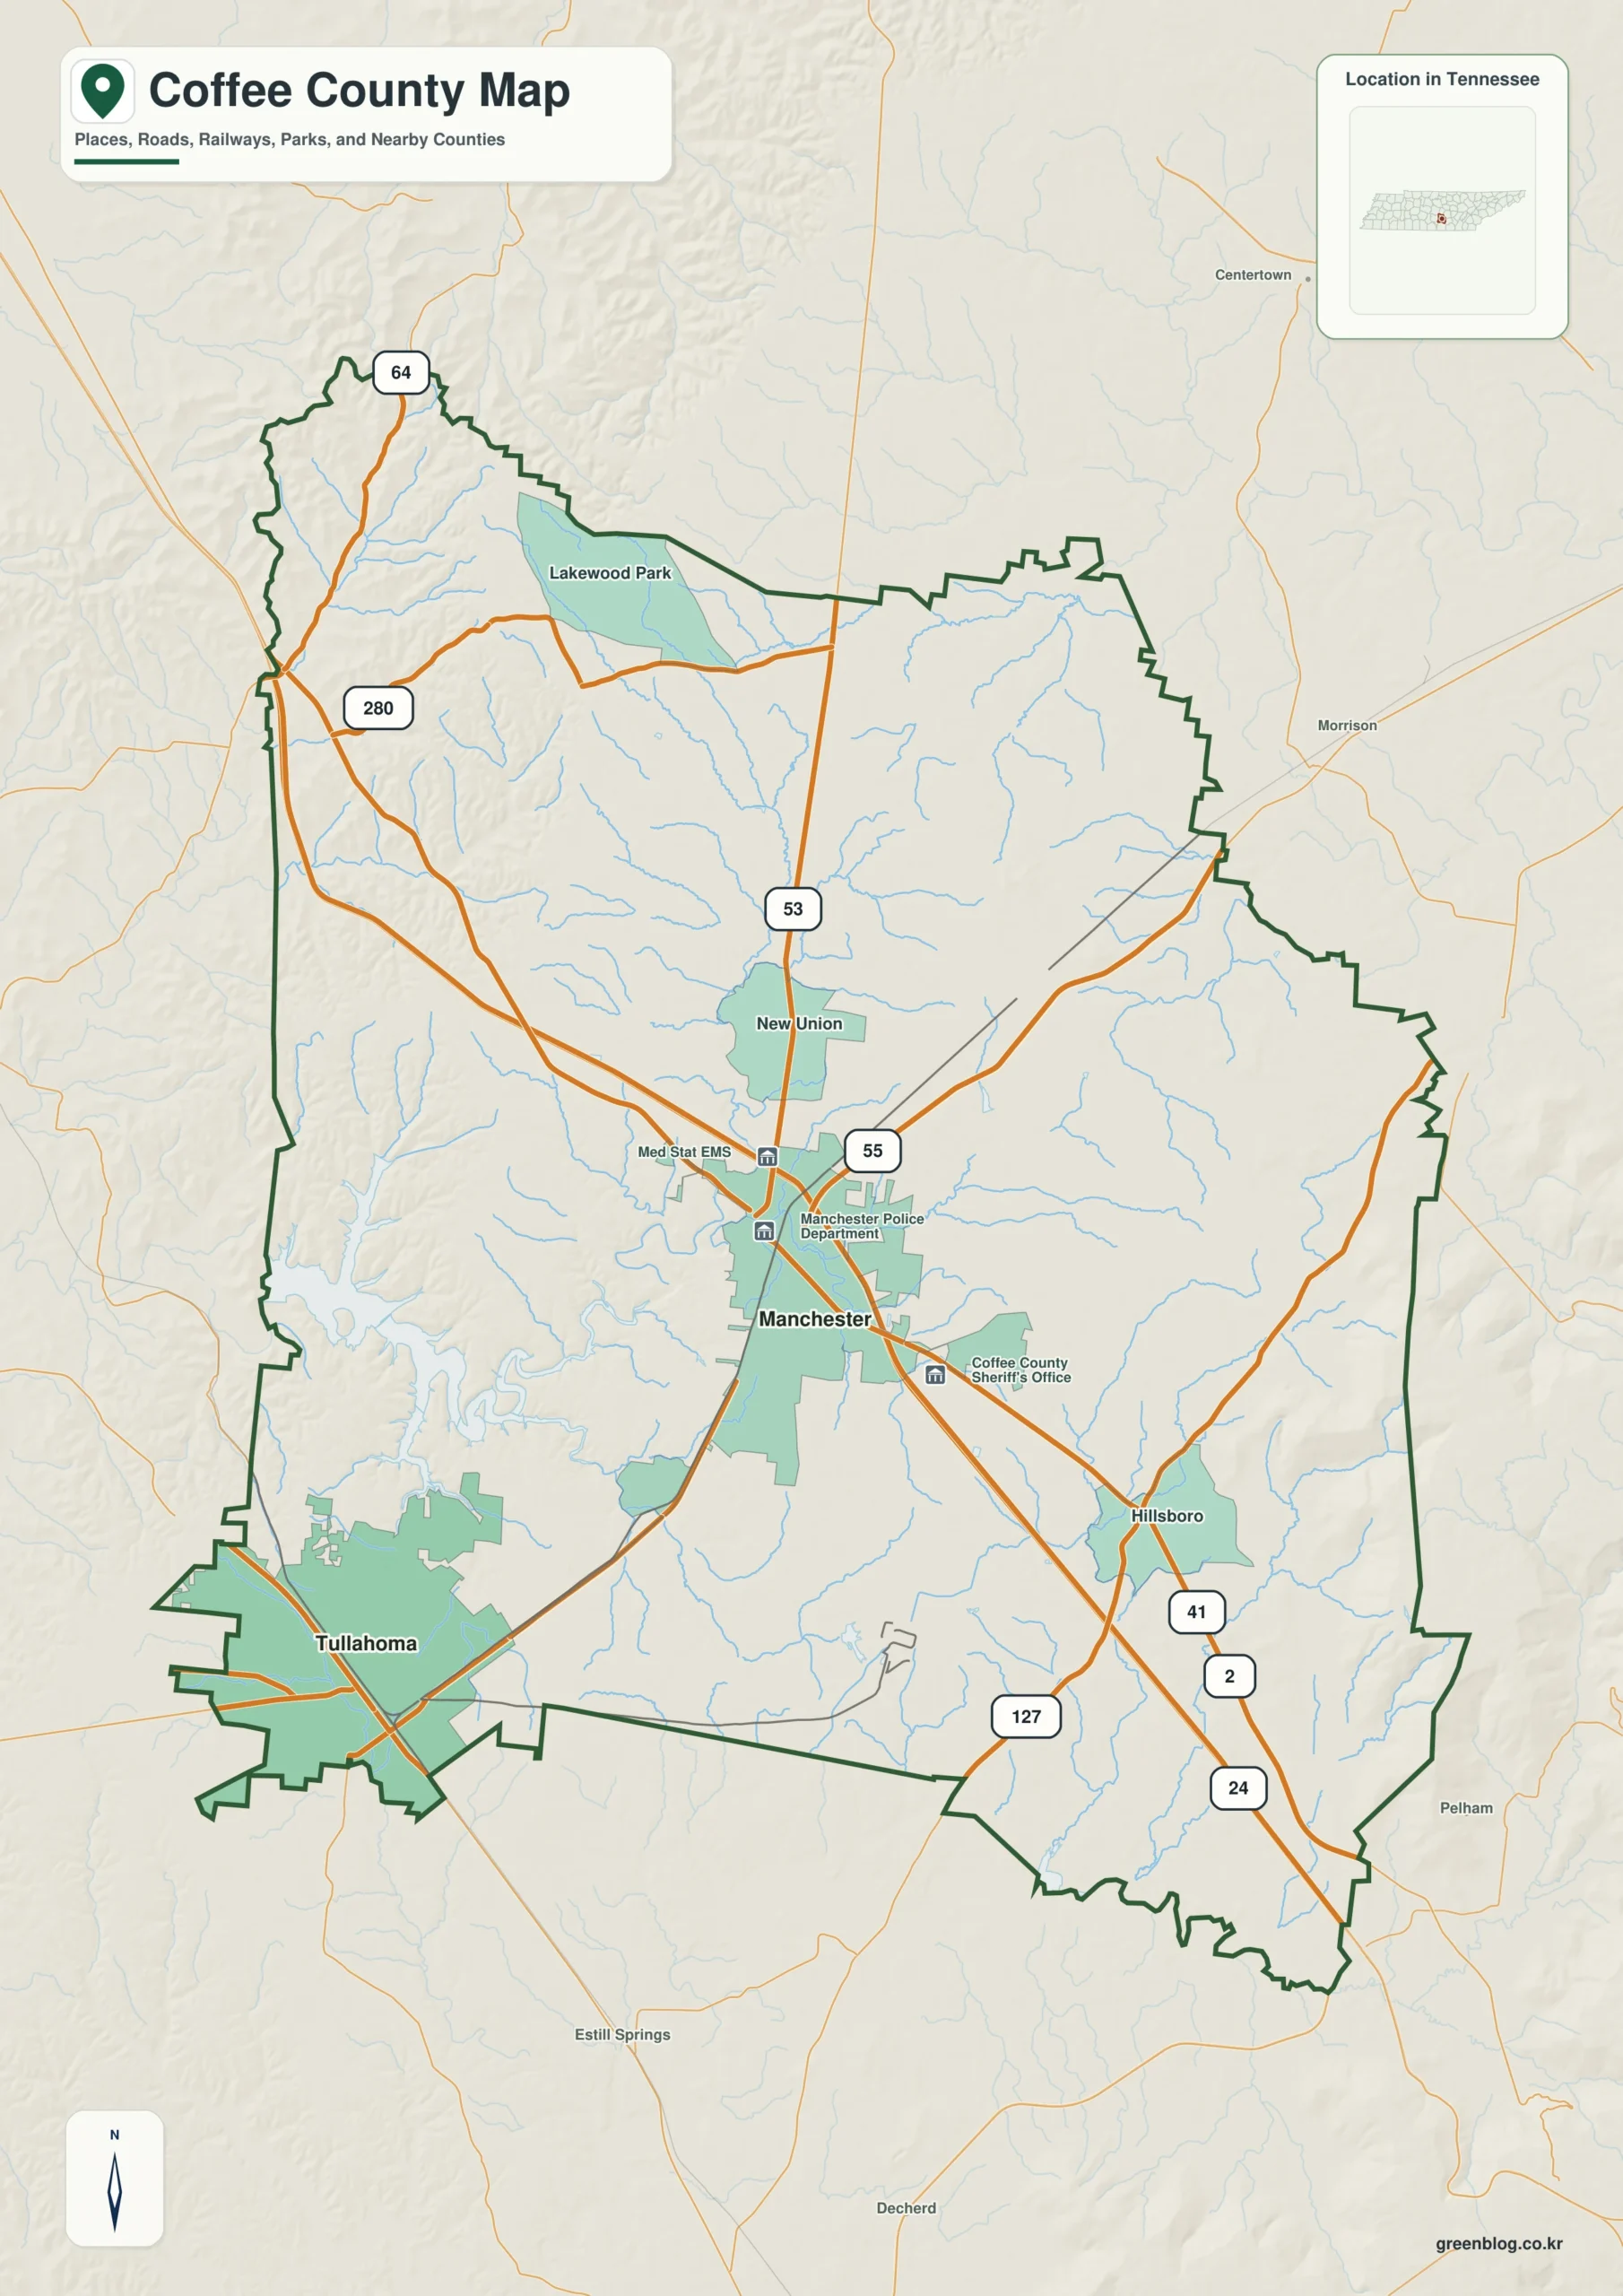
Coffee County Tennessee map readers should begin with Manchester, the county seat, and then compare it with Tullahoma, Hillsboro, Beechgrove. These labels are not interchangeable dots: they identify the administrative center, separate settlement corridors, and the approaches toward neighboring counties. Reading those anchors before the smaller roads makes the county outline much easier to understand.
The map becomes more useful when population and terrain are kept in view. The 2020 census counted 57,889 residents, while the Census Bureau’s July 2025 estimate is 62,419. The county contains 429.0 square miles of land and 5.6 square miles of water. Routes such as I-24, US 41, US 41A must therefore be read together with Old Stone Fort State Archaeological Park, Lakewood Park, rather than as lines crossing an empty shape.
Coffee County Tennessee map download
The preview can be served as WebP, while the button keeps the original high-resolution JPG for printing or reuse.
- File: County reference map
- Format: JPG
- Print layout: A3
Quick Facts
- State and identifier: Tennessee, Coffee County; FIPS 47031
- County seat: Manchester
- Selected map labels: Manchester, Tullahoma, Hillsboro, Beechgrove
- 2020 census population: 57,889
- July 2025 population estimate: 62,419
- 2025 Gazetteer area: 429.0 sq mi land and 5.6 sq mi water
- 2020 land-area density: about 135.0 residents per sq mi
- Primary route references: I-24, US 41, US 41A
- Landscape references: Old Stone Fort State Archaeological Park, Lakewood Park
For Coffee County, the 2025 estimate is 7.8% above the 2020 census count. It should be labeled as an estimate, not substituted for the decennial count. The density figure uses the 2020 population and the current Gazetteer land area, so it describes countywide scale; it does not imply that residents are evenly spread across towns, farms, valleys, or protected land.
Coffee County Tennessee map: What the Map Shows
Manchester is the first administrative anchor. Tullahoma provides a second reference outside the seat, while Hillsboro, Beechgrove extend the comparison toward other parts of the county. Marking the seat with a different symbol prevents a larger commercial center or a familiar tourist name from being mistaken for the place where county government is based.
The road layer is best simplified to I-24, US 41, US 41A. These routes indicate the main county-scale approaches, but the static map does not show every interchange, local road, bridge restriction, or construction condition. When a route follows a valley, crosses a river, or bends around higher ground, its mapped shape explains practical access better than a straight line between Manchester and Tullahoma.
The physical layer of Coffee County uses Old Stone Fort State Archaeological Park, Lakewood Park as orientation references. Water bodies, ridges, plateaus, and floodplains can divide nearby labels into different travel corridors. They also explain why blank-looking areas may contain public land, steep slopes, wetlands, or reservoirs rather than missing settlements.
The county meets Cannon County, Warren County, Grundy County, Franklin County, Moore County, Bedford County, Rutherford County. Those boundaries matter because several named communities, highways, watersheds, and service areas continue beyond the county line. A place name near the edge should therefore be checked against the boundary instead of being assigned to Coffee County solely because it appears close to the outline.
Within Coffee County, TWRA, Bark Camp Barrens Wildlife Management Area, Hickory Flats Wildlife Management Area, Maple Hill Wildlife Management Area add a second scale to the map. Protected areas are useful for recognizing broad landscape blocks, but their entrance roads, operating units, and legal boundaries may differ from the general label shown here. Use the map for orientation, then consult the managing agency for trail, gate, boating, or visitor information.
County Layout and Location
Coffee County lies in Middle Tennessee. Its Census Gazetteer internal point is approximately 35.489° N, 86.078° W; this is a reference point for the county polygon, not a courthouse address or guaranteed geographic center. The land-to-water total shows why the county should be read as a complete jurisdiction rather than only the built-up area around Manchester.
The 429.0 square miles of land support the road and settlement network, while 5.6 square miles of water can include rivers, reservoirs, lakes, and smaller mapped water areas. Water percentage alone does not measure travel difficulty: a narrow river crossing, a reservoir arm, or a steep drainage can affect routes even when the countywide water share is modest.
The county has a predominantly rural county-scale pattern. Manchester concentrates government and services, while smaller communities and farms occupy separate corridors. A sparse label field is therefore not evidence of incomplete mapping; it helps preserve the distinction between settlements and the surrounding countryside.
For regional comparison, trace the boundary against Cannon County, Warren County, Grundy County, Franklin County, Moore County, Bedford County, Rutherford County, then place Manchester and the outer communities. Add I-24, US 41, US 41A only after that framework is fixed. This order keeps neighboring places, shared routes, and edge communities from drifting into the wrong county during classroom, editorial, or planning work.
Local Context
Coffee County was established in 1836, and Manchester serves as the county seat. The historical creation date describes the jurisdiction, while the present map describes a modern network of communities, roads, and landforms. Those two layers should be connected without assuming that today’s largest population or employment center must also be the historic administrative center.
The comparison between Manchester and Tullahoma is especially useful. One establishes county government; the other helps read an outer settlement or travel direction. Adding Hillsboro, Beechgrove prevents the county from being reduced to a seat-to-border diagram and makes the internal pattern clearer.
The population figures also need context. A 2025 estimate of 62,419 does not reveal where new residents live, and a countywide density of about 135.0 people per square mile does not describe every neighborhood. Settlement labels, road access, and physical constraints are the layers that turn those totals into usable geography.
In Coffee County, Old Stone Fort State Archaeological Park, Lakewood Park should be treated as named geographic references, not precise navigation instructions. Shorelines change with water level, roads may cross features at only a few points, and park or management boundaries can be more detailed than the county image. The downloadable map is strongest as a base for annotation and comparison.
Before travel, emergency response, boating, hiking, or property research, confirm current conditions with the relevant county, TDOT, park, or land-management agency. This static file does not update closures, flood stages, bridge limits, fire restrictions, or evacuation orders. Its role is to organize the county-scale relationship among Manchester, roads, boundaries, and terrain.
Ways to Use This Map
- County-seat orientation: mark Manchester first and distinguish it from Tullahoma, Hillsboro, Beechgrove.
- Route study: trace I-24, US 41, US 41A and note where the routes enter or leave the county.
- Physical geography: add Old Stone Fort State Archaeological Park, Lakewood Park before minor roads so terrain and water constraints remain visible.
- Boundary comparison: use different colors for Cannon County, Warren County, Grundy County, Franklin County, Moore County, Bedford County, Rutherford County.
- Population annotation: label 57,889 as the 2020 census and 62,419 as the July 2025 estimate.
- Print workflow: keep one clean A3 copy and use a second copy for route, service-area, or field notes.
A practical annotation order is boundary, seat, outer communities, main roads, water and terrain, then notes. For example, write “Manchester / county seat,” “Tullahoma / secondary orientation point,” and “I-24, US 41, US 41A / principal route references.” This compact notation preserves the map’s readability while making the purpose of each label explicit.
Frequently Asked Questions
Why should Manchester and Tullahoma be read as separate anchors?
Manchester is the county seat, so it establishes the administrative reference. Tullahoma is useful because it points to a different part of the settlement or transportation pattern. Treating both labels as if they had the same function would hide the difference between government location and broader county geography.
Place the two labels first, then compare their relationship with I-24, US 41, US 41A and the county boundary. The result shows whether a route, water feature, ridge, or neighboring county separates their approaches. Exact travel time still requires a current navigation or transportation source.
How do I-24 and the county landscape work together on the map?
The Coffee County route layer identifies the principal travel framework, while Old Stone Fort State Archaeological Park, Lakewood Park explains why that framework bends, narrows, or crosses at selected points. A county map becomes misleading when highways are shown without the rivers, ridges, reservoirs, or lowlands that shape access.
Use the Coffee County static map to identify the corridor and likely crossing points, then check TDOT or the responsible local agency for current conditions. The map does not show every ramp, work zone, seasonal restriction, or low-clearance crossing, and protected-area access may use a smaller road not emphasized at county scale.
What should I verify before using this county map for travel or property research?
Confirm current roads, closures, addresses, parcel boundaries, and access rules with the responsible county, state, or land-management agency. This static reference is designed for county-scale orientation and comparison, not turn-by-turn navigation, emergency routing, surveying, or legal boundary decisions.
Sources
- Tennessee State Library and Archives county fact sheet
- State of Tennessee regional reference
- U.S. Census Bureau TIGER/Line
- U.S. Census Bureau QuickFacts
- U.S. Census Bureau county population estimates
- U.S. Census Bureau Gazetteer Files
Related County Maps
- Bedford County Tennessee map
- Cannon County Tennessee map
- Franklin County Tennessee map
- Grundy County Tennessee map
- Moore County Tennessee map
- Rutherford County Tennessee map
- Warren County Tennessee map
Green Map creates custom-edited map images using open geographic data sources such as geoBoundaries, Natural Earth, OpenStreetMap, and government open data.
These maps are edited visual materials, not raw data files, and are provided for education, documents, presentations, and graphic reference.