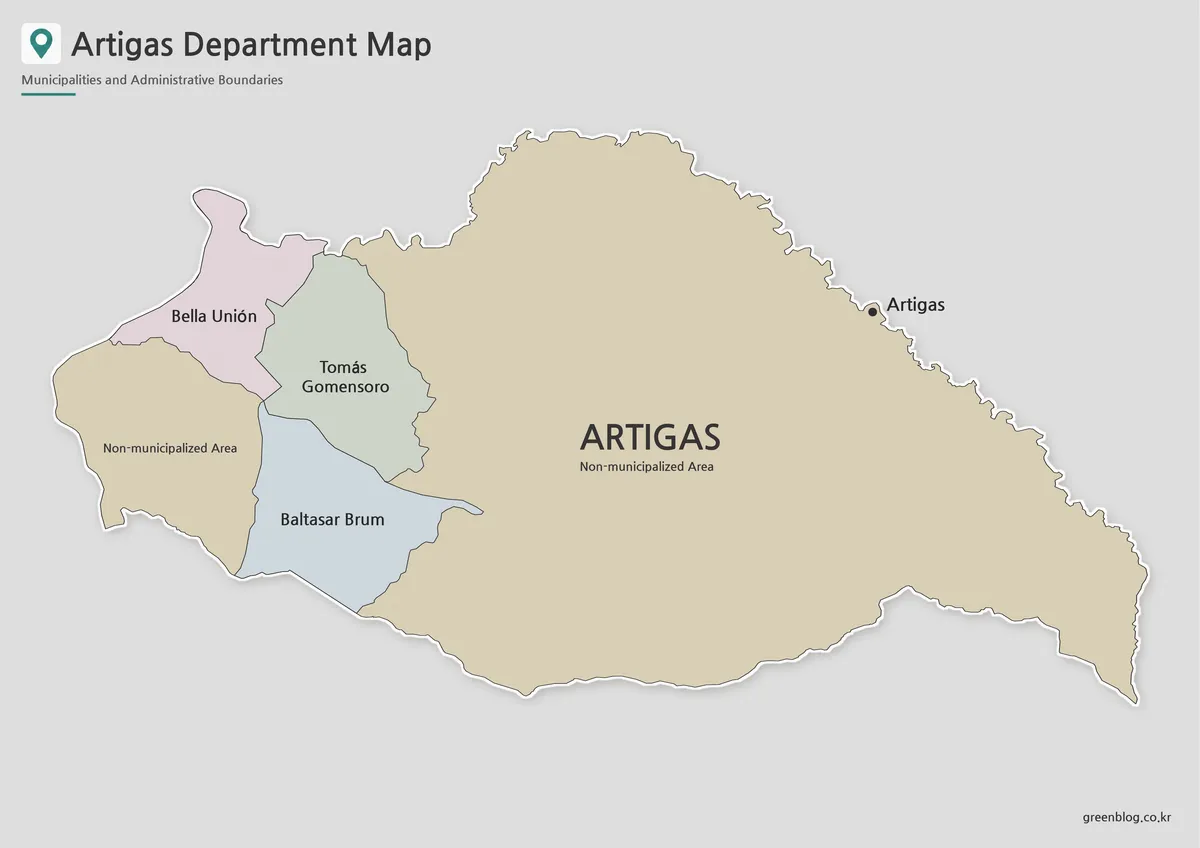
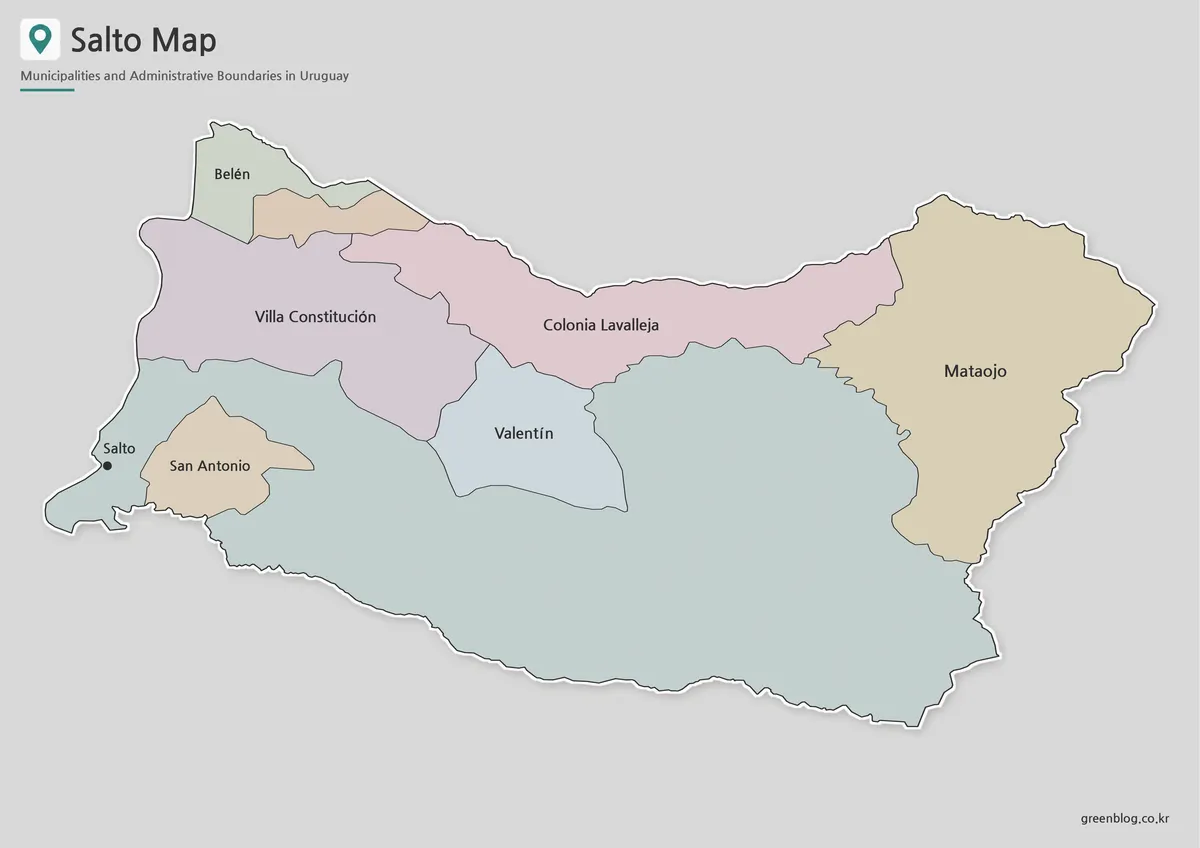
A Tacuarembo map is a practical way to understand the broad inland structure of northern-central Uruguay. Tacuarembó Department covers a large area, with its capital, Tacuarembó, positioned in the north-central part of the region and several municipal centers spread far apart. Paso de los Toros lies to the south, San Gregorio de Polanco sits in the southwest near the reservoir area, Villa Ansina is farther east, and Villa Caraguatá occupies a more remote northeastern location. Because these places do not form one compact urban cluster, a visual reference is far more useful than a simple list of names.
The department borders Rivera, Salto, Paysandú, Río Negro, Durazno, and Cerro Largo. Its northern and eastern sections are shaped by inland plains and rolling terrain, while the southwest is connected with the Río Negro and the Rincón del Bonete reservoir. This combination of wide rural space, distant local centers, and multiple neighboring departments makes the regional layout easy to misread without a map.
The downloadable Tacuarembo map collection includes color, black and white, and outline versions in an A3 layout. The color design supports quick comparison between separated municipalities, the black and white design keeps labels clear for printed documents, and the outline version provides a clean base for custom notes or data. Students, teachers, bloggers, presentation creators, and infographic designers can select the format that best matches their project.
Table of Contents
Reading the Tacuarembo Map Layout
The Tacuarembo map makes the distance between the departmental capital and the four municipal areas immediately visible. Tacuarembó functions as the main administrative center, while Paso de los Toros, San Gregorio de Polanco, Villa Ansina, and Villa Caraguatá are distributed across the south, southwest, east, and northeast.
Paso de los Toros is an important southern city near the Río Negro. San Gregorio de Polanco has a distinctive southwestern position near the reservoir, giving it a different geographic context from the more inland municipalities. Villa Ansina sits southeast of the capital, while Villa Caraguatá represents a more remote rural area in the northeast.
This dispersed pattern is one of the main reasons a departmental map is valuable. It helps readers compare local centers, understand direction, and see how much rural space lies between them.
Color Version for Regional Comparison
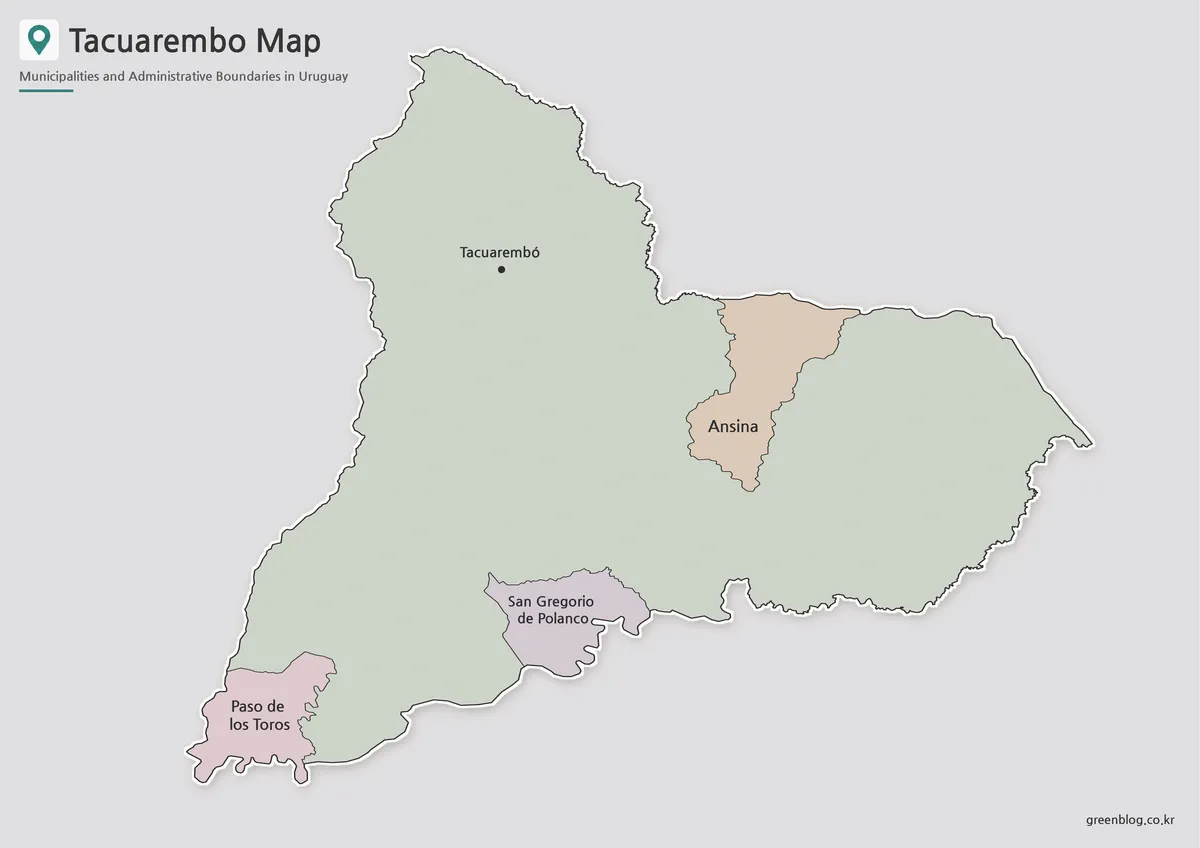
The color Tacuarembo map separates the municipal areas from the larger background of the department. That distinction is especially helpful in a region where the highlighted areas are relatively small compared with the total land area.
The southern position of Paso de los Toros stands out clearly, while San Gregorio de Polanco is easy to identify near the southwest. Villa Ansina and Villa Caraguatá appear farther east, creating a visual contrast between the capital-centered north and the scattered municipal areas beyond it.
For presentation slides or regional comparison graphics, color reduces the time needed to explain where each municipality sits. It also helps readers compare Tacuarembó with neighboring departments whose internal structures may be more compact.
Black and White Version for Printed Documents
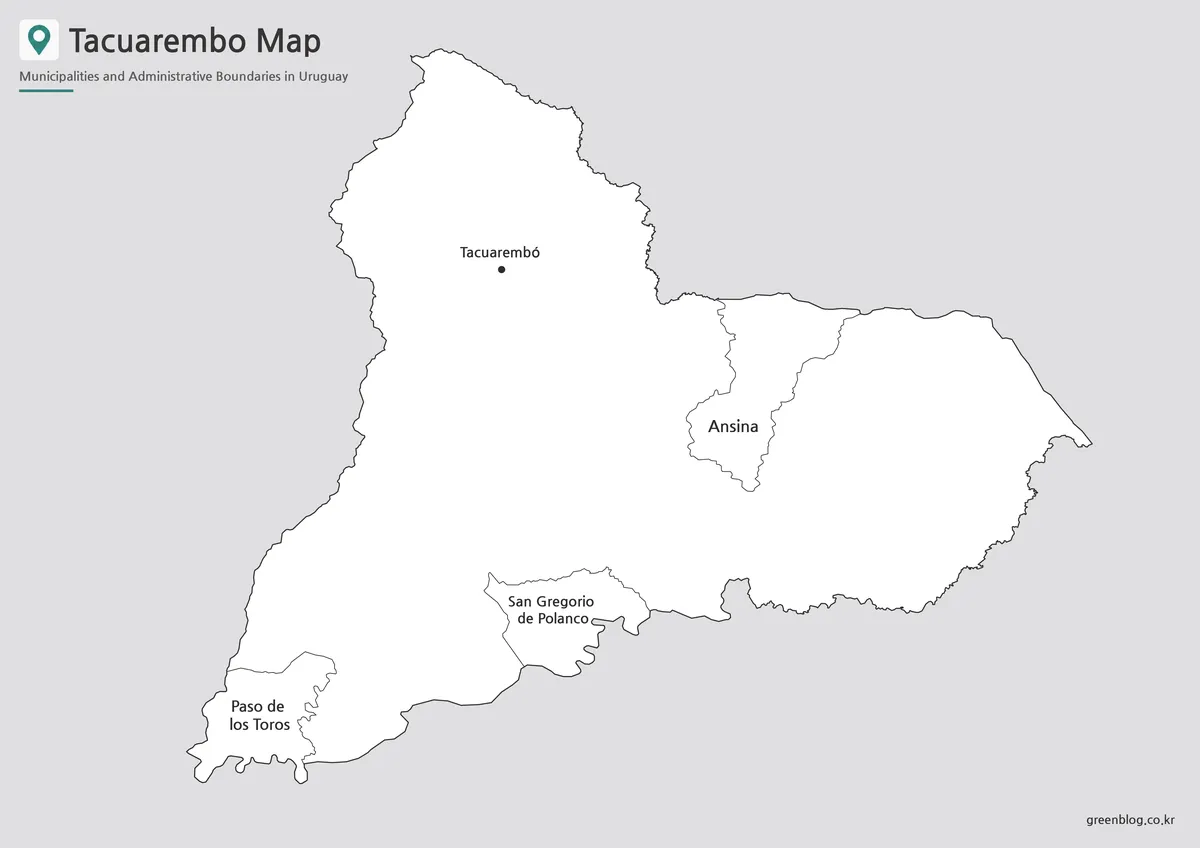
The black and white Tacuarembo map focuses on names and boundary lines rather than color. This cleaner layout works well in reports, classroom handouts, and printed reference sheets where label clarity matters more than visual emphasis.
Because the municipalities are widely separated, the labels have room to remain readable across the page. Tacuarembó, Paso de los Toros, San Gregorio de Polanco, Villa Ansina, and Villa Caraguatá can be identified without relying on a color legend.
The monochrome design also blends naturally into longer documents. It can support a written explanation of northern Uruguay, a school assignment on departmental geography, or a presentation handout comparing inland regions.
Outline Map for Custom Editing
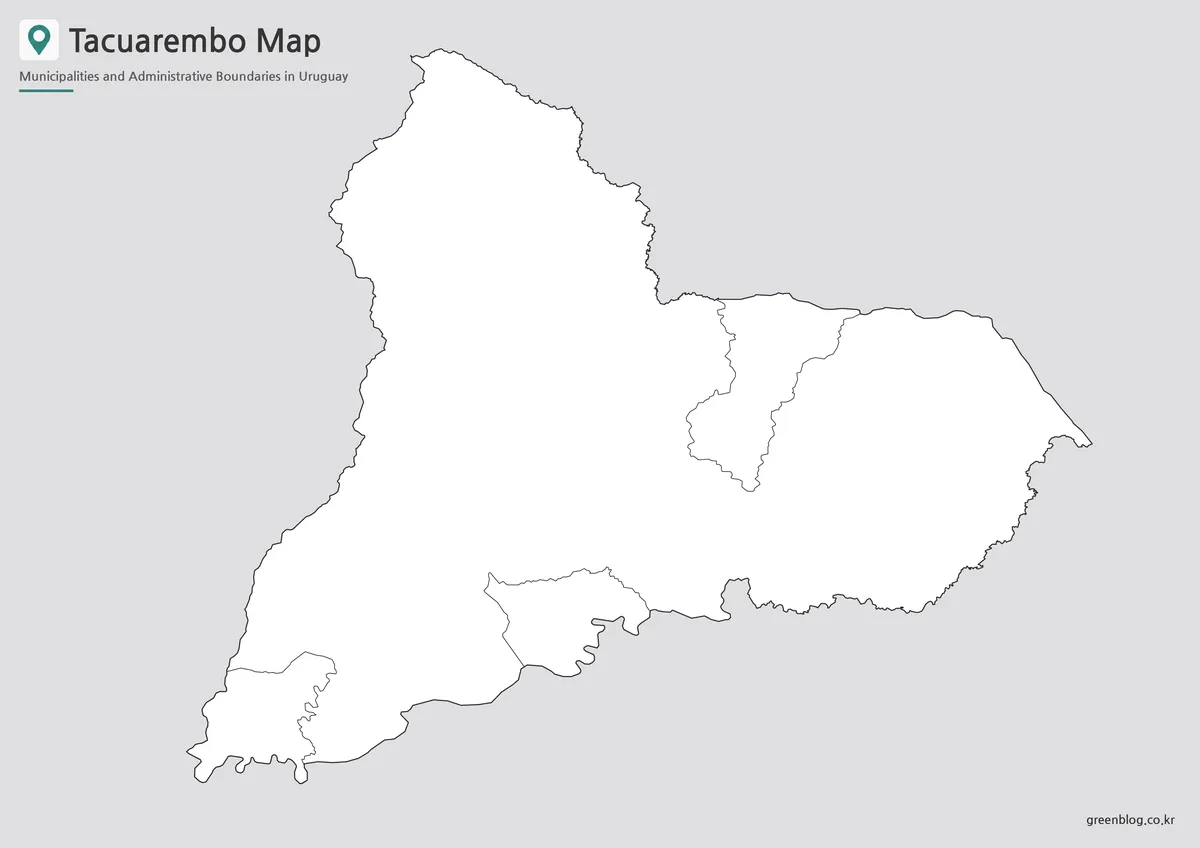
The outline Tacuarembo map keeps the department shape and internal municipal boundaries while removing most visual detail. It works as a base map for users who need to add their own information.
Teachers can turn it into a labeling exercise, while students may add the capital and municipal names by hand. Designers can apply custom colors, mark travel routes, add livestock or forestry data, or create an infographic showing population distribution.
The blank layout is also useful when only one part of the department needs attention. A project can highlight the southern corridor around Paso de los Toros, the reservoir area near San Gregorio de Polanco, or the eastern rural areas without competing with pre-existing labels.
Connections With Neighboring Departments
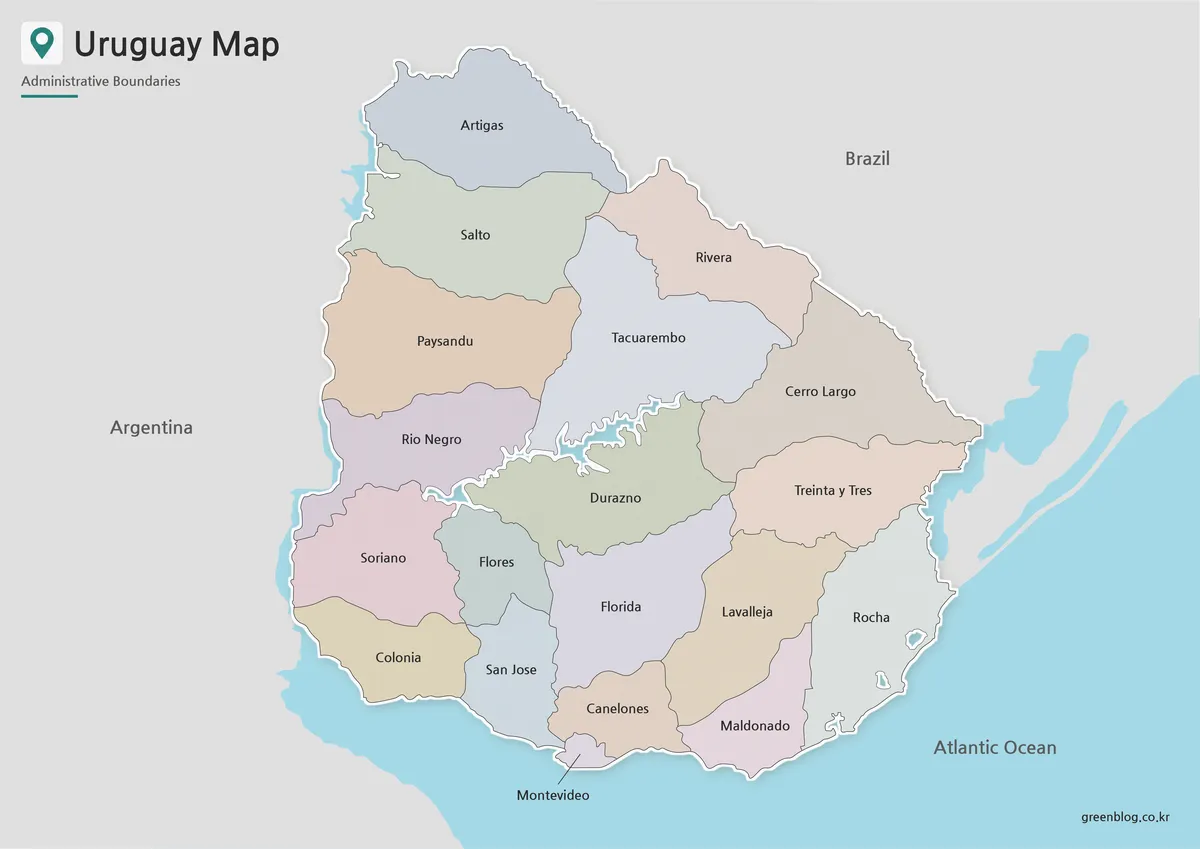
Tacuarembó is linked to a wide set of neighboring regions. Rivera lies to the north, Salto and Paysandú are positioned toward the northwest and west, Río Negro sits to the southwest, Durazno is to the south, and Cerro Largo borders the east.
These connections help explain why the department acts as a bridge between northern and central Uruguay. The Tacuarembo map can support discussions about movement from the capital toward Rivera, the southern route through Paso de los Toros, or the relationship between inland communities and the Río Negro basin.
For regional studies, this context is often more useful than viewing the department in isolation. It shows how administrative boundaries, transport directions, and rural settlement patterns fit into the broader national layout.
Practical Ways to Use the Map Set
A Tacuarembo map works well in classroom projects about Uruguay’s departments. Students can compare the labeled version with the outline version, then identify the capital, municipalities, neighboring departments, and major river areas.
Presentation creators may use the color map to explain how widely the local centers are distributed. The black and white file is suitable for printed reports, while the outline version can be adapted for travel planning, agricultural data, tourism notes, or custom infographic work.
Using all three versions in one project can also create a consistent visual sequence. The color file can introduce the region, the labeled monochrome map can provide reference details, and the blank outline can support an activity or final graphic.
Frequently Asked Questions
Which municipalities are included on the map?
The map highlights Paso de los Toros, San Gregorio de Polanco, Villa Ansina, and Villa Caraguatá. Tacuarembó is shown as the departmental capital.
Where is Tacuarembó Department located?
It is in northern-central Uruguay and borders Rivera, Salto, Paysandú, Río Negro, Durazno, and Cerro Largo.
Which version is best for classroom printing?
The black and white version is best when labels need to remain visible. The outline version is more suitable for coloring, labeling, and student annotations.
Can I add custom information to the outline map?
Yes. Users can add city markers, routes, population data, industry zones, tourism points, or presentation notes.
What does the Tacuarembo map collection include?
It includes color, black and white, and outline map versions designed for printing, classroom reference, presentations, and graphic editing.
Download Information
Map File Information
This download includes printable Tacuarembo map versions for educational use, presentation design, document printing, and editable graphic projects.
- Included Versions: Color map, black and white map, outline map
- Printable Size: A3 layout
- File Type: Image files
- Intended Use: Classroom handouts, presentations, blog graphics, infographic editing, and printable reference materials
Related Maps
- Uruguay Map
- Rivera Department Map
- Salto Department Map
- Paysandú Department Map
- Río Negro Department Map
- Durazno Department Map
Additional Resources
- Tacuarembó Department Government : The official regional website provides information about local government, municipalities, services, and communities across Tacuarembó Department.
Green Map creates custom-edited map images using open geographic data sources such as geoBoundaries, Natural Earth, OpenStreetMap, and government open data. These maps are edited visual materials, not raw data files, and are provided for education, documents, presentations, and graphic reference.