An Alabama map must keep 67 county shapes readable inside a state that is much taller than it is wide. Northern counties form a broad upper band, central boundaries turn into an irregular network, and Mobile and Baldwin extend the map toward the Gulf of Mexico. That change at the bottom makes the state outline immediately recognizable.
This set presents the same county framework in three coordinated versions: a labeled color reference, a labeled black-and-white sheet, and an unlabeled outline. The page previews are 1,200 × 1,531-pixel WebP images, while the protected download is described as containing A3 JPG files. Matching geometry lets a lesson or presentation move from reference to annotation without changing county positions.
Alabama borders Tennessee to the north, Georgia to the east, Florida to the southeast, and Mississippi to the west. Those surrounding states are not labeled in the supplied graphics, and neither are cities, highways, rivers, terrain, or a distance scale. The collection is therefore best used for county orientation, printing, classroom work, and user-added data rather than navigation or physical geography.
Table of Contents
How the Alabama map Organizes 67 Counties
The northern edge begins with counties such as Lauderdale, Limestone, Madison, and Jackson along the Tennessee side. Just below them, names including Colbert, Lawrence, Morgan, Marshall, Franklin, Cullman, DeKalb, and Cherokee form another set of visual anchors. Their generally broad arrangement contrasts with the tighter turns found closer to the center.
Jefferson County sits near the middle of the northern half and provides a useful landmark for locating the Birmingham area, although Birmingham itself is not marked. Madison County can orient readers to Huntsville, and Montgomery County identifies the county containing the state capital without showing a separate capital star. These associations come from outside knowledge; the artwork labels counties only.
Across central Alabama, Tuscaloosa, Bibb, Shelby, Chilton, Coosa, Talladega, and neighboring counties create a less regular pattern than the upper rows. Several boundaries curve or step rather than following simple rectangles. The labeled editions are especially helpful here because shape alone may not be enough for a first-time reader to distinguish adjoining units.
The western edge changes character as it passes Pickens, Greene, Sumter, Marengo, Choctaw, and Washington. On the eastern side, the state line meets a long sequence of counties facing Georgia. This Alabama map does not label either neighboring state, so county names and the state silhouette supply the geographic orientation.
At the Gulf Coast, Mobile County forms the southwestern extension and Baldwin County occupies the southeastern coastal area. Mobile Bay creates the deep blue opening between them in the color preview. No ports, beaches, cities, islands, or waterways are named, but the two-county coastal form gives readers a strong endpoint for scanning the map from north to south.
Color County Map for Boundary Tracking
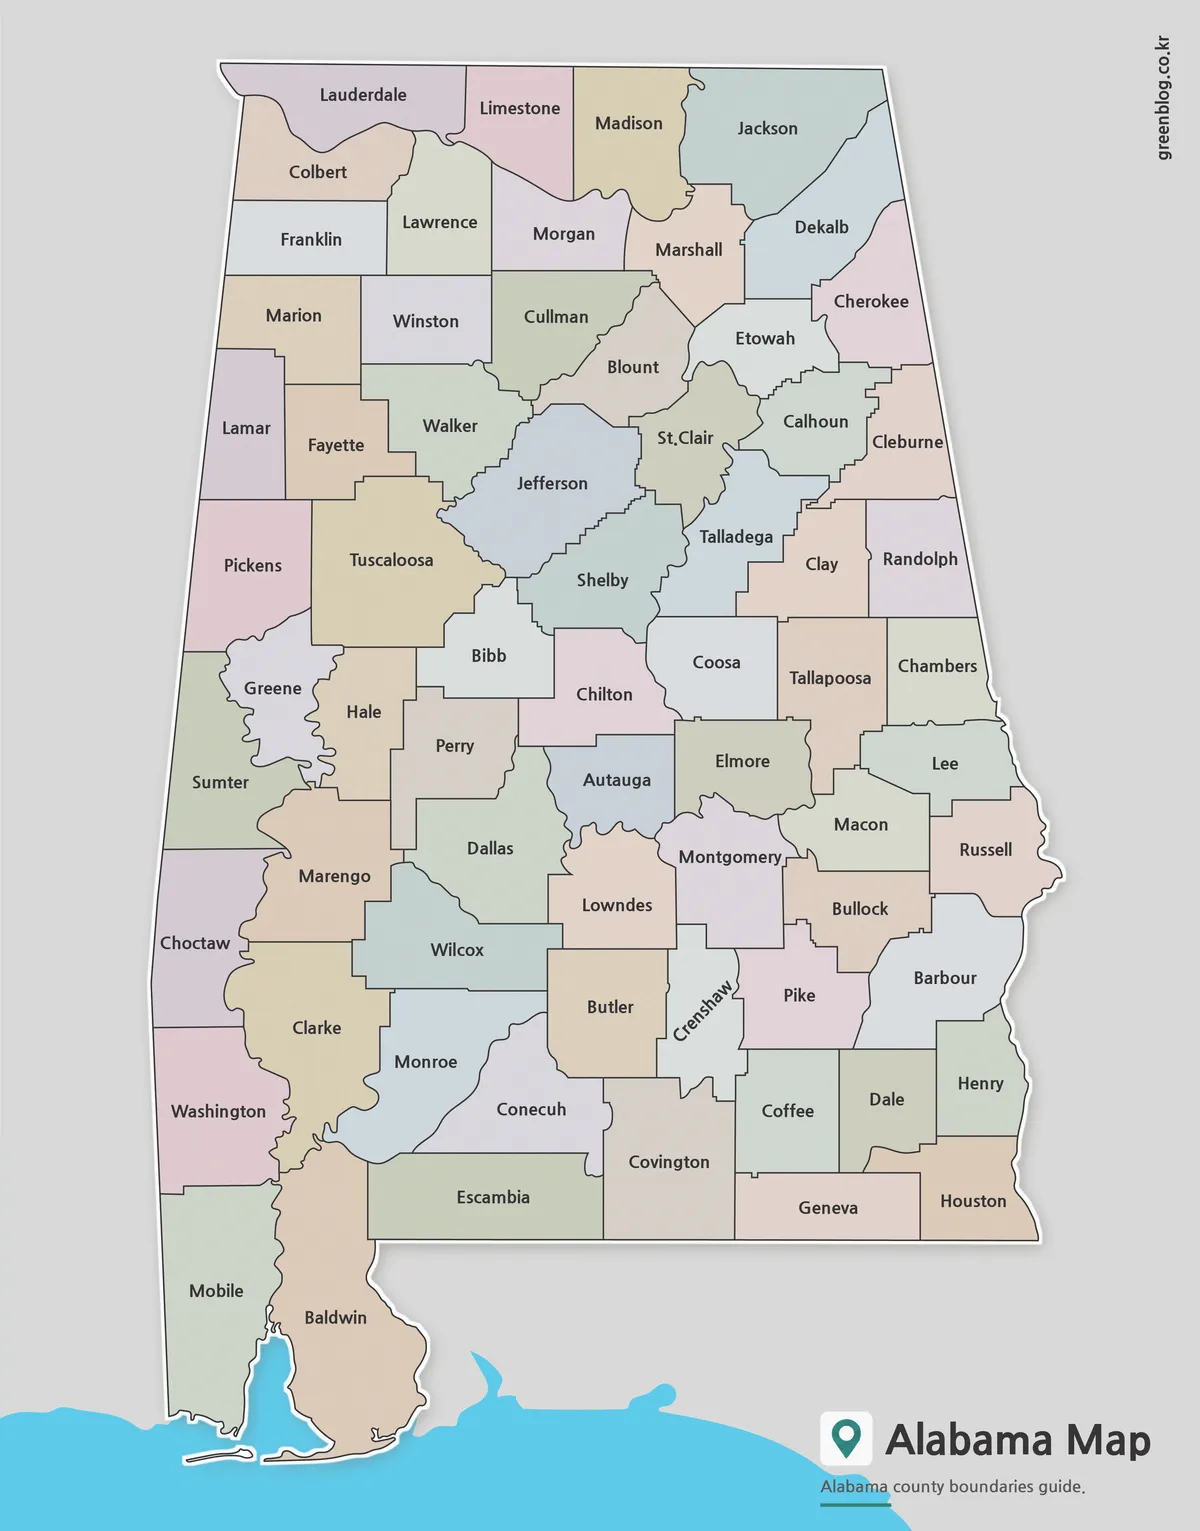
The color Alabama map alternates muted pink, tan, blue-gray, and green fills so counties sharing a border remain visually separate. This treatment is most valuable around Jefferson, Shelby, St. Clair, Talladega, Bibb, and Chilton, where multiple irregular shapes meet. Labels remain the primary reference layer, while color helps the eye follow each outline.
The palette is categorical rather than thematic. It does not encode population, politics, elevation, land cover, income, or any other measurement. If a presentation adds values, create a new legend with a source date and units so readers do not interpret the original pastel colors as part of the added dataset.
Choose this version for an introductory slide, a county-location lesson, or an answer key beside a blank exercise. A presenter can follow counties bordering Tennessee, trace the Georgia side, compare central clusters, or finish with Mobile and Baldwin. The gray exterior and blue coastal water keep the long state form distinct from the page.
Labeled Black-and-White Version for Documents
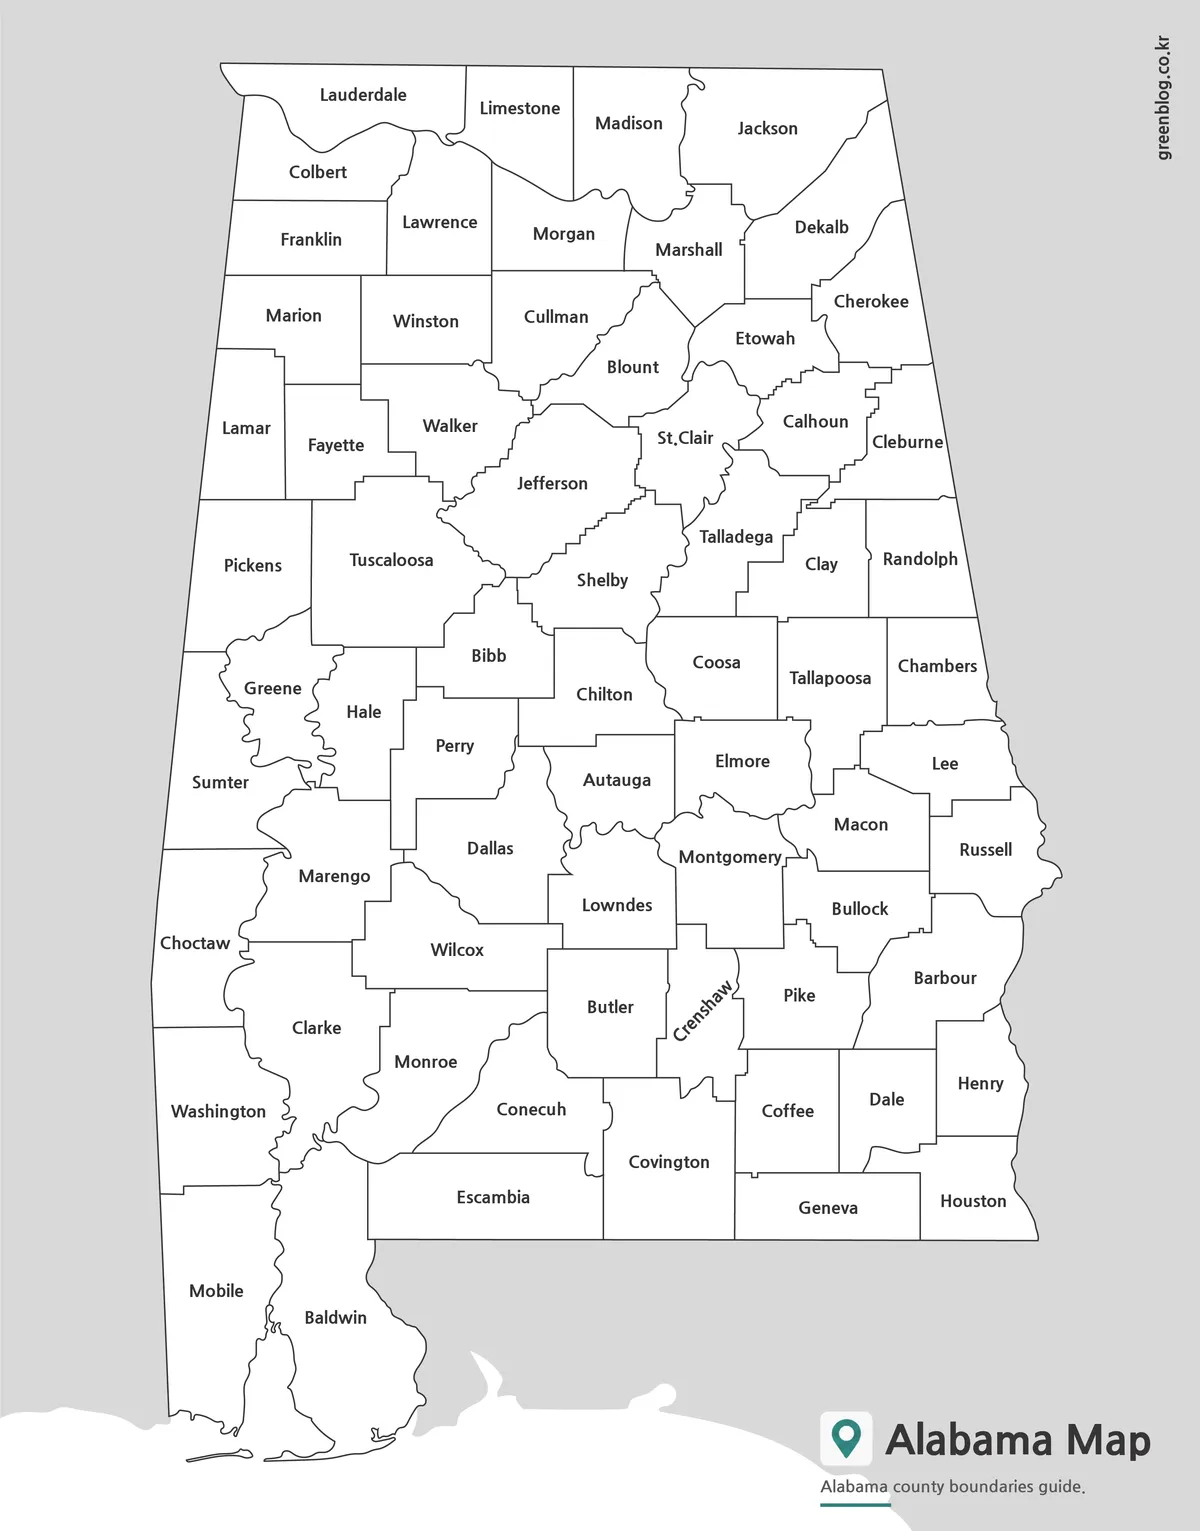
The monochrome Alabama map retains every county name and boundary while removing the pastel fills and blue water. Black lines and white interiors fit reports, worksheets, study packets, and documents that already use their own color system. Readers do not need color to identify any county.
This sheet works as a reference rather than a recall test because all 67 names remain visible. It can sit beside a county table, support a guided state-history lesson, or help learners check a completed blank map. Short notes or underlining can be added, but dense overlays may compete with the printed labels.
Before producing many copies, print one proof and inspect narrow labels, curved western boundaries, the counties around Montgomery, and the coastal lines. Preserve the tall aspect ratio and use proportional fitting on smaller paper. Cropping can remove the northern edge, Mobile and Baldwin, or the title area.
Blank County Outline for Labeling and Data
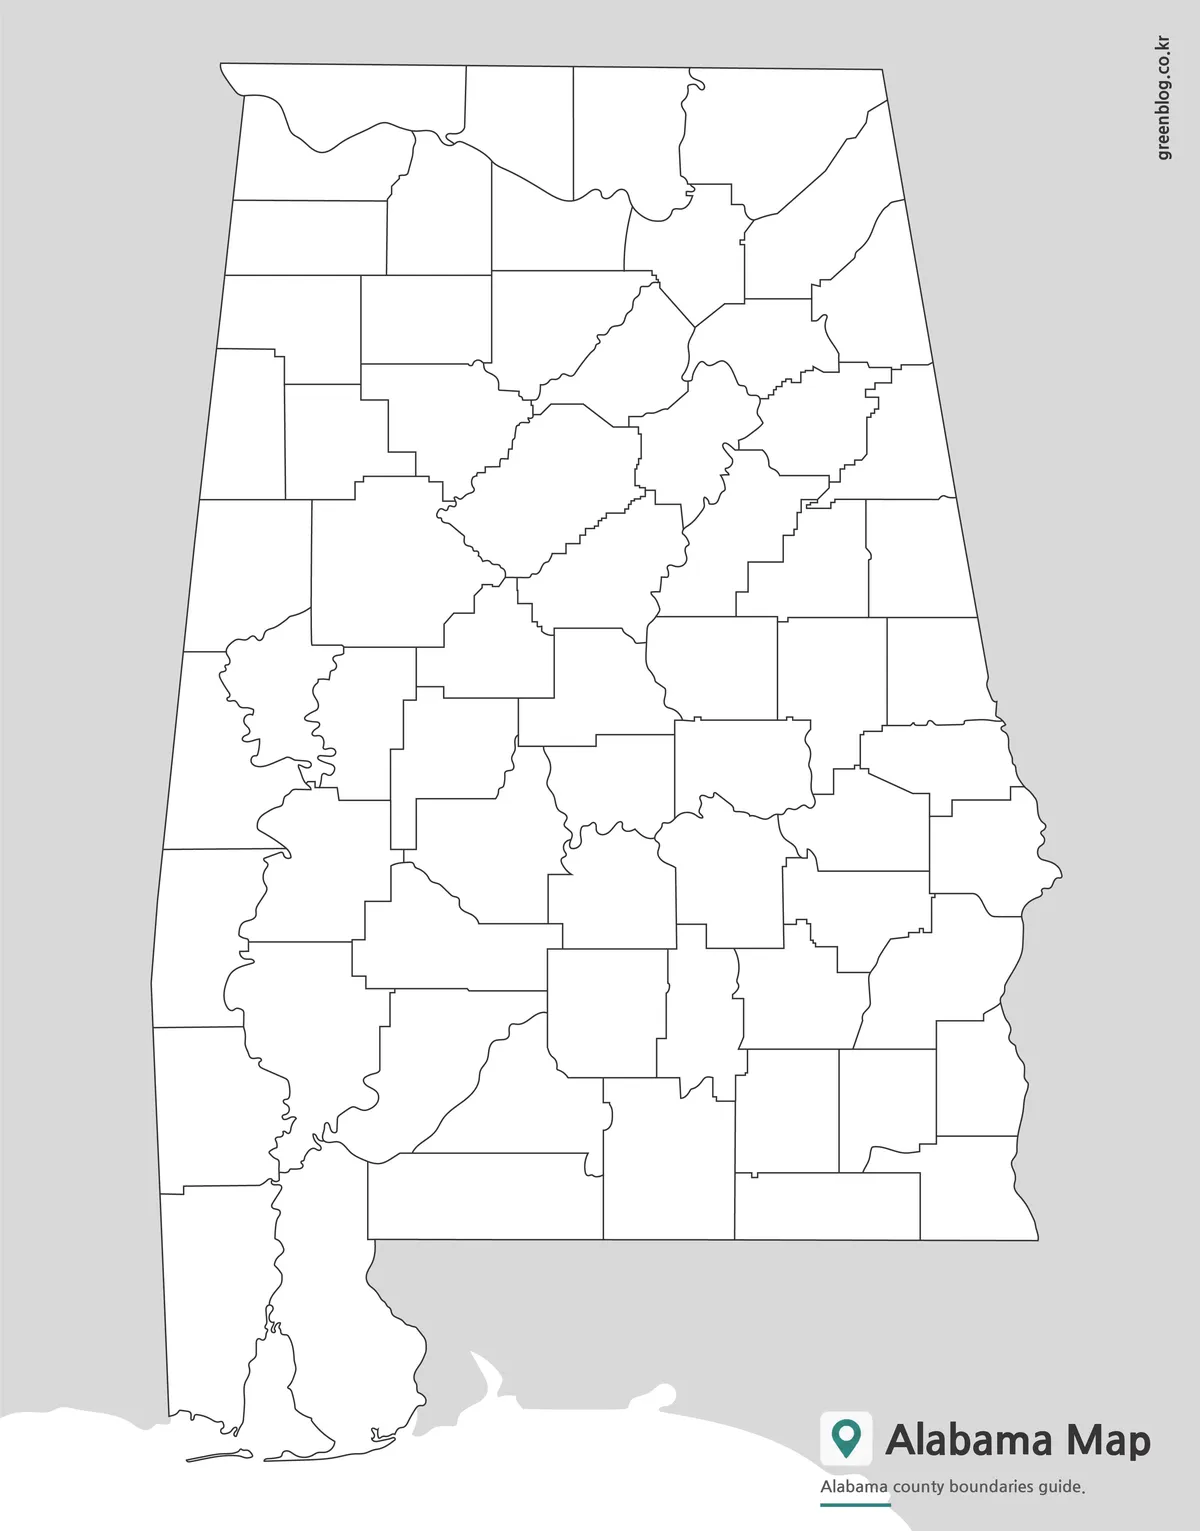
The blank Alabama map removes county names and fills while preserving the full 67-county boundary network. Students can label selected counties or complete the entire state, while designers can add regional groupings, numbered locations, service areas, or sourced statistics without first covering existing text.
A concrete classroom task can begin with four anchors: Madison in the north, Jefferson in the north-central area, Montgomery farther south, and Mobile at the coast. Learners can then fill outward through neighboring counties. Another exercise can separate Gulf counties, state-border counties, and interior counties using a new color key.
The downloadable asset is described as a JPG, not a vector or layered geographic source. “Editable” means users can annotate a raster copy in image, slide, or document software. Keep an untouched file, work near the intended output size, and use a proper GIS dataset for precise measurement, boundary analysis, or automated data joins.
Choosing a Version by Reader Task
Select color when adjoining counties must separate immediately on screen, monochrome when names need to remain available in a restrained printed document, and outline when users should supply labels or data. The three files can also form a sequence: introduce the pattern in color, review names in monochrome, and finish with independent work on the outline.
- County reference: use either labeled edition to find names and compare neighboring shapes.
- Classroom assessment: use the outline for identification, matching, or regional coloring.
- Presentation: use color when the full pattern must remain legible at a glance.
- Report: use monochrome when the surrounding document does not depend on color.
Preparing the Files for Print and Projects
The A3 layout gives the vertical state enough room for county labels and the narrow coastal extension. When preparing an Alabama map for a smaller page, scale it proportionally and check label size before printing. For slides, leave enough height for the complete silhouette instead of cutting off the coast to enlarge central counties.
Any added thematic layer should include a title that identifies the subject, a legend, units where applicable, a source, and the data year. Election results, population, service coverage, and economic measures can change even when county boundaries appear stable. The original county colors should be replaced or clearly separated from a new classification.
These maps do not substitute for a road map, city map, terrain map, hydrographic map, or current legal boundary dataset. Their strength is a clean and consistent county framework. Keeping that purpose narrow makes the files useful across lessons, reference sheets, presentations, and annotation projects without overstating what they contain.
Frequently Asked Questions
What versions are included in this Alabama map collection?
The collection includes a color county map, a black and white labeled map, and a blank outline map.
Can I print the Alabama map in A3 size?
Yes. The maps are prepared for A3 high-resolution printing.
Is the outline Alabama map editable?
Yes. The blank outline version is useful for editing, coloring, data labeling, and infographic projects.
What file format is provided?
The map files are provided in JPG format.
Who is this map useful for?
It is useful for students, teachers, bloggers, presentation creators, designers, and anyone preparing regional reference materials.
Map File Information
The ZIP archive contains three coordinated Alabama county maps for reference, printing, and annotation.
- Included Versions: Color labeled, black-and-white labeled, and blank outline maps
- Printable Size: A3 high resolution
- File Type: JPG
- Intended Use: County reference, classroom work, presentations, printing, and annotation
Related Maps
Additional Resources
- Alabama Department of Archives and History: Fast Facts — Review official state background, including Alabama’s 67-county framework.
Green Map creates custom-edited map images using open geographic data sources such as geoBoundaries, Natural Earth, OpenStreetMap, and government open data.
These maps are edited visual materials, not raw data files, and are provided for education, documents, presentations, and graphic reference.