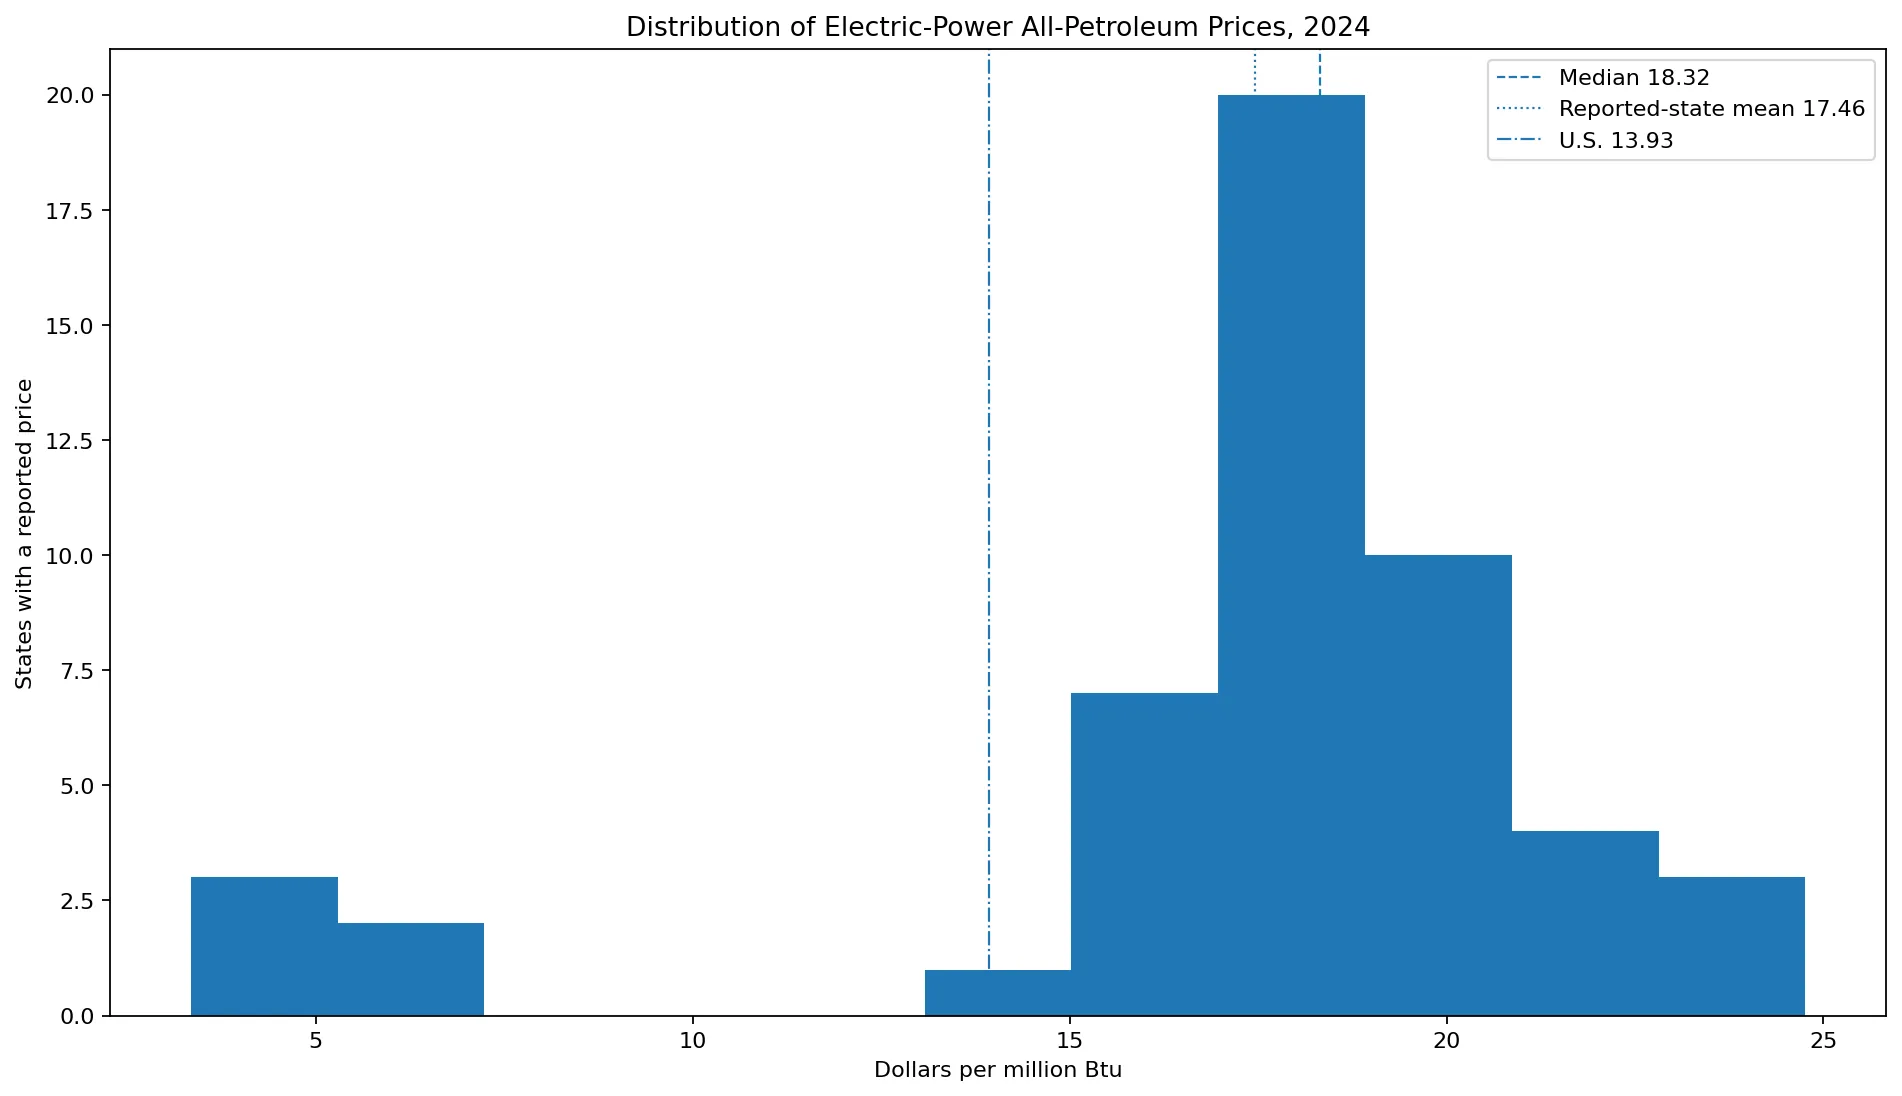
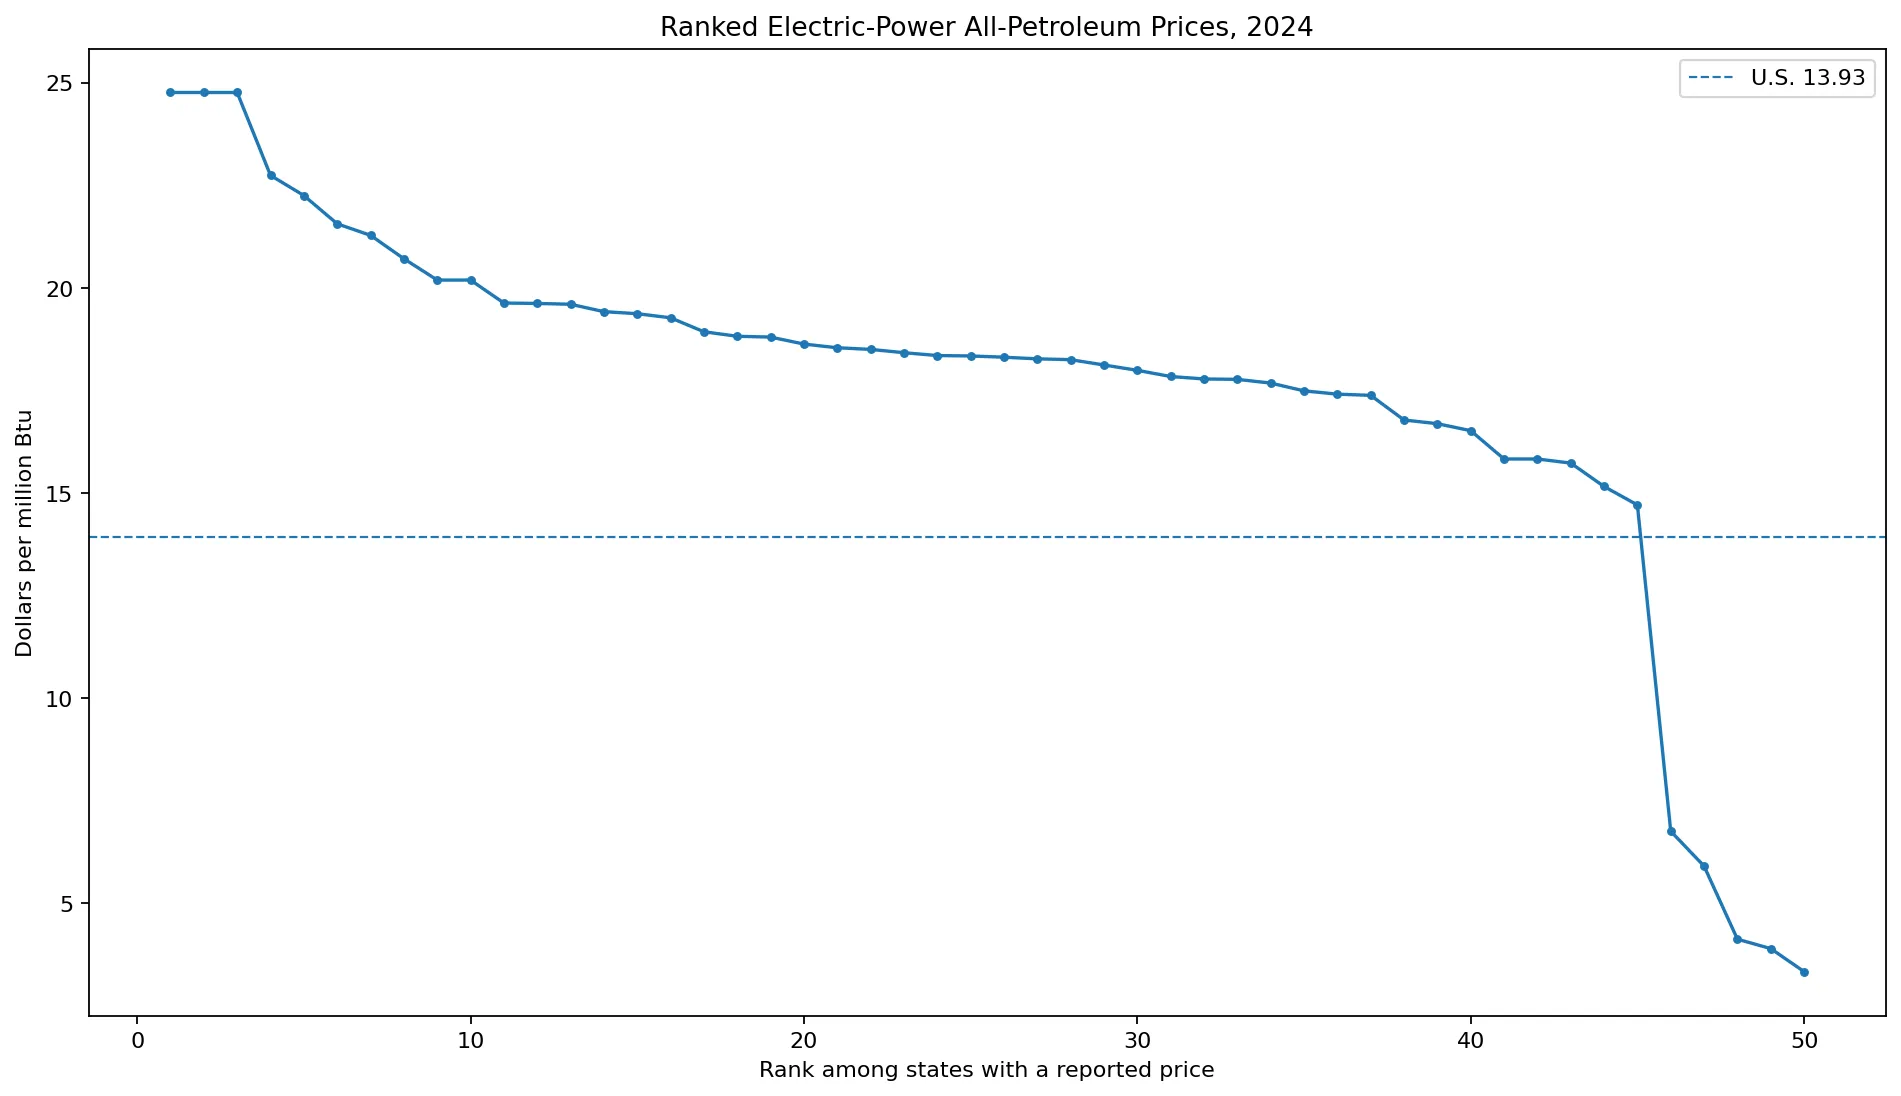
Average petroleum-product prices in the U.S. electric power sector varied sharply by state in 2024. California, Oregon, and Washington tied for the highest reported value at $24.76 per million Btu. Nevada followed at $22.74, Georgia at $22.25, and Arizona at $21.56. Michigan had the lowest positive state value at $3.34/MMBtu. Across the 50 states with a numerical price, the unweighted mean was about $17.46 and the median was $18.33, while EIA’s U.S. electric-power all-petroleum price was $13.93/MMBtu.
The Total petroleum price is a consumption-weighted average across the petroleum products used by the electric power sector, not a simple mean of product prices. In EIA Table E7, the 2024 petroleum columns are distillate fuel oil, petroleum coke, residual fuel oil, and Total. The PAEID variable divides electric-power petroleum expenditures by electric-power petroleum energy consumption and converts the result to dollars per million Btu.
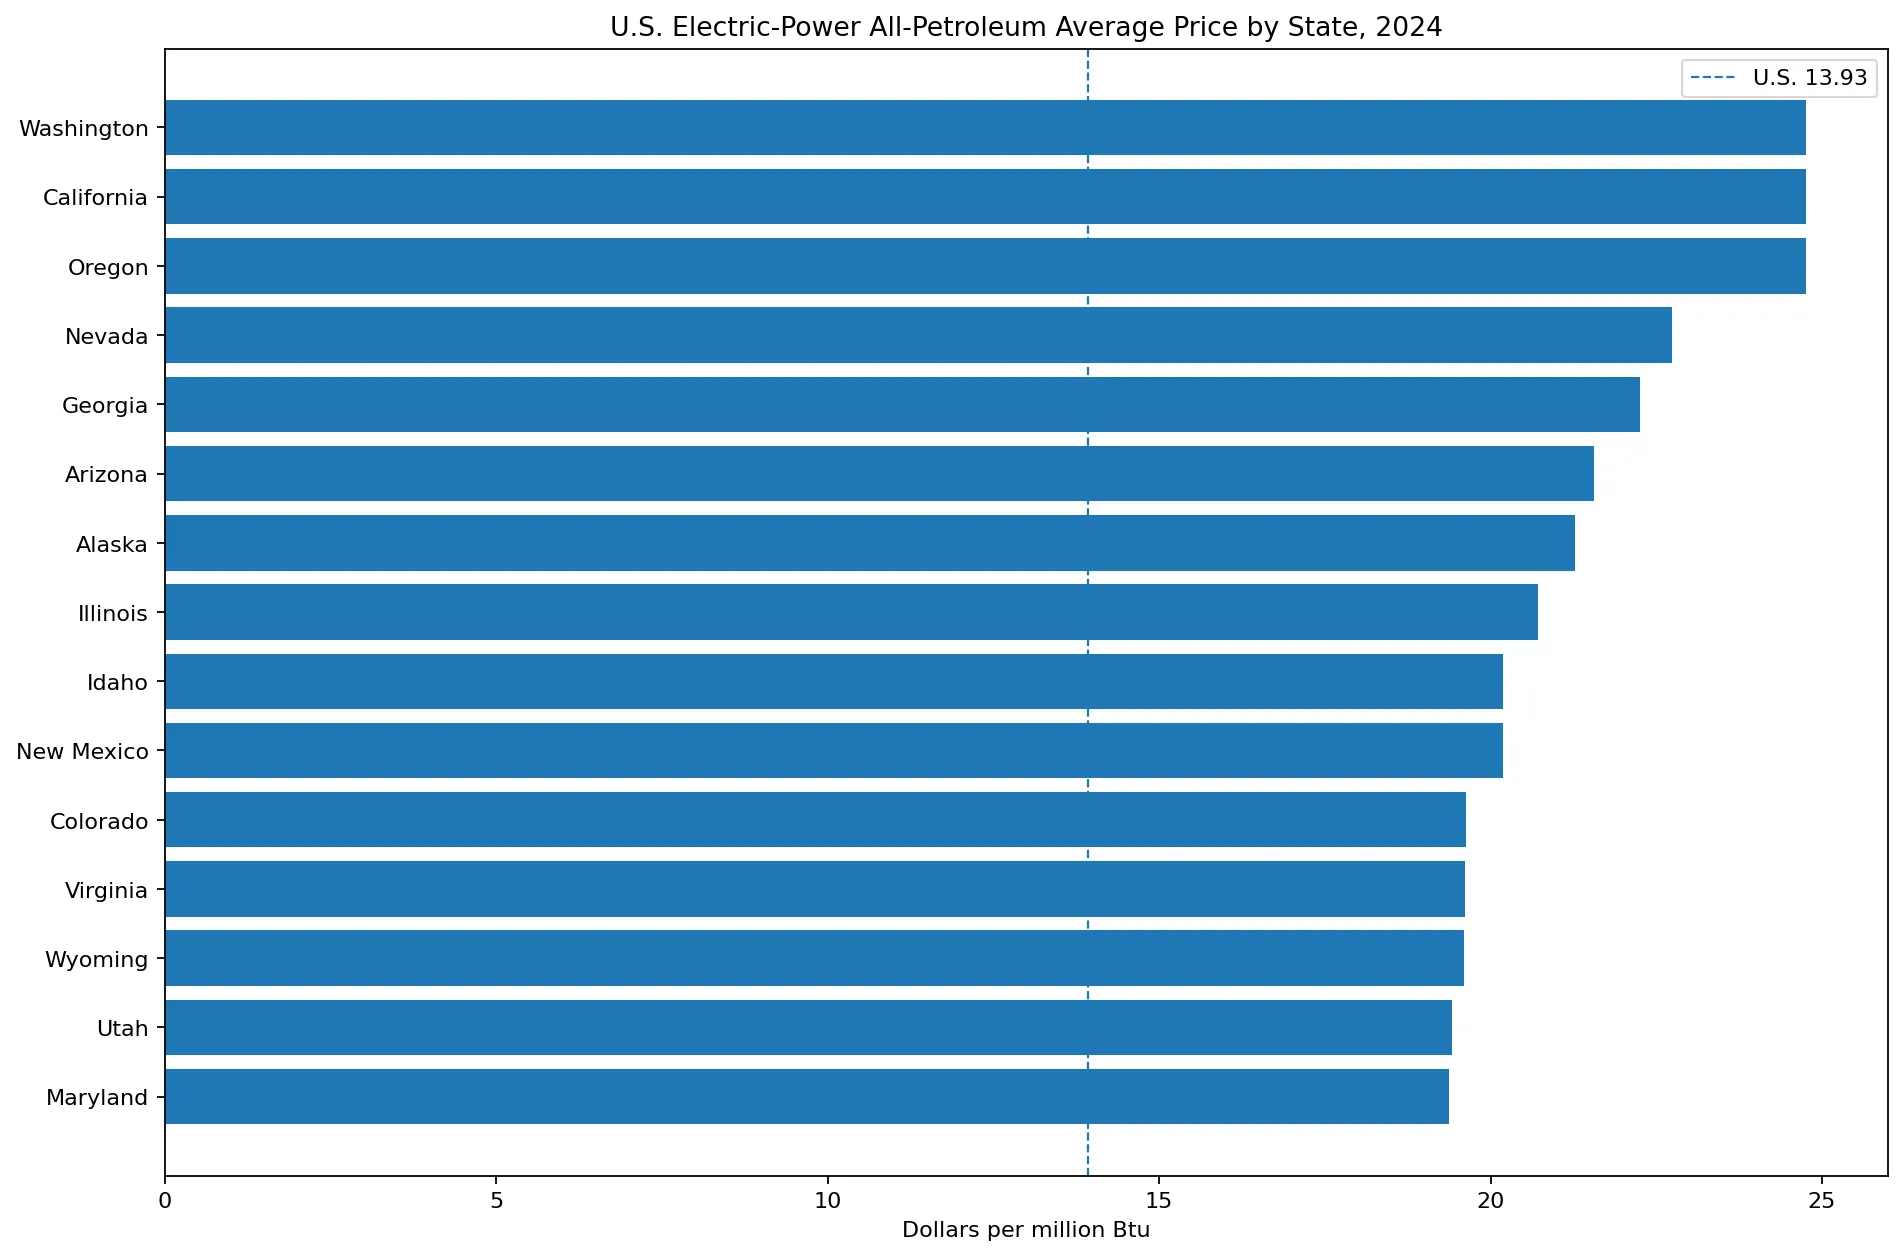
Table of Contents
What the electric-power all-petroleum price measures
EIA defines the electric power sector here as electricity-only and combined-heat-and-power plants in NAICS 22 whose primary business is to sell electricity, or electricity and heat, to the public. The series therefore describes fuel prices for the public-facing electric power industry rather than every industrial facility that happens to generate electricity for its own use.
In the 2024 Table E7 structure, petroleum in the electric power sector consists of distillate fuel oil, petroleum coke, and residual fuel oil. The long-run DKEID series is labeled distillate fuel oil and historically includes kerosene-type jet fuel before 2001. PCEID is the petroleum-coke price, RFEID is the residual-fuel-oil price, and PAEID is the combined all-petroleum price.
The weights matter. A state that burns a large amount of low-priced petroleum coke can have a Total price far below its distillate fuel oil price. A state using only distillate fuel oil can have a Total exactly equal to the distillate price. PAEID therefore reveals the effective cost of the state’s petroleum fuel mix rather than the typical price of one petroleum product.
California, Oregon, and Washington tie at $24.76/MMBtu
California, Oregon, and Washington all record $24.76/MMBtu. In Table E7, their Total petroleum prices match their distillate fuel oil prices, and no numerical petroleum-coke or residual-fuel-oil price is shown for those states in 2024. Their combined petroleum price therefore reflects a relatively simple petroleum fuel mix in the table.
Nevada is next at $22.74, Georgia at $22.25, Arizona at $21.56, and Alaska at $21.28. Illinois is $20.71, while Idaho and New Mexico are both $20.19. Much of the upper half of the distribution is associated with states whose Total is dominated by distillate fuel oil.
A high petroleum fuel price does not imply that petroleum dominates the state’s electricity generation. A state may use only small quantities of oil for peaking, backup, emergency generation, or limited units. To evaluate dependence on petroleum, fuel consumption or fuel-specific net generation must be compared with the state’s total power-sector energy use.
Michigan, Montana, and Ohio are below $5/MMBtu
Michigan has the lowest positive Total at $3.34/MMBtu. Montana follows at $3.90, Ohio at $4.13, Louisiana at $5.91, and Florida at $6.76. After those five, the next value jumps to Massachusetts at $14.71, creating a distinct low-price group.
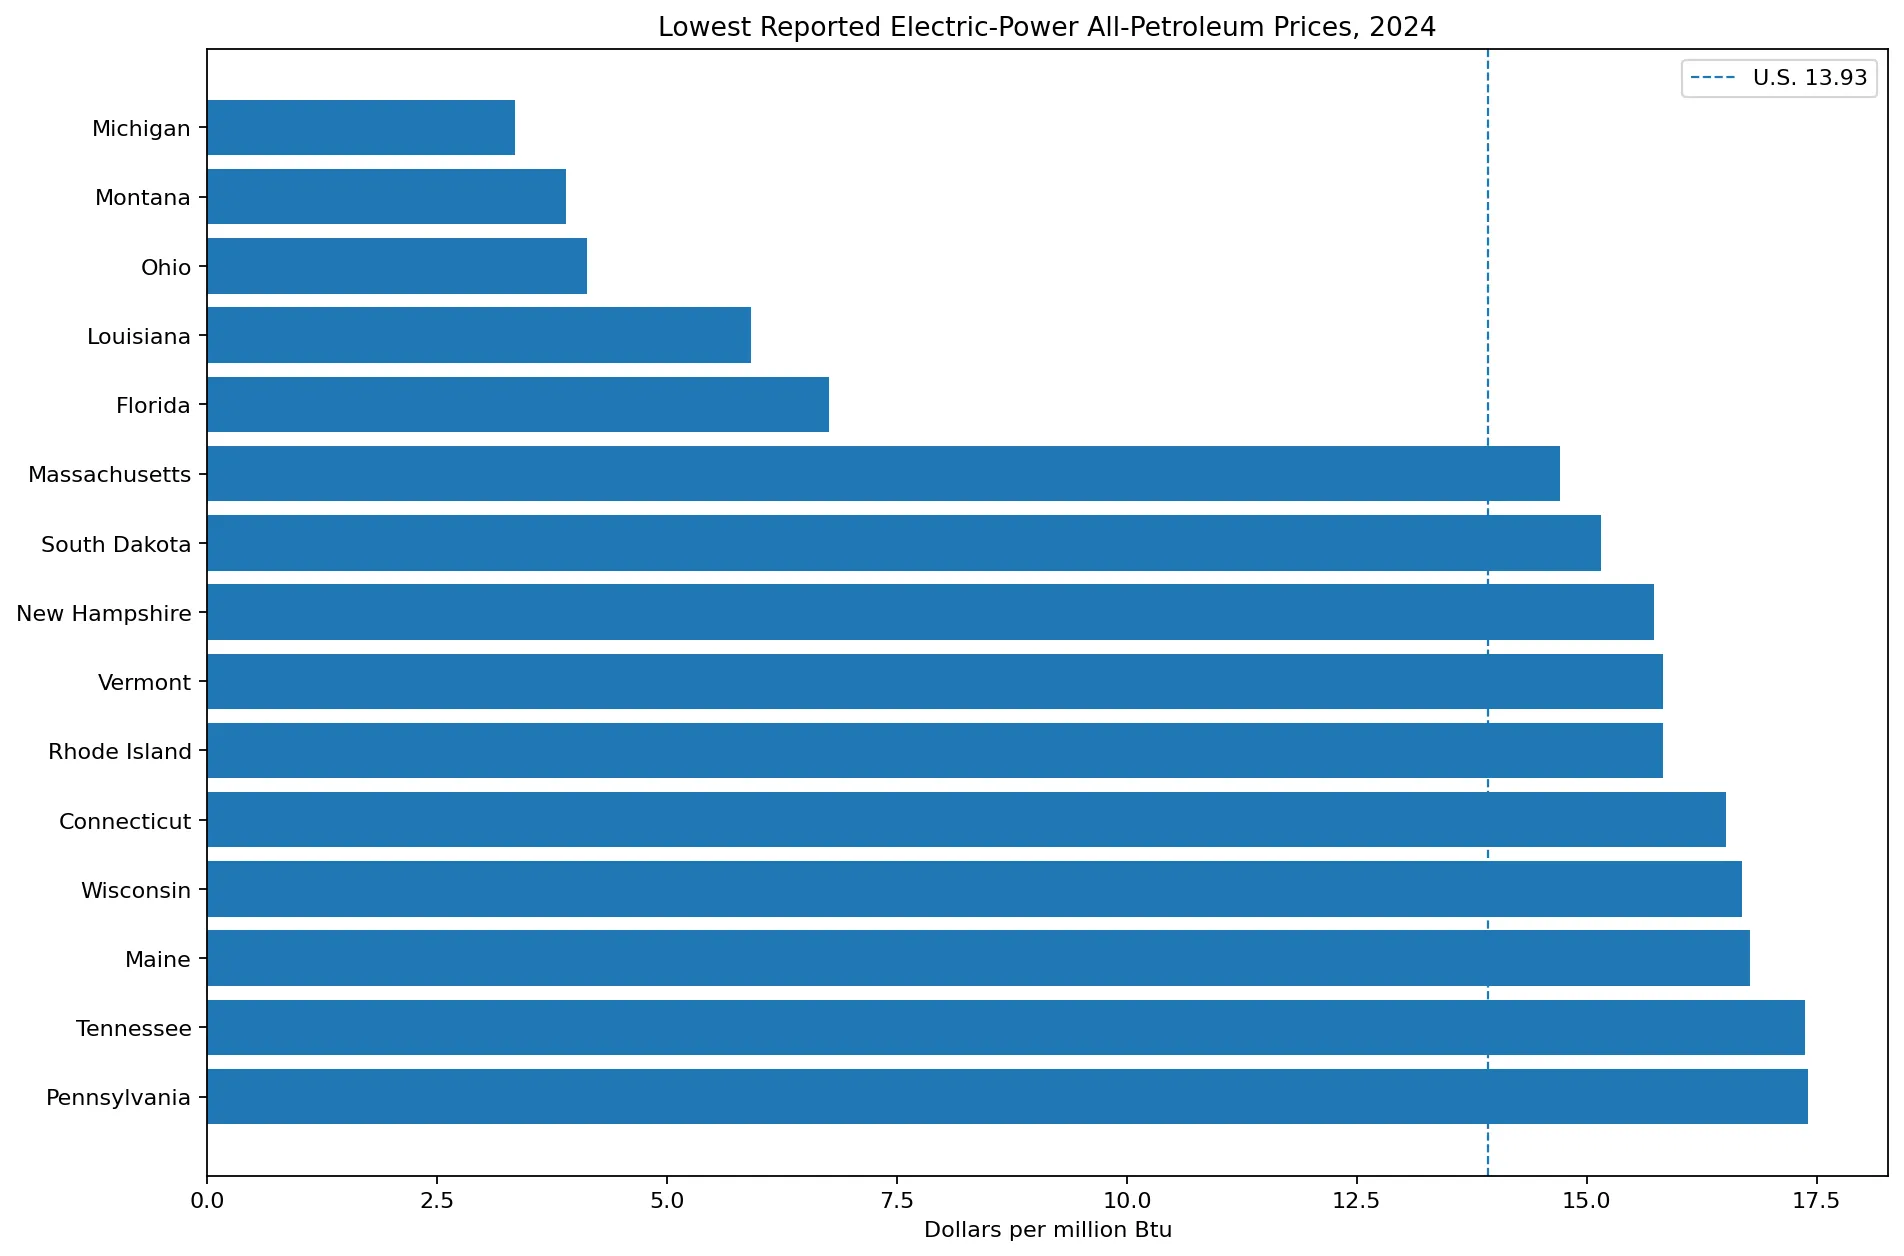
Michigan illustrates why PAEID is a weighted average. Table E7 shows distillate fuel oil at $17.62/MMBtu, petroleum coke at $2.63, and residual fuel oil at $10.73, yet the Total petroleum price is only $3.34. A simple mean of the three component prices would be near $10, so the published Total indicates that low-priced petroleum coke carries a very large weight in Michigan’s electric-power petroleum consumption.
Montana shows a similar pattern: distillate fuel oil is $20.32 and petroleum coke $3.34, while Total is $3.90. Ohio has distillate at $18.23 and petroleum coke at $2.63, but Total is $4.13. Louisiana’s distillate price is $16.53 and petroleum coke $3.34, producing a Total of $5.91. These examples make the consumption-weighted structure visible.
Florida shows why product mix can matter more than individual prices
Florida has numerical prices for all three petroleum components: distillate fuel oil at $19.72/MMBtu, petroleum coke at $3.64, and residual fuel oil at $13.82. Its Total petroleum price is only $6.76. The simple arithmetic mean of those three component prices is about $12.39, almost twice the published Total.
The difference exists because EIA does not average the component prices equally. The actual energy quantities and expenditures determine the weight of each product. If petroleum coke provides a large share of petroleum energy input, its much lower price can pull the state Total down sharply.
Connecticut is a useful contrast. Its distillate price is $15.83 and residual fuel oil price $16.79, while Total is $16.52. New York has $17.49 distillate, $18.70 residual fuel oil, and an $18.31 Total. When component prices are close, the exact consumption weights have less effect on the combined price.
Why the U.S. price is below the simple state average
The arithmetic mean of the 50 numerical state prices is about $17.46/MMBtu and the median is $18.33. EIA’s U.S. PAEID value is only $13.93. The difference is not an inconsistency. The national price is calculated from U.S. electric-power petroleum expenditures divided by U.S. electric-power petroleum consumption.
Table E7 reports U.S. distillate fuel oil at $19.44, petroleum coke at $2.89, residual fuel oil at $17.52, and Total petroleum at $13.93. The low petroleum-coke price and its national consumption weight pull the combined result below both distillate and residual fuel oil prices.
State consumption weights matter as well. A high-price state with very little petroleum use contributes much less to the U.S. average than it does to a one-state-one-vote arithmetic mean. That is why 45 of the 50 reported state prices can sit above the U.S. value while the national weighted price remains $13.93.
The District of Columbia does not have a $0 petroleum price
The District of Columbia appears as 0.00 in the state data slice, but EIA Table E7 displays a dash for its electric-power fuel prices. The footnote defines the dash as no consumption. D.C. should therefore be treated as having no comparable 2024 electric-power petroleum price, not as purchasing petroleum fuel for zero dollars.
This distinction matters for rankings and charts. Plotting D.C. at $0 would create a false minimum and distort the distribution. The table in this article keeps D.C. in the 51-jurisdiction coverage but shows a dash and no-consumption status rather than assigning a price rank.
Most reported state prices cluster in the upper teens
The first quartile among the 50 reported states is about $16.93/MMBtu and the third quartile about $19.56. Half of the state observations therefore fit inside a relatively narrow band of roughly $2.63. The full range looks much wider mainly because Michigan, Montana, Ohio, Louisiana, and Florida form a very low tail.
Forty-five reported states are above the U.S. $13.93 value and only five are below it. Counting states alone would therefore give a misleading impression of the national price. The U.S. value reflects quantities consumed, and states with low-priced petroleum coke can have disproportionate influence if their petroleum consumption is substantial.
Price is different from petroleum generation share
PAEID is a price metric. It does not tell us how much petroleum a state burns or what share of electricity comes from oil. A state can have a high $/MMBtu price and use almost no petroleum, while another can have a low weighted price and consume a much larger quantity of petroleum coke or fuel oil.
A petroleum-dependence analysis should use electric-power petroleum consumption such as PAEIB or fuel-specific generation and compare it with total electric-power consumption or net generation. Expenditures require both price and quantity. Keeping price, consumption, generation, and expenditure separate prevents misleading conclusions.
Official EIA references
EIA Table E7 reports 2024 electric-power prices for coal, natural gas, distillate fuel oil, petroleum coke, residual fuel oil, Total petroleum, nuclear fuel, biomass, and other energy categories. It reports a U.S. Total petroleum price of $13.93/MMBtu and identifies the District of Columbia as no consumption.
The 2024 SEDS price and expenditure variable definitions define PAEID as all petroleum products average price in the electric power sector and give the formula PAEID = PAEIV / PAEIB × 1000. PAEIV is defined from distillate-fuel-related, petroleum-coke, and residual-fuel-oil electric-power expenditures.
All 51 jurisdictions in 2024
The table below includes the 50 states and the District of Columbia. Only the 50 states with a numerical 2024 petroleum price receive a rank. D.C. is retained with a dash and no-consumption status.
| Rank | State | Code | Year | $/MMBtu | Status |
|---|---|---|---|---|---|
| 1 | California | CA | 2024 | 24.76 | Price reported |
| 2 | Oregon | OR | 2024 | 24.76 | Price reported |
| 3 | Washington | WA | 2024 | 24.76 | Price reported |
| 4 | Nevada | NV | 2024 | 22.74 | Price reported |
| 5 | Georgia | GA | 2024 | 22.25 | Price reported |
| 6 | Arizona | AZ | 2024 | 21.56 | Price reported |
| 7 | Alaska | AK | 2024 | 21.28 | Price reported |
| 8 | Illinois | IL | 2024 | 20.71 | Price reported |
| 9 | Idaho | ID | 2024 | 20.19 | Price reported |
| 10 | New Mexico | NM | 2024 | 20.19 | Price reported |
| 11 | Colorado | CO | 2024 | 19.63 | Price reported |
| 12 | Virginia | VA | 2024 | 19.62 | Price reported |
| 13 | Wyoming | WY | 2024 | 19.60 | Price reported |
| 14 | Utah | UT | 2024 | 19.42 | Price reported |
| 15 | Maryland | MD | 2024 | 19.37 | Price reported |
| 16 | Alabama | AL | 2024 | 19.27 | Price reported |
| 17 | North Dakota | ND | 2024 | 18.93 | Price reported |
| 18 | Texas | TX | 2024 | 18.82 | Price reported |
| 19 | North Carolina | NC | 2024 | 18.80 | Price reported |
| 20 | Mississippi | MS | 2024 | 18.63 | Price reported |
| 21 | Kentucky | KY | 2024 | 18.54 | Price reported |
| 22 | Kansas | KS | 2024 | 18.50 | Price reported |
| 23 | Arkansas | AR | 2024 | 18.42 | Price reported |
| 24 | Iowa | IA | 2024 | 18.35 | Price reported |
| 25 | South Carolina | SC | 2024 | 18.34 | Price reported |
| 26 | New York | NY | 2024 | 18.31 | Price reported |
| 27 | West Virginia | WV | 2024 | 18.27 | Price reported |
| 28 | Indiana | IN | 2024 | 18.25 | Price reported |
| 29 | Missouri | MO | 2024 | 18.12 | Price reported |
| 30 | Hawaii | HI | 2024 | 17.99 | Price reported |
| 31 | Nebraska | NE | 2024 | 17.84 | Price reported |
| 32 | Delaware | DE | 2024 | 17.78 | Price reported |
| 33 | Oklahoma | OK | 2024 | 17.77 | Price reported |
| 34 | Minnesota | MN | 2024 | 17.68 | Price reported |
| 35 | New Jersey | NJ | 2024 | 17.49 | Price reported |
| 36 | Pennsylvania | PA | 2024 | 17.41 | Price reported |
| 37 | Tennessee | TN | 2024 | 17.38 | Price reported |
| 38 | Maine | ME | 2024 | 16.78 | Price reported |
| 39 | Wisconsin | WI | 2024 | 16.69 | Price reported |
| 40 | Connecticut | CT | 2024 | 16.52 | Price reported |
| 41 | Rhode Island | RI | 2024 | 15.83 | Price reported |
| 42 | Vermont | VT | 2024 | 15.83 | Price reported |
| 43 | New Hampshire | NH | 2024 | 15.73 | Price reported |
| 44 | South Dakota | SD | 2024 | 15.16 | Price reported |
| 45 | Massachusetts | MA | 2024 | 14.71 | Price reported |
| 46 | Florida | FL | 2024 | 6.76 | Price reported |
| 47 | Louisiana | LA | 2024 | 5.91 | Price reported |
| 48 | Ohio | OH | 2024 | 4.13 | Price reported |
| 49 | Montana | MT | 2024 | 3.90 | Price reported |
| 50 | Michigan | MI | 2024 | 3.34 | Price reported |
| — | District of Columbia | DC | 2024 | — | No electric-power petroleum consumption |
Frequently Asked Questions
Which states had the highest electric-power all-petroleum price in 2024?
California, Oregon, and Washington tied for the highest reported value at $24.76/MMBtu.
Which state had the lowest positive price?
Michigan was lowest at $3.34/MMBtu, followed by Montana at $3.90 and Ohio at $4.13.
Is the Total petroleum price a simple average of product prices?
No. EIA calculates PAEID from total electric-power petroleum expenditures divided by petroleum energy consumption, so the result is consumption weighted.
Does the District of Columbia’s 0.00 mean a real $0 petroleum price?
No. EIA Table E7 shows a dash for D.C. and defines it as no electric-power petroleum consumption.
Related Articles
Green Map creates custom-edited map images using open geographic data sources such as geoBoundaries, Natural Earth, OpenStreetMap, and government open data. These maps are edited visual materials, not raw data files, and are provided for education, documents, presentations, and graphic reference.