Stockholm had the largest published municipal live-birth value in Sweden for July 2026, at 1,043. Göteborg followed with 651 and Malmö with 438. Those figures are monthly counts, not birth rates, fertility rates, or population-adjusted measures. They therefore answer a narrow but useful question: how were the published live-birth counts distributed across Sweden’s 290 municipalities in the reference month 2026M07? The Statistics Sweden data also carry controlled random uncertainty for confidentiality, so small differences should not be read as perfectly precise administrative totals.
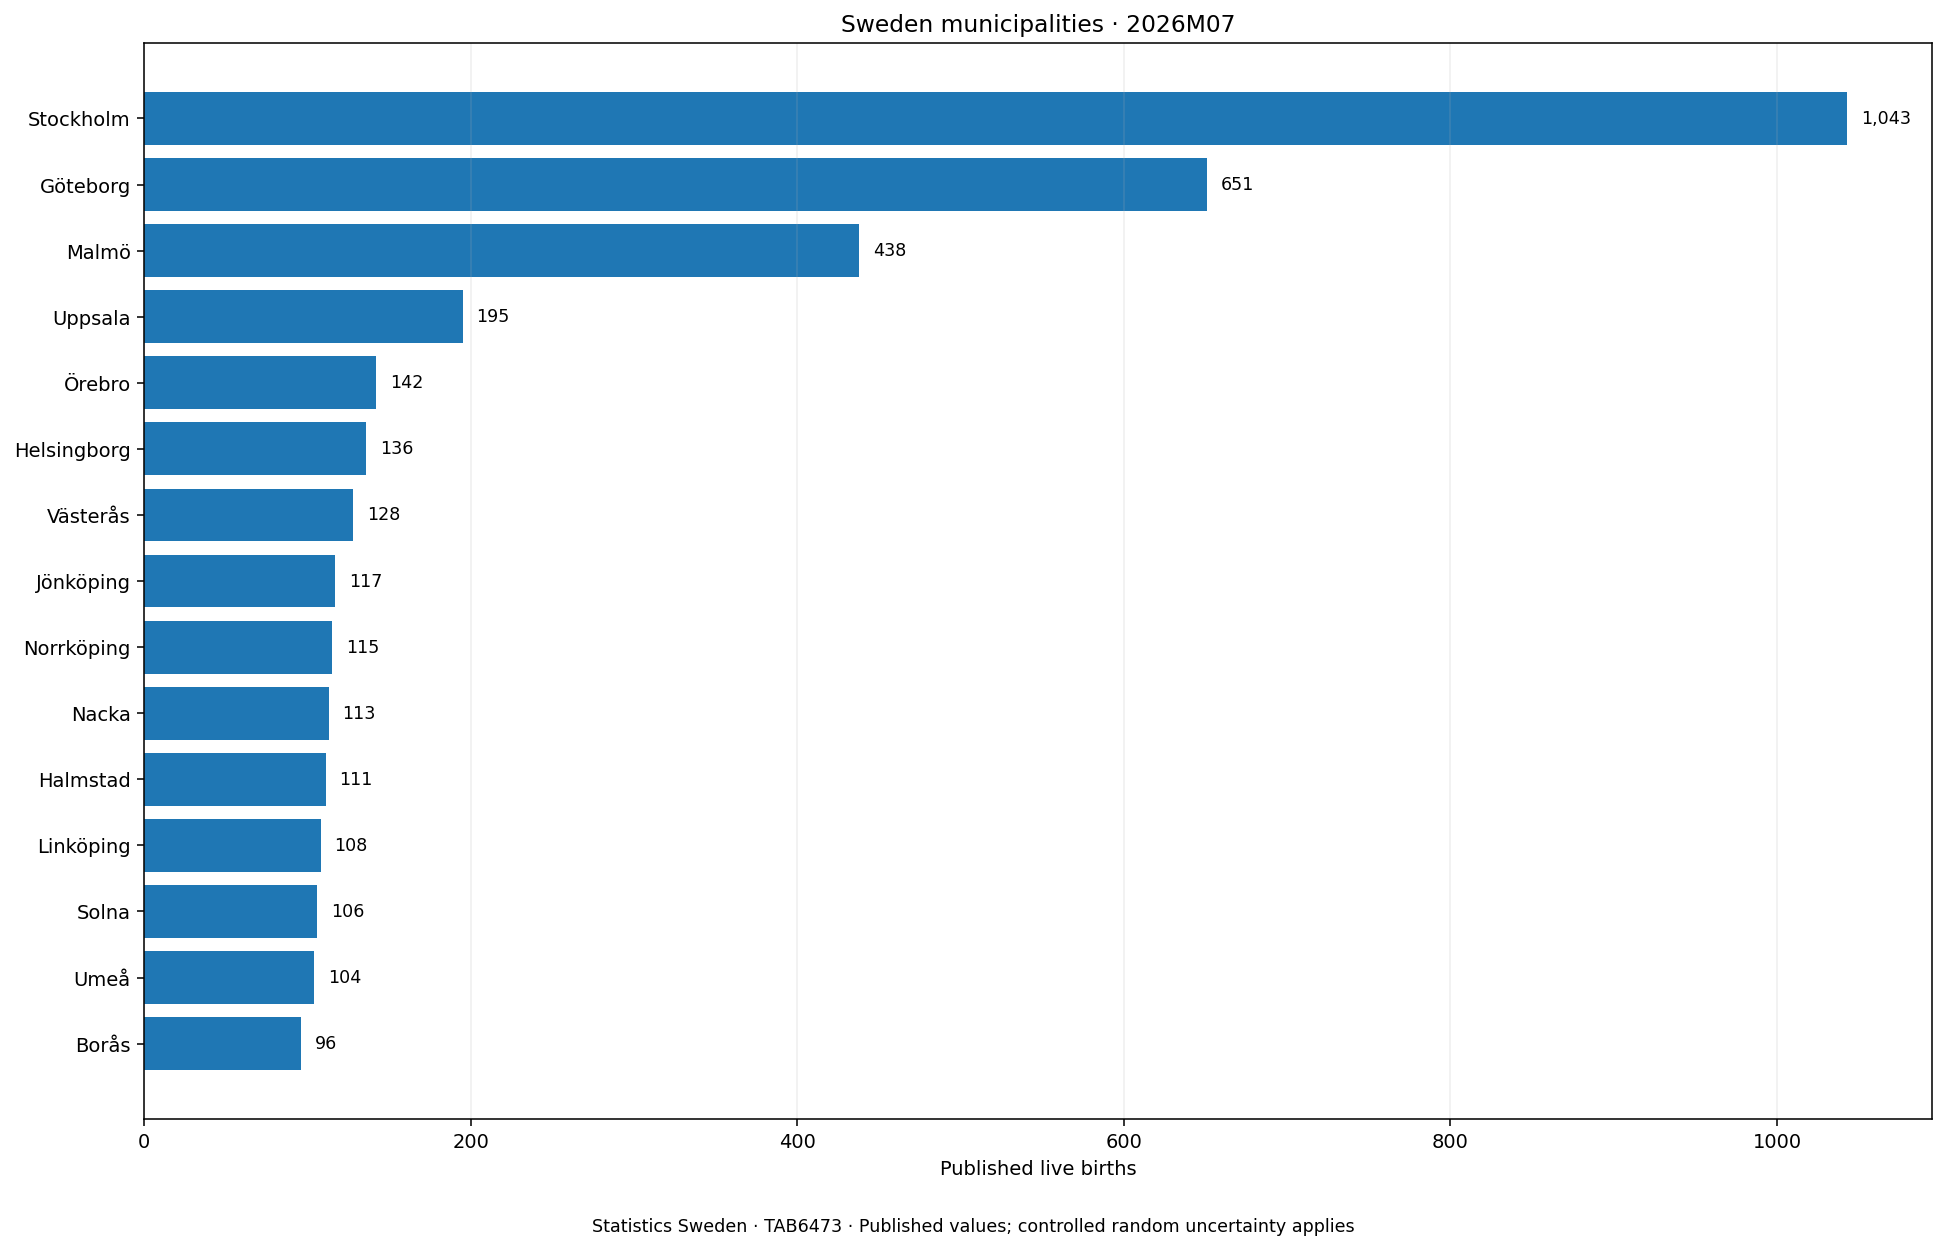
Table of Contents
Stockholm, Göteborg and Malmö were separated from the rest
The ranking falls sharply after the three largest published values. Stockholm’s 1,043 was 392 above Göteborg and 605 above Malmö. Uppsala, in fourth place, had 195, which was 243 below Malmö. The next municipalities were Örebro at 142, Helsingborg at 136, Västerås at 128, Jönköping at 117, Norrköping at 115 and Nacka at 113. This produces a distribution with a small number of very large observations and a much broader group of municipalities with substantially smaller monthly counts.
| Rank | Municipality | Published value, Jul 2026 |
|---|---|---|
| 1 | Stockholm | 1043 |
| 2 | Göteborg | 651 |
| 3 | Malmö | 438 |
| 4 | Uppsala | 195 |
| 5 | Örebro | 142 |
| 6 | Helsingborg | 136 |
| 7 | Västerås | 128 |
| 8 | Jönköping | 117 |
| 9 | Norrköping | 115 |
| 10 | Nacka | 113 |
Adding the 290 published municipal cells gives an arithmetic sum of 8,769. Against that calculated sum, Stockholm represents about 11.9%, Göteborg 7.4% and Malmö 5.0%; the top three together account for about 24.3%, while the top ten account for about 35.1%. These shares are useful for describing the shape of the municipal distribution, but 8,769 should not be presented as an official Swedish national total. Statistics Sweden notes that controlled random uncertainty applies and that totals do not necessarily equal the sum of published components.
The median of 12 is more representative than the mean of 30.2
Across all 290 municipalities, the mean published value is about 30.2, while the median is only 12. The gap between those two statistics is a clear sign of right-skew: a few large municipal values pull the average upward. The first quartile is 6 and the third quartile is 29, which means the middle half of municipalities lies between those values. A reader who looks only at the mean could therefore imagine a typical municipality with roughly 30 births in the month, even though half of the municipalities are at 12 or below.
- Published value of 0: 18 municipalities
- 1–9: 98 municipalities
- 10–29: 105 municipalities
- 30–99: 55 municipalities
- 100 or more: 14 municipalities
The first two groups together contain 116 municipalities, exactly 40.0% of the 290 observations. At the other end, only 14 municipalities reach 100 or more. This contrast describes a highly uneven distribution of monthly counts. It does not mean that municipalities with a published zero necessarily had exactly zero underlying births. Because confidentiality protection introduces controlled random uncertainty, a small published cell should be treated as an approximate released value rather than proof of an exact underlying event count.
Why this table cannot rank fertility
The unit in this table is births. There is no population denominator in the dataset, and it does not provide women of childbearing age, total population, or any other base needed to turn the counts into a rate. A large municipality can produce a large count simply because more people live there. For that reason, Stockholm’s first-place position should not be described as the highest fertility level in Sweden. A fertility comparison would require an appropriate denominator and usually a longer observation window.
The one-month reference period also matters. Monthly counts can move because of ordinary short-term variation, and a July snapshot cannot establish an annual trend. A municipality that ranks above another in July 2026 may not do so over a full year. To study persistent differences, a better design would combine multiple months or years and then, where relevant, standardize by population. The current dataset supports a cross-sectional July comparison, not a conclusion about long-run demographic change.
Published zeros and other small values require extra caution
The 18 municipalities with a published value of zero are Kinda, Boxholm, Borgholm, Essunga, Gullspång, Storfors, Munkfors, Ljusnarsberg, Skinnskatteberg, Norberg, Ragunda, Bräcke, Bjurholm, Norsjö, Sorsele, Dorotea, Arvidsjaur and Övertorneå. Listing them helps show the lower end of the distribution, but the data do not explain why their values are small. The table contains no measures of municipal population, age structure, migration, housing, local services or economic conditions, so attaching those explanations would go beyond the evidence.
Small-number comparisons can also look more dramatic than they are. A published value of 6 is numerically twice a value of 3, but the difference is only three events before considering the controlled uncertainty. For small municipalities, multi-month totals or moving averages would reduce the influence of a single month. Because this analysis deliberately stays within the supplied July data, it treats these values as a snapshot rather than a stable ranking of demographic performance.
The top ten contain two different tiers
Even within the top ten, the distribution is not uniform. Stockholm’s 1,043 is about 9.2 times Nacka’s 113. Göteborg’s 651 is roughly 3.3 times Uppsala’s 195, and Malmö’s 438 is more than twice Uppsala’s figure. By contrast, positions five through ten are clustered much more closely, from Örebro at 142 down to Nacka at 113. It is therefore more informative to distinguish the top three from the next group rather than treating every top-ten municipality as part of one similar tier.
Those differences describe the scale of the published counts, but they do not identify causes. Explaining them would require additional municipal data and a separate analytical design. Population size is an obvious missing denominator, while age composition and other demographic factors would matter for interpretation. The present table should remain a factual comparison of released monthly counts.
How to read the Statistics Sweden source
The source is Statistics Sweden’s Statistical Database, table TAB6473. The reference period is 2026M07, the geographic level is municipality, the sex dimension is total, and 290 municipal rows are present with no missing numeric values. The source note states that controlled random uncertainty applies and that totals need not equal the sum of their components. That methodological condition is essential when comparing small cells or calculating a sum across all municipalities.
The clearest findings are therefore about the released distribution: Stockholm, Göteborg and Malmö occupy the top three positions; the median municipal value is 12; 14 municipalities have values of at least 100; and 116 have single-digit or zero values. What the table cannot establish is equally important. It does not measure fertility rates, it does not show a trend from earlier months, and it does not support causal claims about why municipalities differ. Those questions require additional periods and denominators.
Frequently Asked Questions
Which Swedish municipality had the largest published live-birth value in July 2026?
Stockholm had the largest published value at 1,043, followed by Göteborg at 651 and Malmö at 438. Statistics Sweden applies controlled random uncertainty to the released cells.
Does a published zero mean there were exactly no births in that municipality?
Not necessarily. Controlled random uncertainty is used for confidentiality, so a small released cell should not be treated as proof of an exact underlying event count.
Can these data be used to compare municipal birth rates or fertility?
No. The table contains monthly birth counts without a population denominator, so it cannot directly compare birth rates or fertility levels. Additional population data and a longer period would be needed.
Related Articles
Green Map creates custom-edited map images using open geographic data sources such as geoBoundaries, Natural Earth, OpenStreetMap, and government open data. These maps are edited visual materials, not raw data files, and are provided for education, documents, presentations, and graphic reference.