Access to safely managed drinking water services differs sharply across countries and areas in 2024. In World Bank series SH.H2O.SMDW.ZS, 148 of 217 country and area rows have a reported 2024 value and 69 are source-missing. Among reported observations, the median is 80.72% and the simple mean is 70.83%. The Central African Republic records the lowest value at 6.22%, while Gibraltar, Hong Kong, Hungary, Iceland, Kuwait, Liechtenstein, Macao, Monaco, New Zealand and Singapore are reported at 100%.
This indicator uses a stricter standard than simply asking whether people have access to an improved water source. The official definition bundled with the dataset describes safely managed drinking water as water from an improved source that is accessible on premises, available when needed, and free from fecal and priority chemical contamination. Improved sources can include piped water, boreholes or tubewells, protected dug wells, protected springs, and packaged or delivered water.
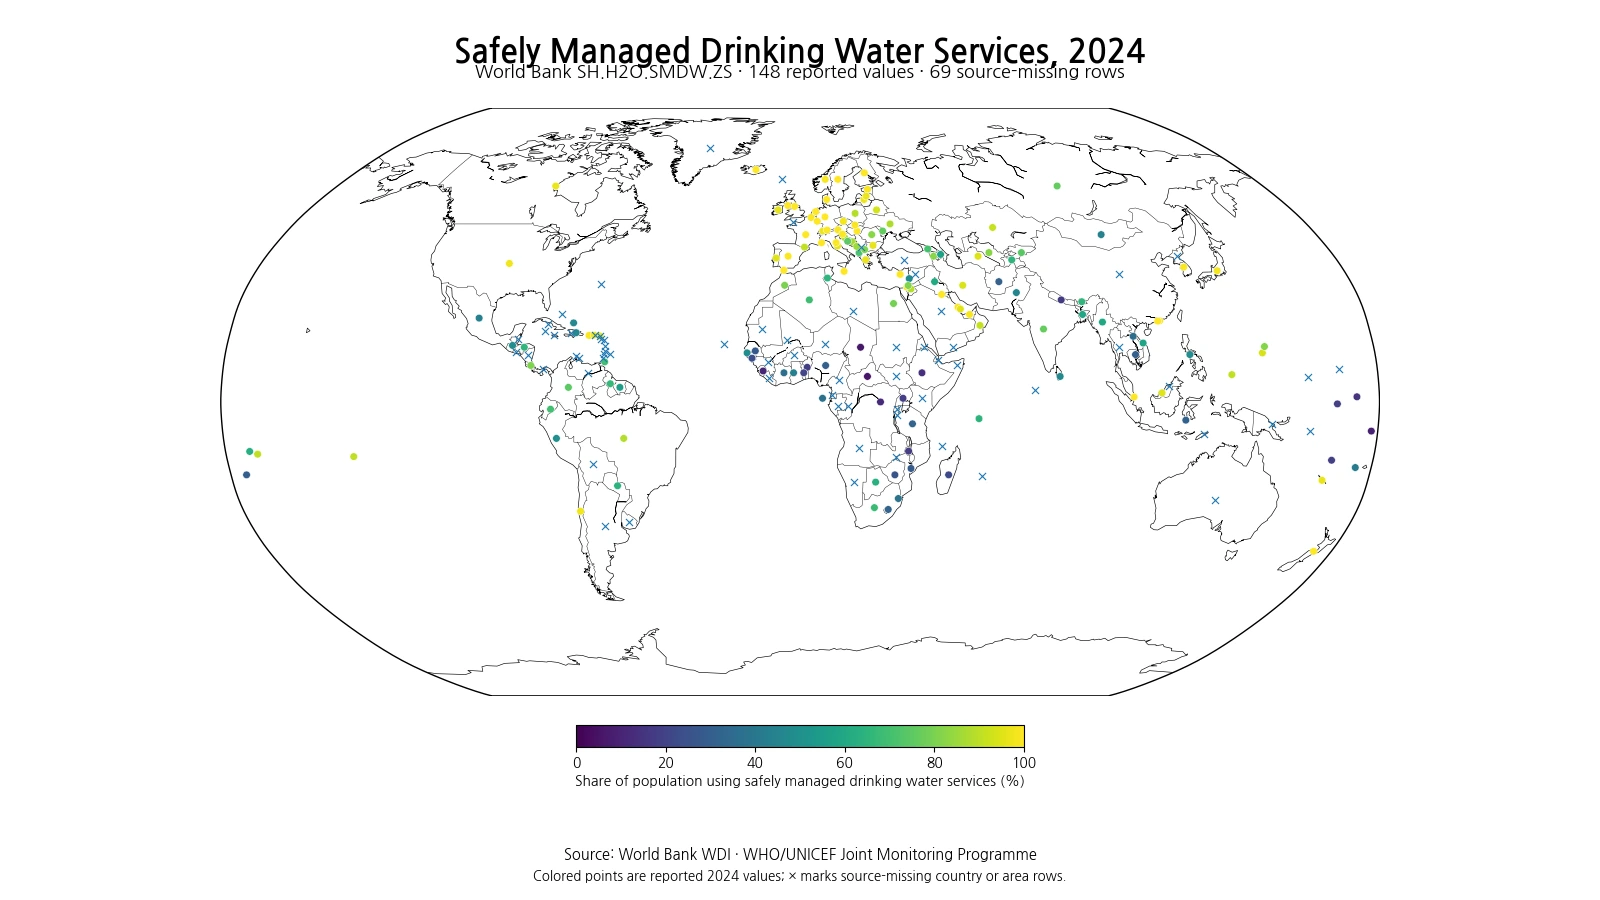
Table of Contents
Some reported areas reach 100%, but the global spread is wide
Among the 148 reported values, 11 observations are effectively 100% and 51 are at least 95%. Many high-income and highly urbanized countries therefore appear close to universal safely managed drinking water coverage. Yet the same dataset also includes countries below 20%. The wide spread reflects the fact that this service level combines access, continuity and water quality rather than only the presence of an improved source.
| Rank | Country or area | Coverage |
|---|---|---|
| 1 | Gibraltar | 100.00% |
| 2 | Hong Kong SAR, China | 100.00% |
| 3 | Hungary | 100.00% |
| 4 | Iceland | 100.00% |
| 5 | Kuwait | 100.00% |
| 6 | Liechtenstein | 100.00% |
| 7 | Macao SAR, China | 100.00% |
| 8 | Monaco | 100.00% |
| 9 | New Zealand | 100.00% |
| 10 | Singapore | 100.00% |
A value at or near 100% means that, under the monitoring framework and available data for the reference year, nearly the entire population is classified as using safely managed services. It does not mean that every location has identical service quality at every moment. National averages can conceal local outages, aging infrastructure, water-quality incidents and differences between urban and rural populations.
Low values can reflect more than the absence of pipes
At the lower end, the Central African Republic and Chad are near 6%, followed by Tuvalu, Sierra Leone, the Democratic Republic of the Congo, Ethiopia, Kiribati, Nepal, Benin and Uganda. These values do not simply measure whether piped water exists. A household may use an improved source and still fail to meet the safely managed standard if water is not available on premises, is not available when needed, or does not meet microbial and priority chemical safety requirements.
| Rank | Country or area | Coverage |
|---|---|---|
| 1 | Central African Republic | 6.22% |
| 2 | Chad | 6.34% |
| 3 | Tuvalu | 8.72% |
| 4 | Sierra Leone | 10.90% |
| 5 | Congo, Dem. Rep. | 11.87% |
| 6 | Ethiopia | 13.55% |
| 7 | Kiribati | 15.09% |
| 8 | Nepal | 16.49% |
| 9 | Benin | 17.70% |
| 10 | Uganda | 18.10% |
The reasons behind low coverage can differ substantially. Some countries may face limited infrastructure, while others may have intermittent supply, water-quality problems, difficult rural geography or weak maintenance capacity. Climate variability and water-resource constraints can also affect service reliability. The indicator identifies the scale of the coverage gap; explaining the gap requires more detailed national and subnational evidence.
The median is 80.72%, while the middle half spans a broad range
Across the 148 reported observations, the median is 80.72%, the first quartile is 47.02%, and the third quartile is 97.90%. The middle half of country and area observations therefore lies between about 47.02% and 97.90%. The simple mean, 70.83%, is lower than the median because the distribution has a long lower tail: many observations are close to 100%, but a substantial group falls in the 10–50% range.
There are 43 reported observations below 50%. This does not mean that the same share of the world population lives in countries below 50%. Each country or area receives equal weight in this simple distribution. A population-weighted world figure would require weighting by national population and may differ substantially from the unweighted country average reported here.
Basic drinking water and safely managed drinking water are not the same service level
The distinction between basic and safely managed drinking water is central to interpreting this dataset. Basic drinking water focuses on use of an improved source with a limited collection-time burden. Safely managed service adds requirements for on-premises accessibility, availability when needed and freedom from fecal and priority chemical contamination. A country can therefore have high basic-service coverage while having a lower safely managed share.
This distinction changes the policy question. Building or identifying an improved source is only one step. Reaching the safely managed level also requires reliable delivery and water quality. Areas with extensive infrastructure can still fall short if service is intermittent or contamination is detected.
A reported 100% does not mean water risk can never occur
A 100% national value should be read as a classification result for the monitoring period, not as a guarantee that every household will experience perfect water service every day in the future. Floods, droughts, contamination events, power failures and infrastructure breakdowns can occur even in systems with very high coverage. This annual national indicator is designed for comparative monitoring, not real-time drinking-water advisories.
Data quality also depends on national monitoring systems, surveys, administrative records and estimation methods. International monitoring applies common definitions, but countries can differ in sampling, testing frequency and data availability. Very small differences such as 99.9% versus 100% should therefore not automatically be interpreted as a meaningful quality ranking.
The 69 missing rows must not be converted to zero
The 2024 source table contains no reported value for 69 country and area rows. Missing data does not mean that no one uses safely managed drinking water. Replacing those rows with 0% would create false bottom rankings and distort the mean. All rankings, quartiles and summary statistics in this article use only the 148 reported 2024 observations, while missing rows are marked separately on the map.
The high number of missing rows also limits what can be inferred from a simple global map. If large-population countries are missing, an unweighted country distribution can look very different from a population-weighted regional or global estimate. The correct interpretation here is the distribution among countries and areas with a reported 2024 value.
The indicator combines source type, accessibility, reliability and safety
Safely managed drinking water is a composite service concept. First, people must use an improved source. Second, the source must be accessible on the premises. Third, water must be available when needed. Fourth, it must be free from fecal and priority chemical contamination. Failing any one of these conditions can place a household in a lower service category even when some infrastructure is present.
Because the measure combines several service dimensions, it is closer to lived drinking-water security than a simple infrastructure count. It still does not measure everything. Affordability, daily quantity, tariff burden, long-term aquifer depletion and climate resilience require additional indicators.
National averages can conceal large urban-rural gaps
A national value of 80% does not imply that every population group has similar service. Urban networks may provide high coverage while remote rural areas face greater challenges in maintenance and water-quality testing. In other settings, protected groundwater or local systems can support reliable rural access. Urban-rural or subnational data is needed to identify where the remaining service gap is concentrated.
Population growth and urbanization can also alter service pressure. A rapidly expanding city can maintain high infrastructure coverage while experiencing intermittent supply or water-quality stress if capacity does not keep pace with demand. Conversely, investment in treatment, distribution and monitoring can improve the safely managed share over time.
A single 2024 snapshot cannot show the pace of progress
The 2024 values show one cross-section. They do not tell us which countries are improving quickly, which are stagnant, or which have experienced setbacks. Measuring progress requires a time series of the same indicator, ideally interpreted alongside investment, climate shocks, water availability and service-management changes.
Safely managed drinking water is not a one-time infrastructure achievement. Systems require continued operation, maintenance, energy, treatment and monitoring. Long-term trends can therefore be more informative than one annual value when evaluating whether services remain reliable and safe.
Three checks help interpret the indicator correctly
First, the unit is the percentage of the total population using the service. Second, “safely managed” requires an improved source plus on-premises access, availability when needed and protection from fecal and priority chemical contamination. Third, 69 country and area rows have no reported 2024 value and must remain missing rather than being treated as zero.
World Bank WDI series SH.H2O.SMDW.ZS uses the international monitoring framework associated with the WHO/UNICEF Joint Monitoring Programme. Every ranking, quartile and map value in this article is calculated from the same 148 reported observations for 2024, with all 69 missing rows preserved as missing.
Frequently Asked Questions
What counts as safely managed drinking water?
It means using an improved drinking-water source that is accessible on premises, available when needed, and free from fecal and priority chemical contamination.
Is this the same as basic drinking water service?
No. Safely managed service is a higher service level that adds on-premises accessibility, availability and water-quality requirements.
Were the 69 missing 2024 rows treated as zero?
No. Source-missing rows remain missing and are excluded from rankings and summary statistics.
Related Maps
Green Map creates custom-edited map images using open geographic data sources such as geoBoundaries, Natural Earth, OpenStreetMap, and government open data.
These maps are edited visual materials, not raw data files, and are provided for education, documents, presentations, and graphic reference.