GNI per capita growth measures the annual percentage change in real gross national income per person. The verified World Bank file used here contains 170 latest non-empty observations for economies and territories, but they do not all refer to the same year. 103 observations are dated 2025, 49 are dated 2024 and 7 are dated 2023. The remaining records are older latest-available observations. That distinction matters: a latest-observation overview answers a different question from a strict same-year comparison.
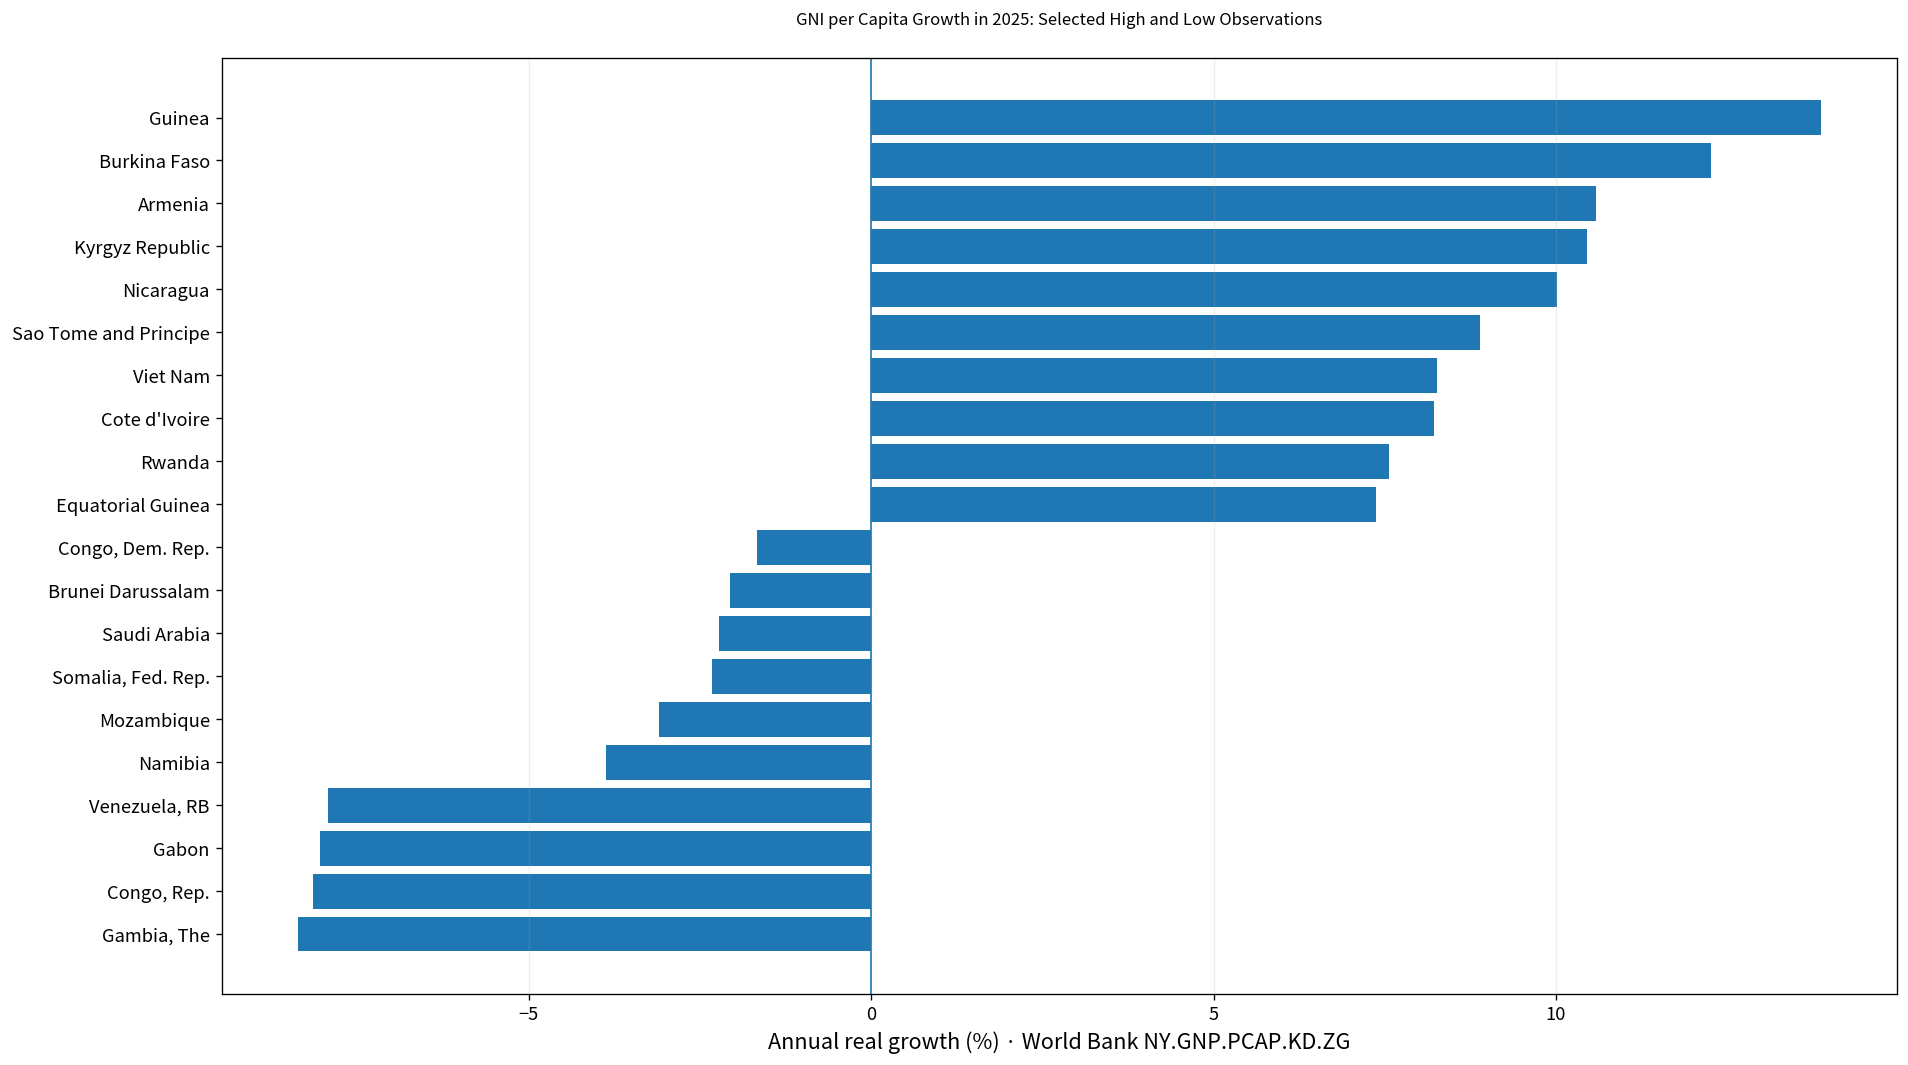
Table of Contents
What GNI per capita growth measures
Gross national income focuses on income accruing to residents. It starts from domestic production and incorporates net primary income received from abroad. GNI per capita divides that income by population, while the growth indicator reports the percentage change from the previous year in a constant-price series. A value of 5% therefore does not mean that income increased by five dollars. It means real GNI per person was about 5% higher than in the preceding year.
The growth rate should also be separated from the level of income. An economy can post rapid percentage growth from a relatively low base, while a high-income economy can add a large amount of income with only a modest percentage increase. A negative rate means real GNI per person fell from the prior year, but it does not by itself identify the cause. Changes in national income, net primary income from abroad and population can all affect the result.
The 170 latest observations span several years
The 170 rows are the most recent non-empty observations available in the verified file for each economy. The largest group is 2025 with 103 rows, followed by 2024 with 49 and 2023 with 7. A small set of economies has an older latest observation, extending back through 2022, 2020, 2019, 2018, 2016, 2015, 2012, 2011, 2007, 2004 and 2003. The year column therefore needs to travel with the value whenever the full latest-observation set is used.
| Observation year | Economies/territories | Share of 170 |
|---|---|---|
| 2025 | 103 | 60.6% |
| 2024 | 49 | 28.8% |
| 2023 | 7 | 4.1% |
| 2022 | 1 | 0.6% |
| 2020 | 1 | 0.6% |
| 2019 | 1 | 0.6% |
| 2018 | 1 | 0.6% |
| 2016 | 1 | 0.6% |
| 2015 | 1 | 0.6% |
| 2012 | 1 | 0.6% |
| 2011 | 1 | 0.6% |
| 2007 | 1 | 0.6% |
| 2004 | 1 | 0.6% |
| 2003 | 1 | 0.6% |
Across all 170 mixed-year latest observations, the simple median is 2.49% and the mean is 2.63%. There are 133 positive values and 37 negative values. Those figures are descriptive summaries of the collected latest values, not a 2025 world average. The mixed-year range is especially unsuitable for a current ranking because older outliers can sit beside recent observations.
The median among 103 observations from 2025 is 2.87%
Restricting the data to 2025 produces a more comparable set of 103 observations. The simple mean is 2.92% and the median is 2.87%. The first quartile is 0.78% and the third quartile is 5.33%, so the middle half of the 2025 observations lies between roughly 0.78% and 5.33%. There are 86 positive rates and 17 negative rates.
Within that same-year subset, 28 economies record growth of at least 5%, while 5 are at or above 10%. This distribution shows that a positive rate around two or three percent is much closer to the center of the 2025 data than the double-digit observations. The mean and median are fairly close, yet the tails remain wide enough that selected extremes should not be treated as typical.
Guinea and Burkina Faso are the highest 2025 observations
Guinea records the highest 2025 value in the verified file at 13.86%, followed by Burkina Faso at 12.26%. Armenia, Kyrgyz Republic and Nicaragua also exceed 10%. Sao Tome and Principe, Viet Nam, Cote d’Ivoire, Rwanda and Equatorial Guinea follow among the higher observations. These are rankings of one-year percentage changes, not rankings of GNI per capita levels or overall economic size.
| 2025 rank | Economy | GNI per capita growth |
|---|---|---|
| 1 | Guinea | 13.86% |
| 2 | Burkina Faso | 12.26% |
| 3 | Armenia | 10.58% |
| 4 | Kyrgyz Republic | 10.46% |
| 5 | Nicaragua | 10.02% |
| 6 | Sao Tome and Principe | 8.89% |
| 7 | Viet Nam | 8.25% |
| 8 | Cote d’Ivoire | 8.22% |
| 9 | Rwanda | 7.56% |
| 10 | Equatorial Guinea | 7.37% |
| 11 | Djibouti | 7.28% |
| 12 | Mongolia | 7.06% |
| 13 | Argentina | 6.85% |
| 14 | Paraguay | 6.83% |
| 15 | Senegal | 6.80% |
A double-digit increase can be economically important, but a single annual rate does not establish a durable trend. A rebound from a weak prior year, changes in national income, shifts in net income from abroad or changes in population growth can all affect the per-person rate. Explaining why a particular economy moved sharply would require a time series and additional national-accounts evidence. The comparison here stays within what the verified indicator itself can support.
Seventeen 2025 observations are negative
Among the 103 economies with 2025 data, 17 have negative growth. The lowest is Gambia, The at -8.37%, followed by Congo, Rep., Gabon and Venezuela, RB at around minus eight percent. Namibia, Mozambique, Somalia, Fed. Rep., Saudi Arabia and Brunei Darussalam are also below zero. The size of the decline differs substantially across these economies, so the sign alone is not enough to describe the result.
| 2025 low-order position | Economy | GNI per capita growth |
|---|---|---|
| 1 | Gambia, The | -8.37% |
| 2 | Congo, Rep. | -8.16% |
| 3 | Gabon | -8.04% |
| 4 | Venezuela, RB | -7.92% |
| 5 | Namibia | -3.87% |
| 6 | Mozambique | -3.10% |
| 7 | Somalia, Fed. Rep. | -2.33% |
| 8 | Saudi Arabia | -2.22% |
| 9 | Brunei Darussalam | -2.07% |
| 10 | Congo, Dem. Rep. | -1.66% |
| 11 | Mexico | -1.64% |
| 12 | Haiti | -1.38% |
| 13 | Ukraine | -0.65% |
| 14 | Australia | -0.51% |
| 15 | Bulgaria | -0.41% |
A negative GNI-per-person growth rate says that the real per-capita measure was lower than in the previous year. It does not say whether domestic output, foreign income flows or population was the dominant driver. GNI differs from GDP because it incorporates net primary income from abroad, and the per-capita calculation adds population to the denominator. As a result, GDP growth and GNI per capita growth can move by different amounts and, in some cases, in different directions.
Why a mixed 2024–2025 ranking can mislead
There are 49 observations dated 2024. Their median is 1.70% and their simple mean is 2.25%. Tajikistan’s 2024 observation is 41.53%, an unusually high value within that set. If it is placed directly beside 2025 observations without the year label, the table can look like a single global ranking even though the changes occurred in different periods. That is why the mixed-year list is presented as an availability table rather than as a current same-year league table.
The same caution applies more strongly to economies whose latest non-empty observation is several years old. An older value is still a valid historical observation, but it should not be described as the economy’s 2025 performance. Removing old rows would hide the fact that the latest available year differs, while relabeling them as recent would distort time. Keeping the original year beside every value preserves the evidence without creating a false common reference date.
GNI per capita growth is not GDP growth
GDP measures production within an economic territory. GNI is centered on income received by residents and includes net primary income from abroad. The per-capita version then divides by population. This creates several possible reasons why GDP growth and GNI per capita growth may differ: cross-border labor or investment income can change, population can grow at a different rate from total income, and revisions to national accounts can affect the series.
Choosing between the indicators depends on the question. GDP growth is usually the more direct measure for changes in domestic production. GNI growth is useful when the focus is income accruing to residents. GNI per capita growth adds the population dimension and is therefore closer to the question of how real national income per person is changing. None of these indicators alone measures the distribution of income across households.
Complete list of the 170 latest observations
The table below reproduces the verified latest non-empty observation for every economy in the package, ordered alphabetically. The observation year is shown explicitly because it is part of the meaning of the value. No missing observation has been replaced with zero, and older observations have not been projected forward. For strict 2025 comparisons, use only rows whose year is 2025.
| Economy | Observation year | GNI per capita growth |
|---|---|---|
| Afghanistan | 2024 | -3.81% |
| Albania | 2024 | 6.88% |
| Algeria | 2025 | 0.21% |
| Angola | 2024 | 3.73% |
| Argentina | 2025 | 6.85% |
| Armenia | 2025 | 10.58% |
| Australia | 2025 | -0.51% |
| Austria | 2024 | -1.48% |
| Azerbaijan | 2012 | -5.16% |
| Bahamas, The | 2024 | 3.23% |
| Bahrain | 2024 | 0.82% |
| Bangladesh | 2025 | 3.40% |
| Belarus | 2025 | 6.29% |
| Belgium | 2024 | 0.55% |
| Belize | 2024 | 2.46% |
| Benin | 2025 | 5.41% |
| Bermuda | 2024 | 2.26% |
| Bhutan | 2024 | 9.69% |
| Bolivia | 2024 | -1.04% |
| Bosnia and Herzegovina | 2025 | 5.08% |
| Botswana | 2024 | -4.18% |
| Brazil | 2025 | 1.79% |
| Brunei Darussalam | 2025 | -2.07% |
| Bulgaria | 2025 | -0.41% |
| Burkina Faso | 2025 | 12.26% |
| Cabo Verde | 2025 | 5.57% |
| Cambodia | 2025 | 4.00% |
| Cameroon | 2025 | -0.13% |
| Canada | 2025 | 0.77% |
| Central African Republic | 2025 | -0.05% |
| Chad | 2025 | 2.41% |
| Chile | 2025 | 3.50% |
| Colombia | 2025 | 1.49% |
| Comoros | 2025 | 2.05% |
| Congo, Dem. Rep. | 2025 | -1.66% |
| Congo, Rep. | 2025 | -8.16% |
| Costa Rica | 2025 | 3.21% |
| Cote d’Ivoire | 2025 | 8.22% |
| Croatia | 2025 | 2.27% |
| Cuba | 2019 | 0.07% |
| Cyprus | 2025 | 1.58% |
| Czechia | 2024 | 2.12% |
| Denmark | 2025 | 0.47% |
| Djibouti | 2025 | 7.28% |
| Dominican Republic | 2025 | 0.80% |
| Ecuador | 2025 | 2.07% |
| Egypt, Arab Rep. | 2025 | 0.46% |
| El Salvador | 2025 | 2.76% |
| Equatorial Guinea | 2025 | 7.37% |
| Eritrea | 2011 | 5.98% |
| Estonia | 2024 | 0.45% |
| Eswatini | 2024 | -5.15% |
| Ethiopia | 2025 | 4.20% |
| Finland | 2025 | 0.78% |
| France | 2024 | 0.61% |
| Gabon | 2025 | -8.04% |
| Gambia, The | 2025 | -8.37% |
| Georgia | 2025 | 6.52% |
| Germany | 2025 | 0.56% |
| Ghana | 2024 | 4.65% |
| Greece | 2024 | 2.90% |
| Greenland | 2007 | 9.89% |
| Guatemala | 2025 | 4.52% |
| Guinea | 2025 | 13.86% |
| Guinea-Bissau | 2025 | 3.55% |
| Haiti | 2025 | -1.38% |
| Honduras | 2025 | 1.51% |
| Hong Kong SAR, China | 2025 | 3.39% |
| Hungary | 2024 | 1.80% |
| Iceland | 2024 | -0.71% |
| India | 2025 | 6.63% |
| Indonesia | 2025 | 4.19% |
| Iran, Islamic Rep. | 2024 | -0.61% |
| Iraq | 2024 | -5.89% |
| Ireland | 2024 | 2.66% |
| Isle of Man | 2023 | 7.75% |
| Israel | 2025 | 1.17% |
| Italy | 2025 | 1.51% |
| Japan | 2024 | 1.11% |
| Kazakhstan | 2024 | 5.19% |
| Kenya | 2025 | 3.49% |
| Kiribati | 2024 | 1.75% |
| Korea, Rep. | 2025 | 2.31% |
| Kosovo | 2025 | 5.92% |
| Kuwait | 2024 | -4.97% |
| Kyrgyz Republic | 2025 | 10.46% |
| Lao PDR | 2016 | 11.86% |
| Latvia | 2024 | 1.19% |
| Lebanon | 2024 | 0.78% |
| Lesotho | 2025 | 2.03% |
| Libya | 2025 | 4.06% |
| Lithuania | 2024 | 4.68% |
| Luxembourg | 2024 | -3.34% |
| Macao SAR, China | 2024 | 8.05% |
| Madagascar | 2025 | 0.54% |
| Malawi | 2025 | 0.91% |
| Malaysia | 2025 | 3.32% |
| Maldives | 2024 | 10.00% |
| Mali | 2025 | 2.33% |
| Malta | 2025 | 4.33% |
| Marshall Islands | 2024 | 7.22% |
| Mauritania | 2025 | 0.01% |
| Mauritius | 2025 | 4.33% |
| Mexico | 2025 | -1.64% |
| Moldova | 2025 | 6.46% |
| Mongolia | 2025 | 7.06% |
| Montenegro | 2025 | 3.13% |
| Morocco | 2025 | 6.09% |
| Mozambique | 2025 | -3.10% |
| Namibia | 2025 | -3.87% |
| Nepal | 2025 | 4.15% |
| Netherlands | 2025 | 0.12% |
| New Zealand | 2024 | -0.84% |
| Nicaragua | 2025 | 10.02% |
| Niger | 2025 | 4.37% |
| North Macedonia | 2025 | 4.22% |
| Norway | 2022 | 24.86% |
| Oman | 2024 | -3.54% |
| Pakistan | 2025 | 1.91% |
| Palau | 2024 | 10.97% |
| Panama | 2024 | 1.60% |
| Papua New Guinea | 2004 | 0.41% |
| Paraguay | 2025 | 6.83% |
| Peru | 2025 | 5.69% |
| Philippines | 2025 | 5.25% |
| Poland | 2025 | 3.02% |
| Portugal | 2025 | 1.68% |
| Qatar | 2020 | -17.91% |
| Romania | 2025 | 2.72% |
| Russian Federation | 2023 | 4.69% |
| Rwanda | 2025 | 7.56% |
| Samoa | 2025 | 6.49% |
| San Marino | 2023 | -0.03% |
| Sao Tome and Principe | 2025 | 8.89% |
| Saudi Arabia | 2025 | -2.22% |
| Senegal | 2025 | 6.80% |
| Serbia | 2025 | 4.62% |
| Seychelles | 2023 | 5.47% |
| Sierra Leone | 2025 | 2.53% |
| Singapore | 2025 | 2.87% |
| Slovak Republic | 2024 | 2.86% |
| Slovenia | 2024 | 2.33% |
| Solomon Islands | 2024 | 2.57% |
| Somalia, Fed. Rep. | 2025 | -2.33% |
| South Africa | 2025 | 0.91% |
| South Sudan | 2015 | -15.31% |
| Spain | 2024 | 2.77% |
| Sri Lanka | 2025 | 6.68% |
| Sudan | 2025 | 3.79% |
| Sweden | 2025 | 0.57% |
| Switzerland | 2023 | -2.26% |
| Tajikistan | 2024 | 41.53% |
| Tanzania | 2025 | 4.92% |
| Thailand | 2003 | 6.57% |
| Timor-Leste | 2024 | -9.70% |
| Togo | 2023 | 3.96% |
| Tonga | 2024 | 4.63% |
| Tunisia | 2025 | 1.56% |
| Uganda | 2025 | 4.26% |
| Ukraine | 2025 | -0.65% |
| United Arab Emirates | 2023 | 3.69% |
| United Kingdom | 2024 | 1.56% |
| United States | 2024 | 1.70% |
| Uruguay | 2025 | 2.82% |
| Vanuatu | 2024 | -2.08% |
| Venezuela, RB | 2025 | -7.92% |
| Viet Nam | 2025 | 8.25% |
| West Bank and Gaza | 2025 | 2.66% |
| Yemen, Rep. | 2018 | -8.51% |
| Zimbabwe | 2024 | 0.25% |
How to interpret the data responsibly
First, distinguish the latest-observation set from the same-year subset. Second, do not treat a growth rate as a level of income. Third, avoid turning a one-year change into a long-run trend without a time series. Fourth, do not infer a specific policy or event as the cause of a rate from this indicator alone. The data identify where changes were large or small; causal explanation requires additional evidence.
International data are also revised. National statistical offices, central banks, international organizations and World Bank staff can update underlying national accounts or population estimates, which can change previously published growth rates. A reader using the figures for a current policy, investment or country-specific decision should check the latest World Bank series and the relevant national source as well.
Source and calculation
The source indicator is World Bank World Development Indicators NY.GNP.PCAP.KD.ZG, GNI per capita growth (annual %). The package uses the most recent non-empty observation linked to each economy. The 2025 statistics are recalculated only from rows dated 2025. Means, medians, quartiles, sign counts and the selected high and low tables are derived directly from the verified CSV. No missing value is imputed as zero.
Frequently Asked Questions
Are all 170 latest observations from 2025?
No. 103 are dated 2025, 49 are from 2024 and 7 are from 2023; the remaining latest non-empty values are older.
What is the median GNI per capita growth rate among the 2025 observations?
The median among the 103 observations dated 2025 is 2.87%, while the simple mean is 2.92%.
Does a high GNI per capita growth rate mean an economy has a high income level?
No. The growth rate measures year-over-year change, while the income level is a separate absolute measure. A lower-income economy can grow quickly and a high-income economy can grow slowly.
Related Articles
Green Map creates custom-edited map images using open geographic data sources such as geoBoundaries, Natural Earth, OpenStreetMap, and government open data. These maps are edited visual materials, not raw data files, and are provided for education, documents, presentations, and graphic reference.