World Bank indicator GC.XPN.COMP.ZS provides a latest non-empty observation for compensation of employees as a share of government expense in 157 countries and territories. Observation years range from 1980 to 2024, with 85 observations from 2023 and only Tanzania from 2024. The unweighted mean is 26.74% and the median 25.90%. Mozambique has the highest latest share at 62.02%, while Kazakhstan has the lowest at 5.16%.
Compensation of employees is a government-finance concept covering remuneration paid to employees for work performed, in cash or in kind, with employer social contributions included in the broader government-finance treatment. The denominator is government expense, not GDP or government revenue. A 30% value therefore means employee compensation accounts for roughly 30% of recorded government expense.
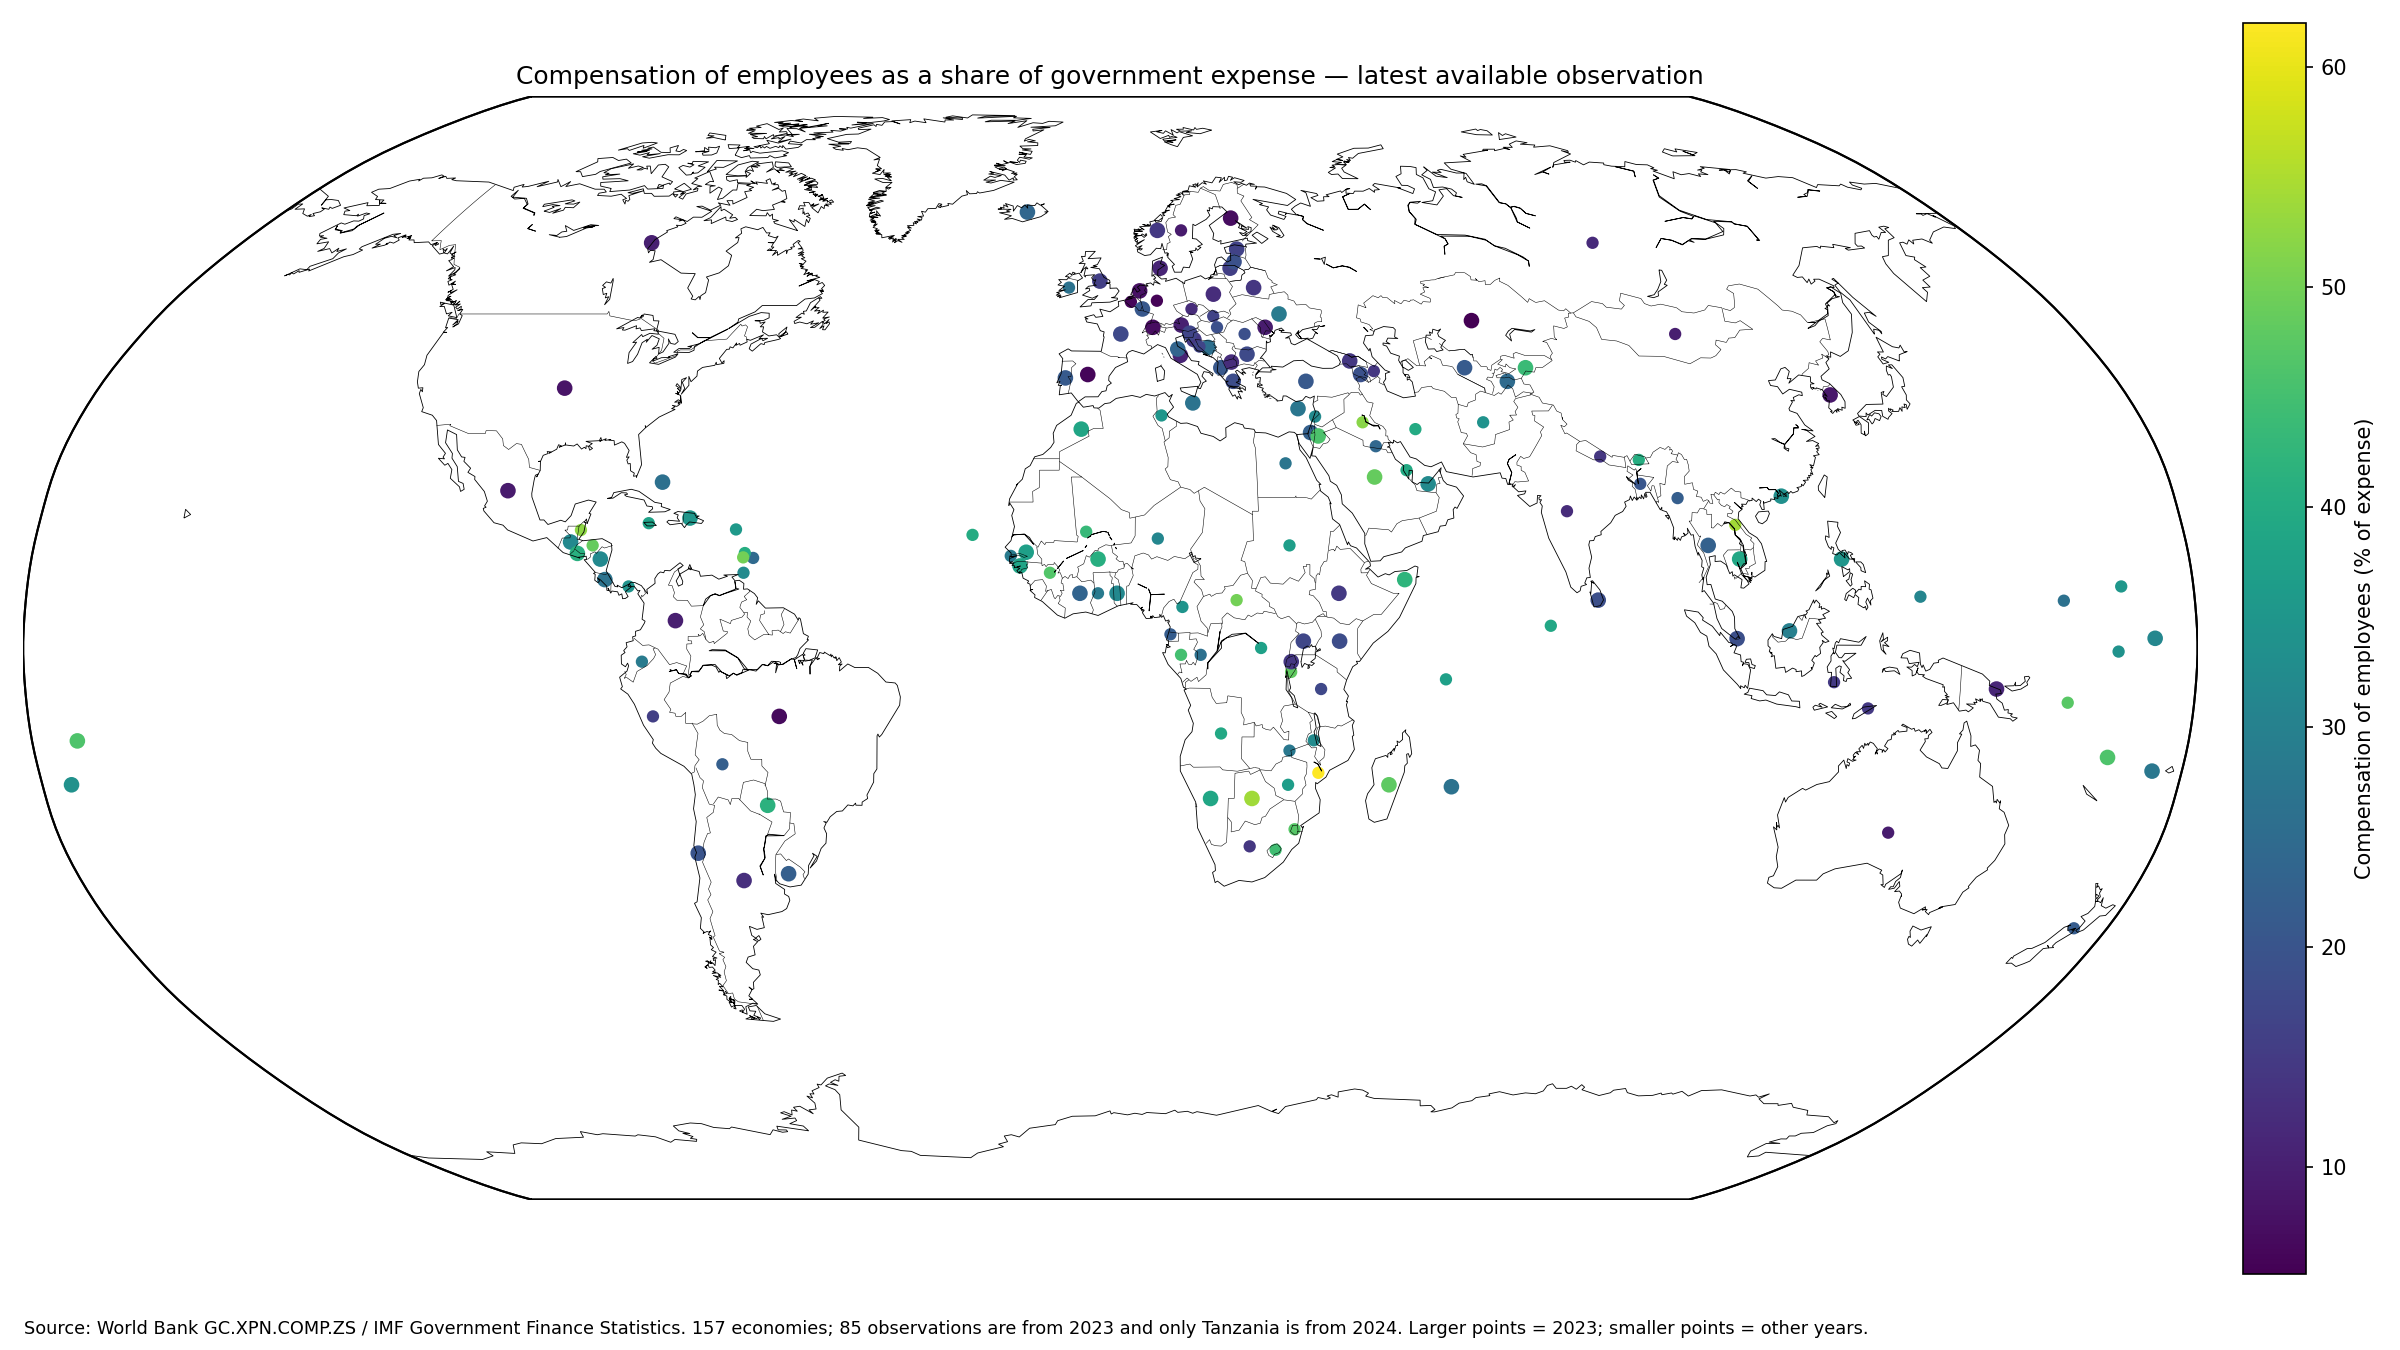
Table of Contents
What compensation of employees as a share of expense means
World Bank metadata defines compensation of employees as total remuneration, in cash or in kind, payable to an employee in return for work during the accounting period. In government finance, this is an expense category within the fiscal accounts rather than a measure of private-sector wages.
The World Bank metadata glossary provides the definition, and the World Bank API provides the latest country observations. The source is the IMF Government Finance Statistics Yearbook and associated data files.
The highest latest shares are above 50%
Mozambique records 62.02%, Lao PDR 54.22%, Botswana 53.96%, Belize 52.38%, and Iraq 51.92%. The Central African Republic, St. Vincent and the Grenadines, Honduras, Saudi Arabia, and Burundi are also close to 50%.
The observation years differ substantially. Mozambique and Lao PDR are 2022 values, Botswana and Saudi Arabia are 2023, Belize is 2017, and Iraq is 2019. The 157-economy latest-value table is therefore not a synchronized current ranking.
| Rank | Country or territory | Observation year | Employee compensation / expense |
|---|---|---|---|
| 1 | Mozambique | 2022 | 62.02% |
| 2 | Lao PDR | 2022 | 54.22% |
| 3 | Botswana | 2023 | 53.96% |
| 4 | Belize | 2017 | 52.38% |
| 5 | Iraq | 2019 | 51.92% |
| 6 | Central African Republic | 2021 | 49.90% |
| 7 | St. Vincent and the Grenadines | 2017 | 49.82% |
| 8 | Honduras | 2020 | 48.59% |
| 9 | Saudi Arabia | 2023 | 48.55% |
| 10 | Burundi | 2021 | 48.09% |
| 11 | Madagascar | 2023 | 47.86% |
| 12 | Solomon Islands | 2022 | 47.34% |
| 13 | Eswatini | 2021 | 47.04% |
| 14 | Guinea | 1992 | 46.62% |
| 15 | Samoa | 2023 | 46.14% |
The 2023 same-year subset covers 85 economies
Restricting the data to 2023 leaves 85 economies. Botswana leads at 53.96%, followed by Saudi Arabia at 48.55%, Madagascar at 47.86%, Samoa at 46.14%, and Vanuatu at 46.06%.
| 2023 rank | Country or territory | Employee compensation / expense |
|---|---|---|
| 1 | Botswana | 53.96% |
| 2 | Saudi Arabia | 48.55% |
| 3 | Madagascar | 47.86% |
| 4 | Samoa | 46.14% |
| 5 | Vanuatu | 46.06% |
| 6 | Jordan | 46.00% |
| 7 | Kyrgyz Republic | 43.60% |
| 8 | Somalia, Fed. Rep. | 42.05% |
| 9 | Paraguay | 41.51% |
| 10 | El Salvador | 40.94% |
| 11 | Burkina Faso | 40.71% |
| 12 | Cambodia | 38.95% |
| 13 | Namibia | 38.78% |
| 14 | Morocco | 38.54% |
| 15 | Guinea-Bissau | 38.44% |
The 2023 subset has an unweighted mean of 23.67% and a median of 21.09%. The first quartile is 14.36% and the third quartile 31.99%. 11 economies are at 40% or more and 11 are below 10%.
The low end is in single digits
Kazakhstan records 5.16%, Germany 5.72%, Belgium 5.87%, Spain 5.93%, and Brazil 6.58%. Switzerland, Finland, the Netherlands, and the United States are also below 10%.
A low ratio does not mean government employees receive low wages. It only means employee compensation is a relatively small part of total government expense. Transfers, interest, subsidies, purchases of goods and services, and other expense can make up a larger part of the denominator.
| Low-end rank | Country or territory | Observation year | Employee compensation / expense |
|---|---|---|---|
| 1 | Kazakhstan | 2023 | 5.16% |
| 2 | Germany | 2022 | 5.72% |
| 3 | Belgium | 2022 | 5.87% |
| 4 | Spain | 2023 | 5.93% |
| 5 | Brazil | 2023 | 6.58% |
| 6 | Switzerland | 2023 | 7.02% |
| 7 | Finland | 2023 | 7.14% |
| 8 | Netherlands | 2023 | 7.81% |
| 9 | United States | 2023 | 8.11% |
| 10 | Sweden | 2022 | 9.17% |
| 11 | Mexico | 2023 | 9.20% |
| 12 | Moldova | 2023 | 9.48% |
| 13 | Australia | 2022 | 9.49% |
| 14 | Colombia | 2023 | 9.83% |
| 15 | Mongolia | 2021 | 9.89% |
The median is 25.90%
The median across the 157 latest observations is 25.90%, with a first quartile of 15.64% and third quartile of 37.05%. 16 observations are below 10%, 42 are from 10% to under 20%, 36 from 20% to under 30%, 36 from 30% to under 40%, and 27 are at least 40%.
The mean of 26.74% is fairly close to the median, but the cross-country range is wide. In some economies, employee compensation accounts for more than half of government expense; in others it is below one-tenth.
Observation years vary from 1980 to 2024
110 observations are from 2022–2024, while 21 are from 2019 or earlier. The oldest latest observation is from 1980. An old value remains the latest non-empty observation available in this extract, but it should not be described as the country’s current fiscal structure.
Older high-share observations such as Guinea in 1992, Belize in 2017, and Iraq in 2019 need an explicit year label. The full map maximizes coverage; the 2023 subset is better for same-year comparison.
Expense share is not the same as a GDP share
The denominator here is government expense. A separate expense-to-GDP indicator is needed to assess how large government spending is relative to the whole economy. Two countries can have the same employee-compensation share of expense but very different government-spending shares of GDP.
The series is therefore best used to study the composition of government expense. It does not directly measure public-sector wages as a share of GDP, government employment, or average pay per worker.
A high share is not a measure of public-service performance
A high employee-compensation share shows that labor-related government costs are large within the expense mix. It does not establish that public services are efficient or high quality. Labor-intensive government functions can naturally create a higher ratio.
Likewise, a low ratio is not proof of efficiency. Transfers, interest, subsidies, and procurement can occupy a larger share of expense. Service outcomes require separate education, health, safety, administration, or other performance indicators.
The ratio cannot separate headcount from average pay
Total compensation reflects both the number of employees and compensation per employee, but this ratio does not tell us which component drives the result. Two governments can have the same ratio with very different staffing and pay structures.
Government employment statistics are required to study headcount, while payroll or occupation-level pay data are needed to study compensation levels.
Large transfer programs can lower the ratio mechanically
Government expense includes more than employee compensation. Pensions, social transfers, interest, subsidies, and purchases of goods and services can all expand the denominator. Economies with large transfer systems can therefore have a relatively low employee-compensation share even with substantial public employment.
The complete expense composition should be examined before drawing conclusions about staffing or fiscal priorities from this ratio alone.
The country mean is not a global expenditure-weighted share
The 26.74% simple mean gives each of the 157 economies equal weight. A government with a very large expense budget and a small government each count once. It is not the worldwide share of employee compensation in total government expense.
A global weighted share would require government-expense amounts as weights. The median likewise describes the middle country observation rather than the middle dollar of public spending.
Source and calculation notes
The source is World Bank World Development Indicators series GC.XPN.COMP.ZS, sourced from IMF Government Finance Statistics. The analysis uses the latest non-empty observation for 157 economies and separately examines the 85 observations from 2023. The official World Bank API provides the series.
All 157 reported country codes are joined to geographic centroids for the map, producing a 100% match. Larger points mark 2023 observations and smaller points other years. Missing economies are not converted to zero.
Frequently Asked Questions
Does this ratio measure average government-employee pay?
No. It shows total employee compensation as a share of government expense and does not separately identify headcount or average pay per employee.
Are all 157 observations from 2024?
No. Tanzania is the only 2024 observation, while 85 economies have 2023 data and the full range spans 1980–2024.
Does a high share mean public services perform better?
Not necessarily. It is an expense-composition measure and does not directly measure efficiency, service quality, or policy outcomes.
Related Articles
Green Map creates custom-edited map images using open geographic data sources such as geoBoundaries, Natural Earth, OpenStreetMap, and government open data. These maps are edited visual materials, not raw data files, and are provided for education, documents, presentations, and graphic reference.