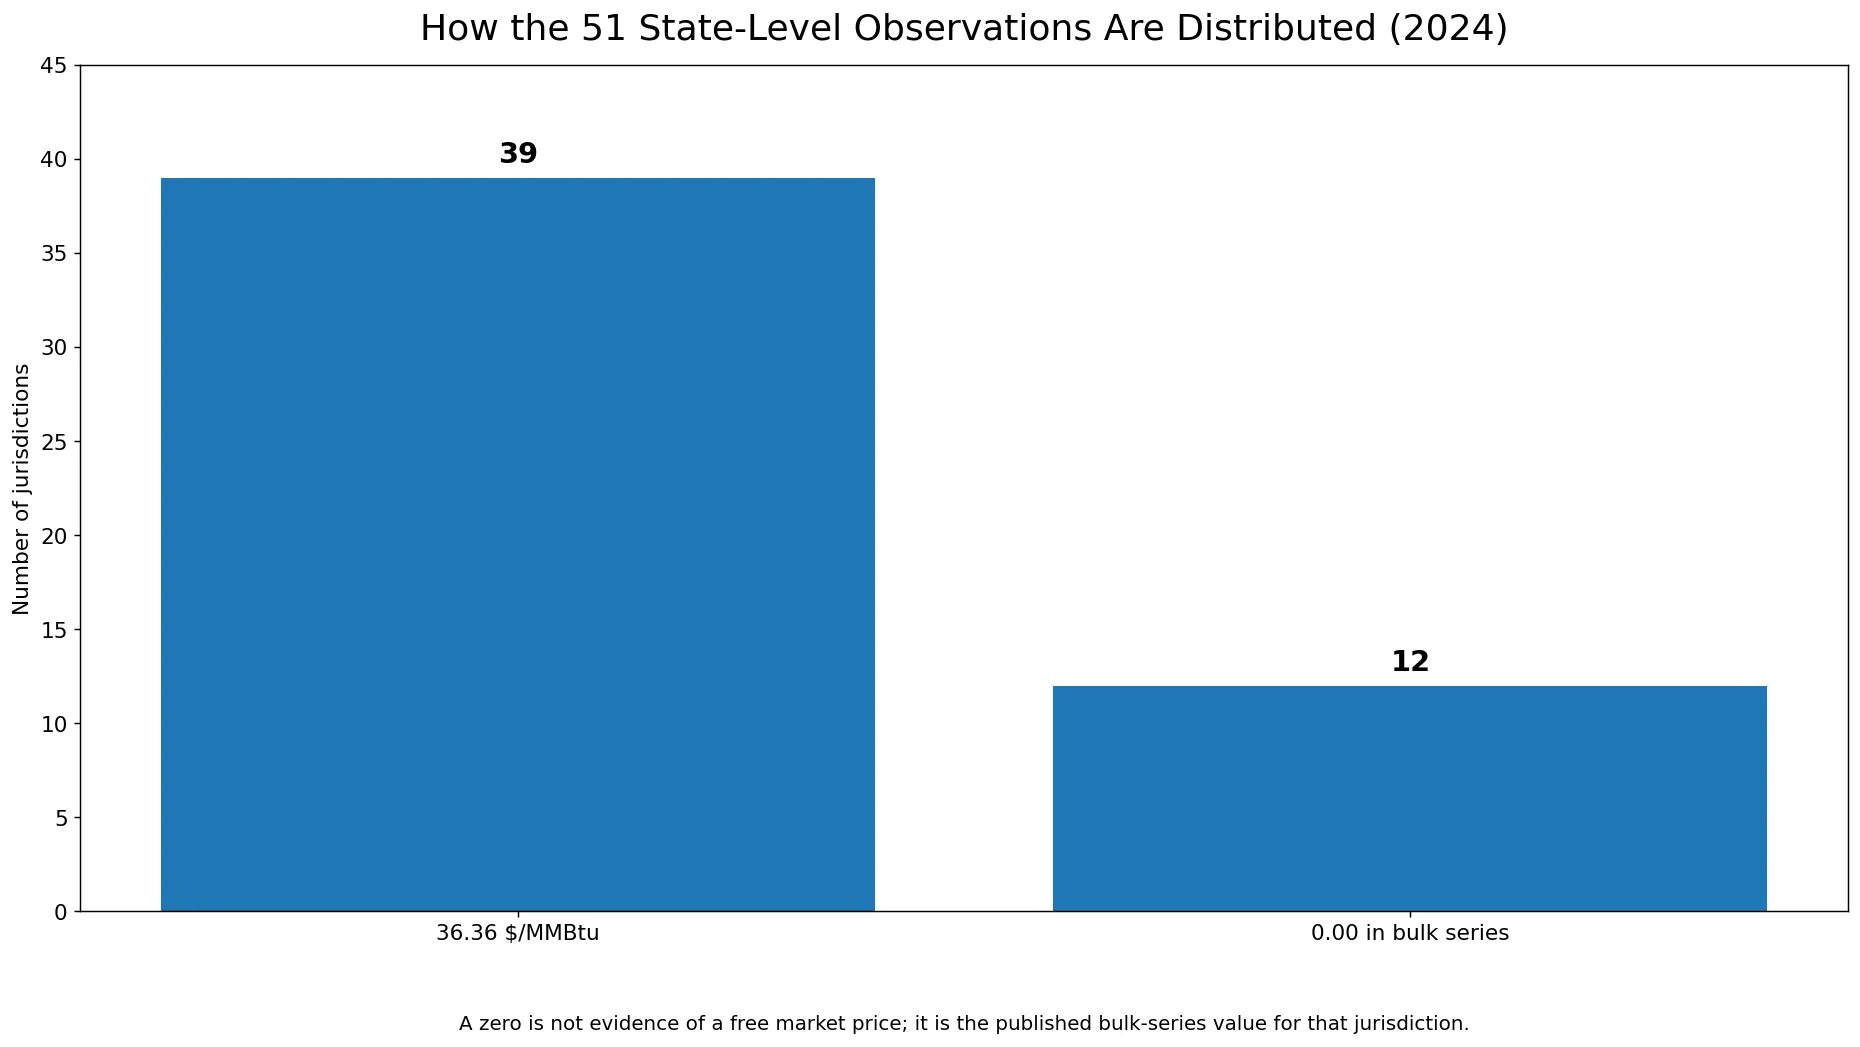
The 2024 state series for industrial-sector wax prices looks unusual at first glance. In the U.S. Energy Information Administration’s State Energy Data System (SEDS), 39 of the 51 state-level jurisdictions carry exactly the same positive value: $36.36 per million Btu. The other 12 observations are 0.00. That pattern is not evidence that dozens of local wax markets independently settled at an identical price.
The key is the methodology. SEDS treats waxes as one of the “other petroleum products” used primarily in the industrial sector, and EIA develops only a national-level price for waxes because state-specific price information is not available. The repeated $36.36 values are therefore consistent with a common national price being used in state-level records where a positive wax-price observation applies.
The unit is dollars per million Btu, not dollars per barrel, pound, or retail package. It is an energy-normalized price used inside the SEDS price-and-expenditure framework. Readers looking for a retail paraffin quote, a refinery spot price, or a state-specific wholesale market price are asking a different question than this series answers.
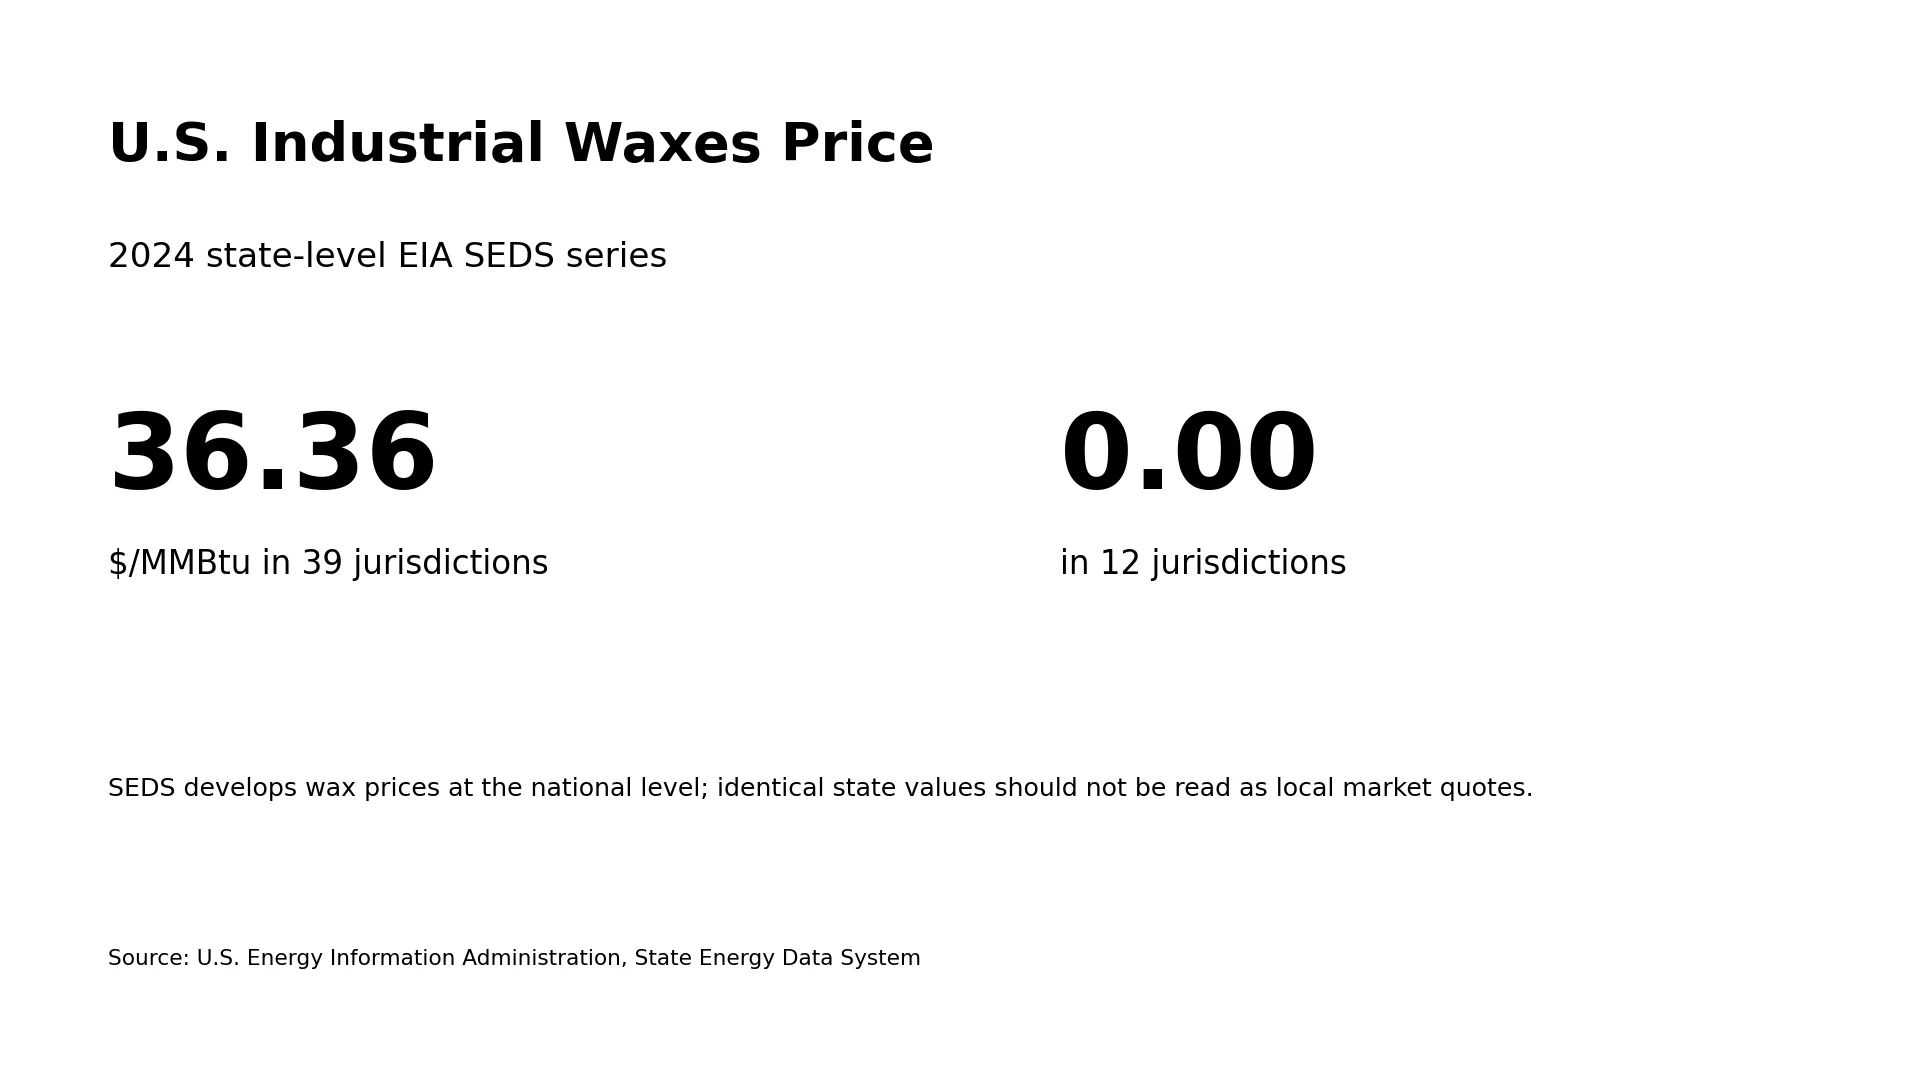
Table of Contents
What does the industrial-sector waxes price measure?
EIA’s petroleum price documentation describes waxes as including fully refined crystalline wax, other refined crystalline wax, and microcrystalline wax. In SEDS, these products sit within the broader other-petroleum-products category, but waxes also have their own price series. That makes the series useful for understanding a specific input to the industrial energy expenditure system, even though it is not a conventional fuel-price map.
For 2013 forward, EIA estimates wax prices from U.S. trade data by relating the value of exports to the quantity exported for relevant paraffin and microcrystalline petroleum wax categories. Earlier periods use other official sources and price-index methods. The methodological point that matters for a 2024 state comparison is that SEDS does not identify a separate state market price for waxes; it develops a national price.
Because of that design, this dataset cannot tell us whether wax was genuinely more expensive in Alabama than in California, or whether industrial buyers in Texas faced the same contract terms as buyers in New York. A positive value in the state slice reflects the SEDS price input, not an independent survey of each state’s local wax market.
Why do 39 jurisdictions all show $36.36 per MMBtu?
Thirty-nine jurisdictions, or about 76.5% of the 51 observations, have the same positive value of 36.36. In many energy-price datasets, identical values across so many states would immediately raise a quality-control question. Here, however, the repetition follows directly from the documented use of a national-level wax price.
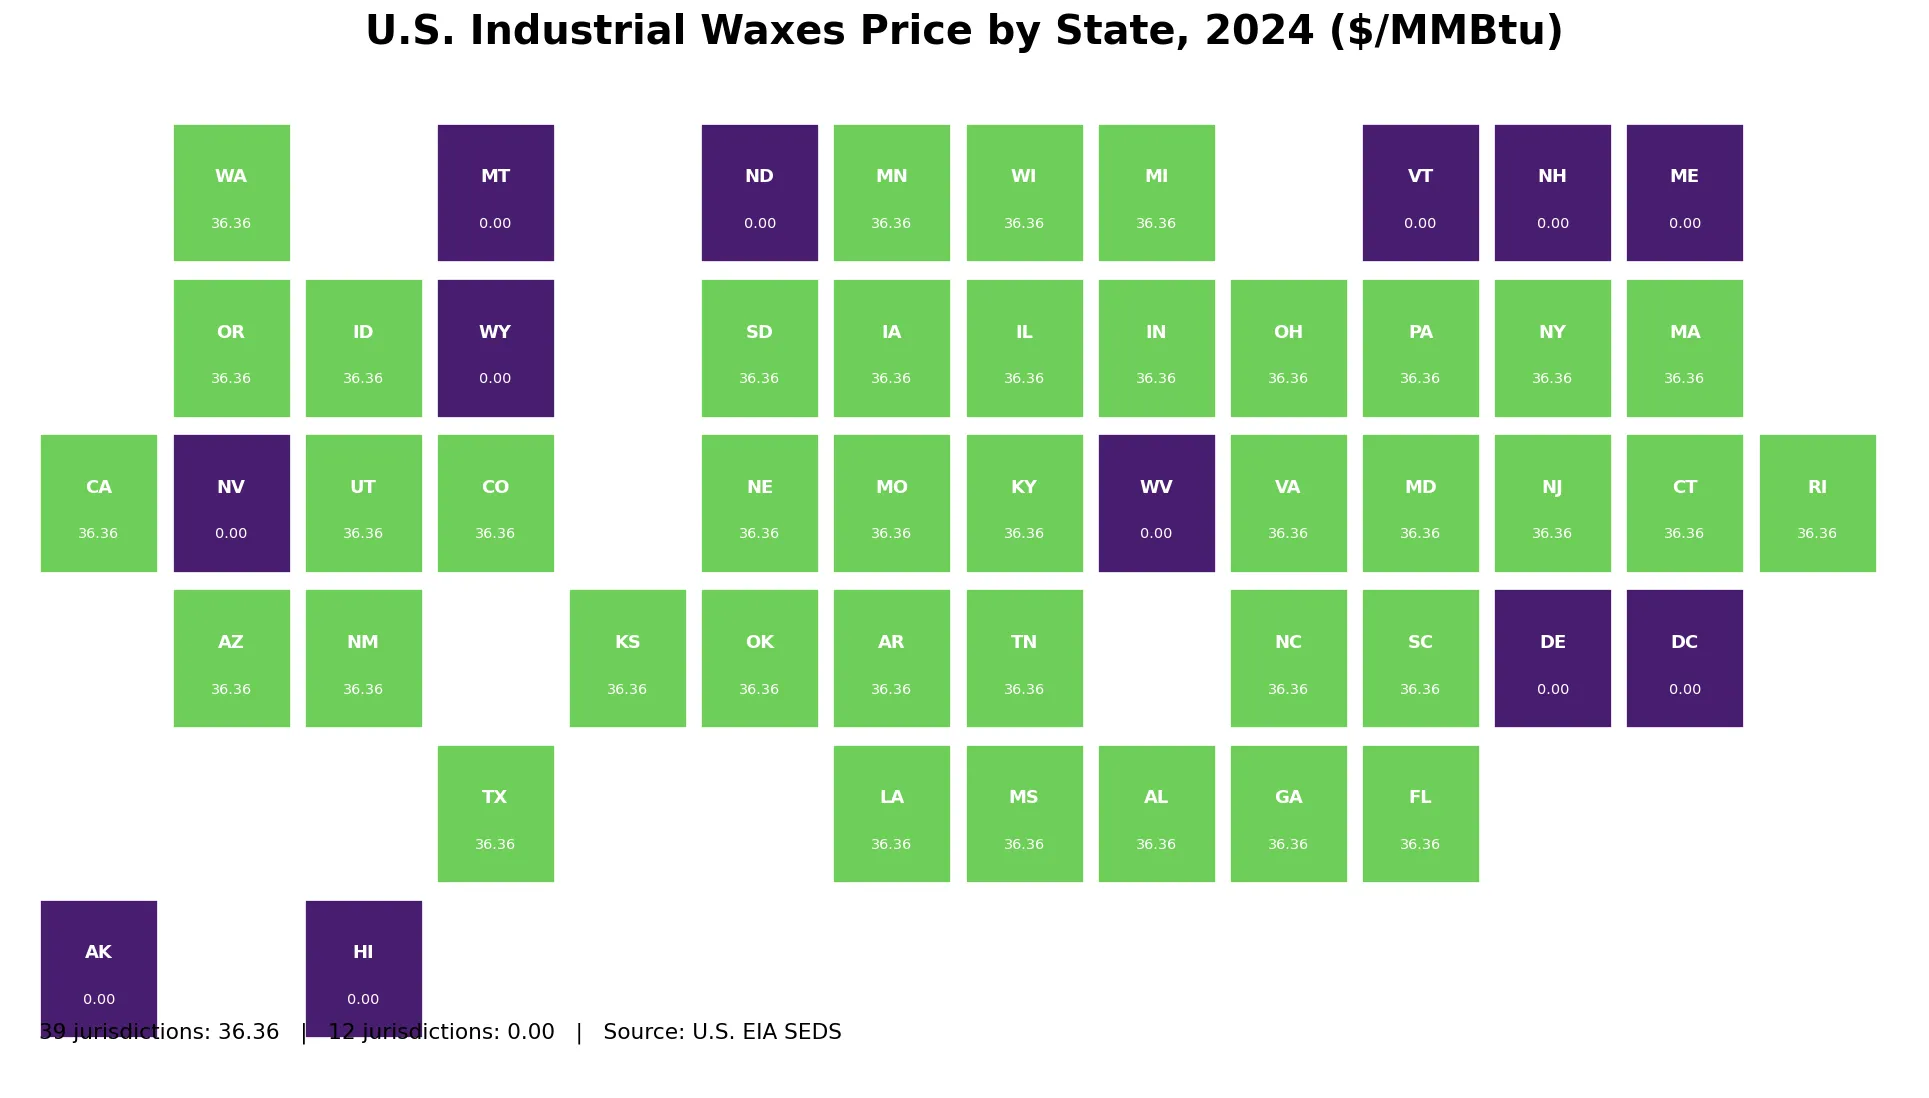
The practical consequence is that a standard high-to-low state ranking would be misleading. Those 39 states are tied because the series gives them the same positive price input. Assigning arbitrary rank numbers would create distinctions that do not exist in the data. The useful geographic split is instead between jurisdictions with the positive national-level value and jurisdictions recorded as 0.00.
That is also why the map below uses two states of the series rather than a continuous price gradient. It preserves the data exactly while avoiding the impression that tiny state-to-state market differences have been measured.
How should the 12 zero observations be interpreted?
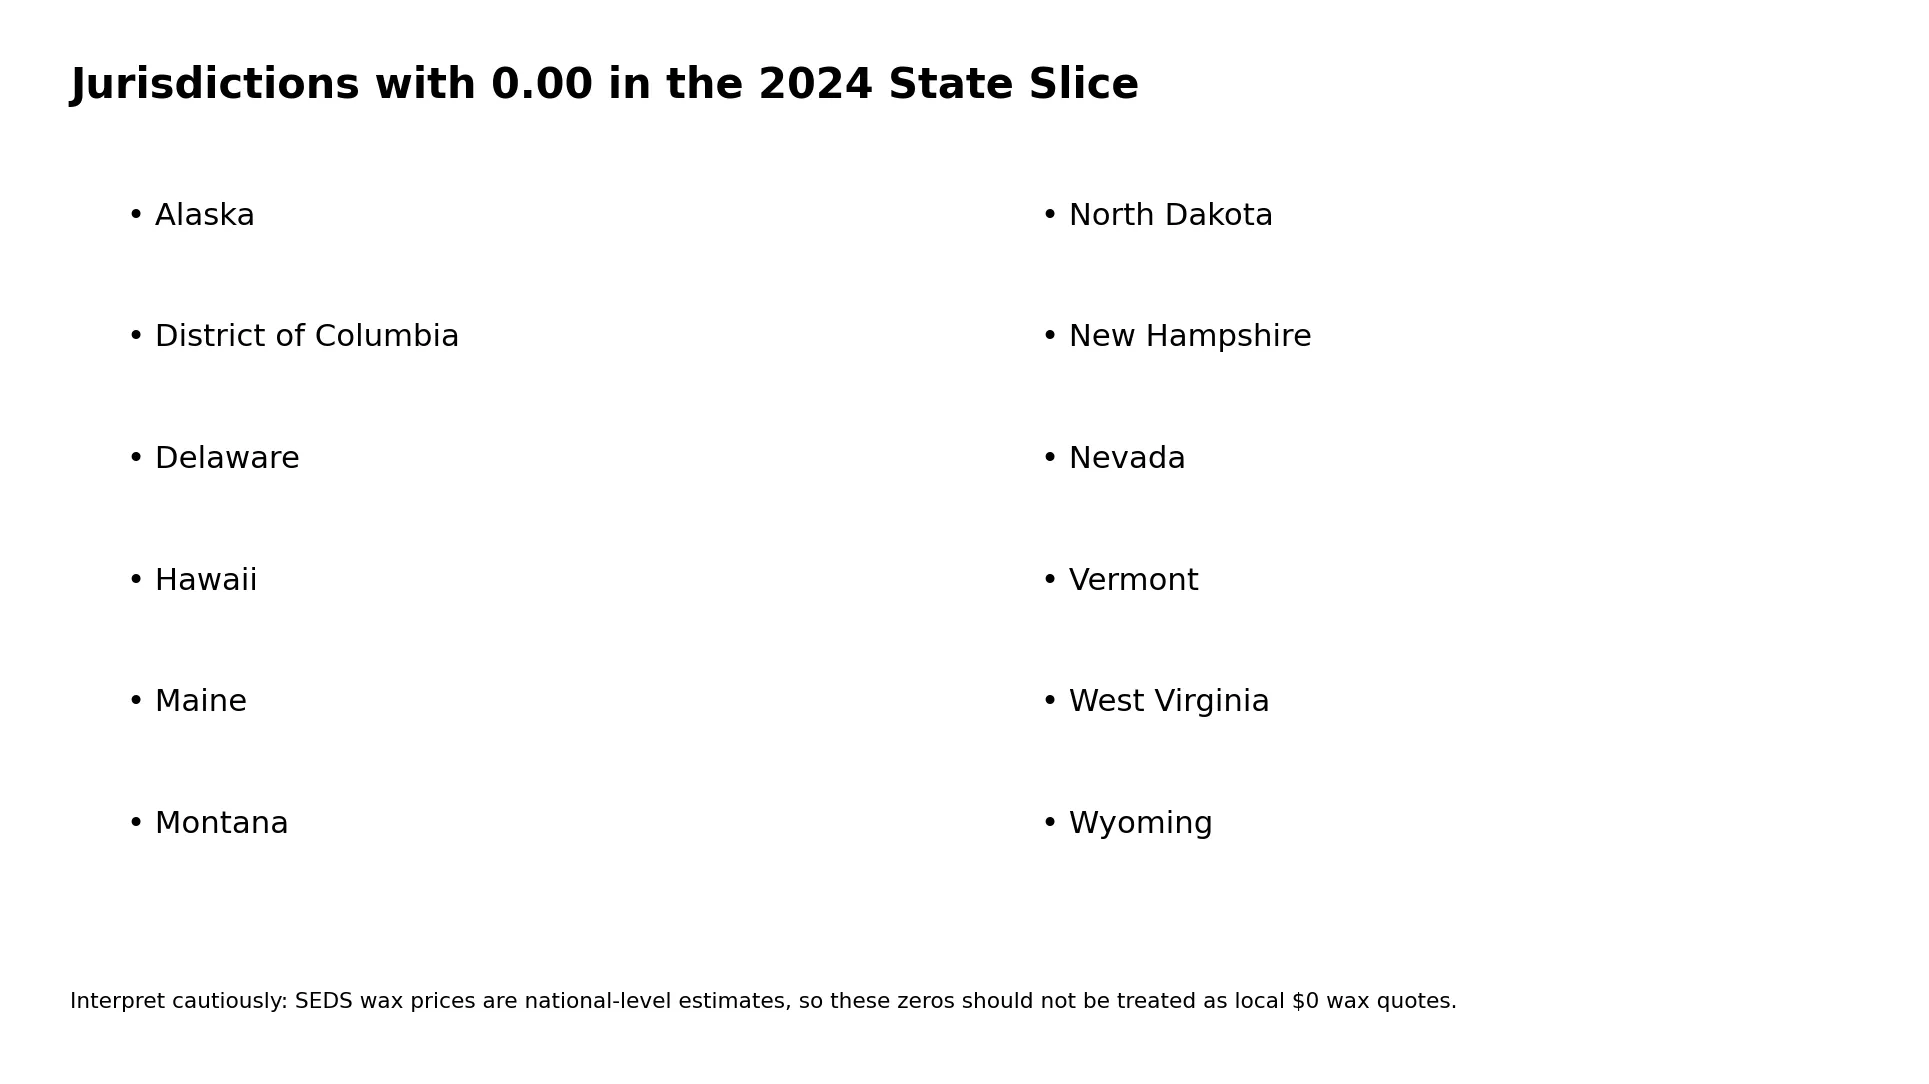
The 0.00 observations are Alaska, District of Columbia, Delaware, Hawaii, Maine, Montana, North Dakota, New Hampshire, Nevada, Vermont, West Virginia, and Wyoming. They should not be described as places where industrial wax was literally free. A zero in a statistical price series can reflect how a price is recorded when the relevant consumption or expenditure entry is not positive or not applicable, rather than a real-world transaction at zero dollars.
The wax-price slice by itself does not contain enough detail to assign a separate causal explanation to every zero. EIA’s broader SEDS documentation distinguishes cases with no consumption or adjustments that remove consumption from expenditure calculations. The cautious interpretation is therefore that these 12 jurisdictions do not have a positive wax-price observation in this 2024 slice.
This distinction matters for descriptive statistics. The simple mean across all 51 values is about $27.80/MMBtu, while the median is $36.36. Neither number should be presented as the U.S. market price for waxes. The mean is pulled down by the twelve zeros, and the median largely reflects that most positive state records share the same national-level price.
Why a state ranking would distort this series
A ranking is useful only when the values contain meaningful variation. Here, every positive observation is identical. Calling one of the 39 positive states “first” and another “thirty-ninth” would be an alphabetical artifact, not an energy-price result. The data support a tie, not an ordering.
The same caution applies at the bottom of the table. The 0.00 jurisdictions should not be labeled the “cheapest wax states” without additional evidence about industrial wax consumption and expenditure. A market-price comparison would require a source that actually measures state-specific wax transactions or prices, which this SEDS series does not do.
All 51 state-level observations for 2024
The table below keeps the original 2024 observations and lists jurisdictions alphabetically rather than inventing a rank. The interpretation column separates the positive national-level price observation from a 0.00 observation. No zero has been converted to missing data, and no value from another year has been substituted.
| State or jurisdiction | Code | Year | EIA value ($/MMBtu) | How to read it |
|---|---|---|---|---|
| Alabama | AL | 2024 | 36.36 | Positive observation using the national-level wax price |
| Alaska | AK | 2024 | 0.00 | 0.00 observation—not a free-market quote |
| Arizona | AZ | 2024 | 36.36 | Positive observation using the national-level wax price |
| Arkansas | AR | 2024 | 36.36 | Positive observation using the national-level wax price |
| California | CA | 2024 | 36.36 | Positive observation using the national-level wax price |
| Colorado | CO | 2024 | 36.36 | Positive observation using the national-level wax price |
| Connecticut | CT | 2024 | 36.36 | Positive observation using the national-level wax price |
| Delaware | DE | 2024 | 0.00 | 0.00 observation—not a free-market quote |
| District of Columbia | DC | 2024 | 0.00 | 0.00 observation—not a free-market quote |
| Florida | FL | 2024 | 36.36 | Positive observation using the national-level wax price |
| Georgia | GA | 2024 | 36.36 | Positive observation using the national-level wax price |
| Hawaii | HI | 2024 | 0.00 | 0.00 observation—not a free-market quote |
| Idaho | ID | 2024 | 36.36 | Positive observation using the national-level wax price |
| Illinois | IL | 2024 | 36.36 | Positive observation using the national-level wax price |
| Indiana | IN | 2024 | 36.36 | Positive observation using the national-level wax price |
| Iowa | IA | 2024 | 36.36 | Positive observation using the national-level wax price |
| Kansas | KS | 2024 | 36.36 | Positive observation using the national-level wax price |
| Kentucky | KY | 2024 | 36.36 | Positive observation using the national-level wax price |
| Louisiana | LA | 2024 | 36.36 | Positive observation using the national-level wax price |
| Maine | ME | 2024 | 0.00 | 0.00 observation—not a free-market quote |
| Maryland | MD | 2024 | 36.36 | Positive observation using the national-level wax price |
| Massachusetts | MA | 2024 | 36.36 | Positive observation using the national-level wax price |
| Michigan | MI | 2024 | 36.36 | Positive observation using the national-level wax price |
| Minnesota | MN | 2024 | 36.36 | Positive observation using the national-level wax price |
| Mississippi | MS | 2024 | 36.36 | Positive observation using the national-level wax price |
| Missouri | MO | 2024 | 36.36 | Positive observation using the national-level wax price |
| Montana | MT | 2024 | 0.00 | 0.00 observation—not a free-market quote |
| Nebraska | NE | 2024 | 36.36 | Positive observation using the national-level wax price |
| Nevada | NV | 2024 | 0.00 | 0.00 observation—not a free-market quote |
| New Hampshire | NH | 2024 | 0.00 | 0.00 observation—not a free-market quote |
| New Jersey | NJ | 2024 | 36.36 | Positive observation using the national-level wax price |
| New Mexico | NM | 2024 | 36.36 | Positive observation using the national-level wax price |
| New York | NY | 2024 | 36.36 | Positive observation using the national-level wax price |
| North Carolina | NC | 2024 | 36.36 | Positive observation using the national-level wax price |
| North Dakota | ND | 2024 | 0.00 | 0.00 observation—not a free-market quote |
| Ohio | OH | 2024 | 36.36 | Positive observation using the national-level wax price |
| Oklahoma | OK | 2024 | 36.36 | Positive observation using the national-level wax price |
| Oregon | OR | 2024 | 36.36 | Positive observation using the national-level wax price |
| Pennsylvania | PA | 2024 | 36.36 | Positive observation using the national-level wax price |
| Rhode Island | RI | 2024 | 36.36 | Positive observation using the national-level wax price |
| South Carolina | SC | 2024 | 36.36 | Positive observation using the national-level wax price |
| South Dakota | SD | 2024 | 36.36 | Positive observation using the national-level wax price |
| Tennessee | TN | 2024 | 36.36 | Positive observation using the national-level wax price |
| Texas | TX | 2024 | 36.36 | Positive observation using the national-level wax price |
| Utah | UT | 2024 | 36.36 | Positive observation using the national-level wax price |
| Vermont | VT | 2024 | 0.00 | 0.00 observation—not a free-market quote |
| Virginia | VA | 2024 | 36.36 | Positive observation using the national-level wax price |
| Washington | WA | 2024 | 36.36 | Positive observation using the national-level wax price |
| West Virginia | WV | 2024 | 0.00 | 0.00 observation—not a free-market quote |
| Wisconsin | WI | 2024 | 36.36 | Positive observation using the national-level wax price |
| Wyoming | WY | 2024 | 0.00 | 0.00 observation—not a free-market quote |
What do the zero jurisdictions look like geographically?
The 12 zeros are spread across several parts of the country rather than forming one simple regional block. The list includes Alaska and Hawaii, several New England states, western states such as Nevada, Montana, and Wyoming, as well as Delaware, District of Columbia, North Dakota, and West Virginia. That geographic scatter is another reason not to infer a single market explanation from the zeros alone.
How this series relates to broader petroleum-price data
Waxes are only one component within the SEDS group of other petroleum products. The broader industrial petroleum tables combine multiple products and, depending on the measure, may show substantial state variation. Those broader series are better suited to questions about geographic differences in industrial petroleum costs. The wax series is more useful for showing how one specialized product is handled in the accounting system.
This difference also explains why a state can have a varied industrial petroleum average price while its wax-price entry is the same 36.36 as many other states. The average petroleum price incorporates other fuels and consumption weights, whereas the wax series carries the national-level wax price wherever the positive observation applies. The two measures answer different questions.
The $/MMBtu unit makes the series technically comparable with other energy-price measures, but economic interpretation still depends on product use. Waxes are industrial petroleum products and can function as process inputs rather than ordinary combustion fuels. A numerical comparison with natural gas, gasoline, or distillate fuel oil should therefore be framed as a price-per-energy-unit comparison, not as proof that the products are close substitutes.
Source and calculation notes
The source is the U.S. Energy Information Administration’s State Energy Data System. EIA’s petroleum price and expenditure technical notes describe the wax categories and the national-level pricing method, while the SEDS data portal provides the state energy series and documentation. The 2024 comparison covers all 50 states plus the District of Columbia.
The counts and percentage on this page are direct calculations from the 51 published state-level observations: 39 positive records at 36.36 and 12 records at 0.00. No missing values were replaced with zeros, and no other year or sector was mixed into the comparison. The page therefore describes the structure of the 2024 SEDS industrial waxes price series rather than estimating local market prices that the source does not provide.
Frequently Asked Questions
How many jurisdictions show $36.36/MMBtu for industrial waxes in 2024?
Thirty-nine of the 51 state-level jurisdictions have the same positive value of $36.36 per million Btu.
Why is the waxes price identical across so many states?
SEDS develops a national-level price for waxes because state-specific price information is not available, so the same positive price is used in many state records.
Does 0.00 mean industrial wax was free in those states?
No. The zero should be treated as the absence of a positive price observation in this state slice, not as a real-world free-market quote.
Can the series rank states from most to least expensive?
Not meaningfully. Every positive observation is $36.36/MMBtu, so the 39 positive jurisdictions are tied rather than ordered by price.
Related Articles
Green Map creates custom-edited map images using open geographic data sources such as geoBoundaries, Natural Earth, OpenStreetMap, and government open data. These maps are edited visual materials, not raw data files, and are provided for education, documents, presentations, and graphic reference.