U.S. Energy Information Administration State Energy Data System data report 2024 total energy consumption in the commercial sector for all 50 states plus the District of Columbia. The unit is Billion Btu. Texas is highest at 1,518,752 Billion Btu, Vermont is lowest at 23,359 Billion Btu, and the median across the 51 jurisdictions is 226,662 Billion Btu.
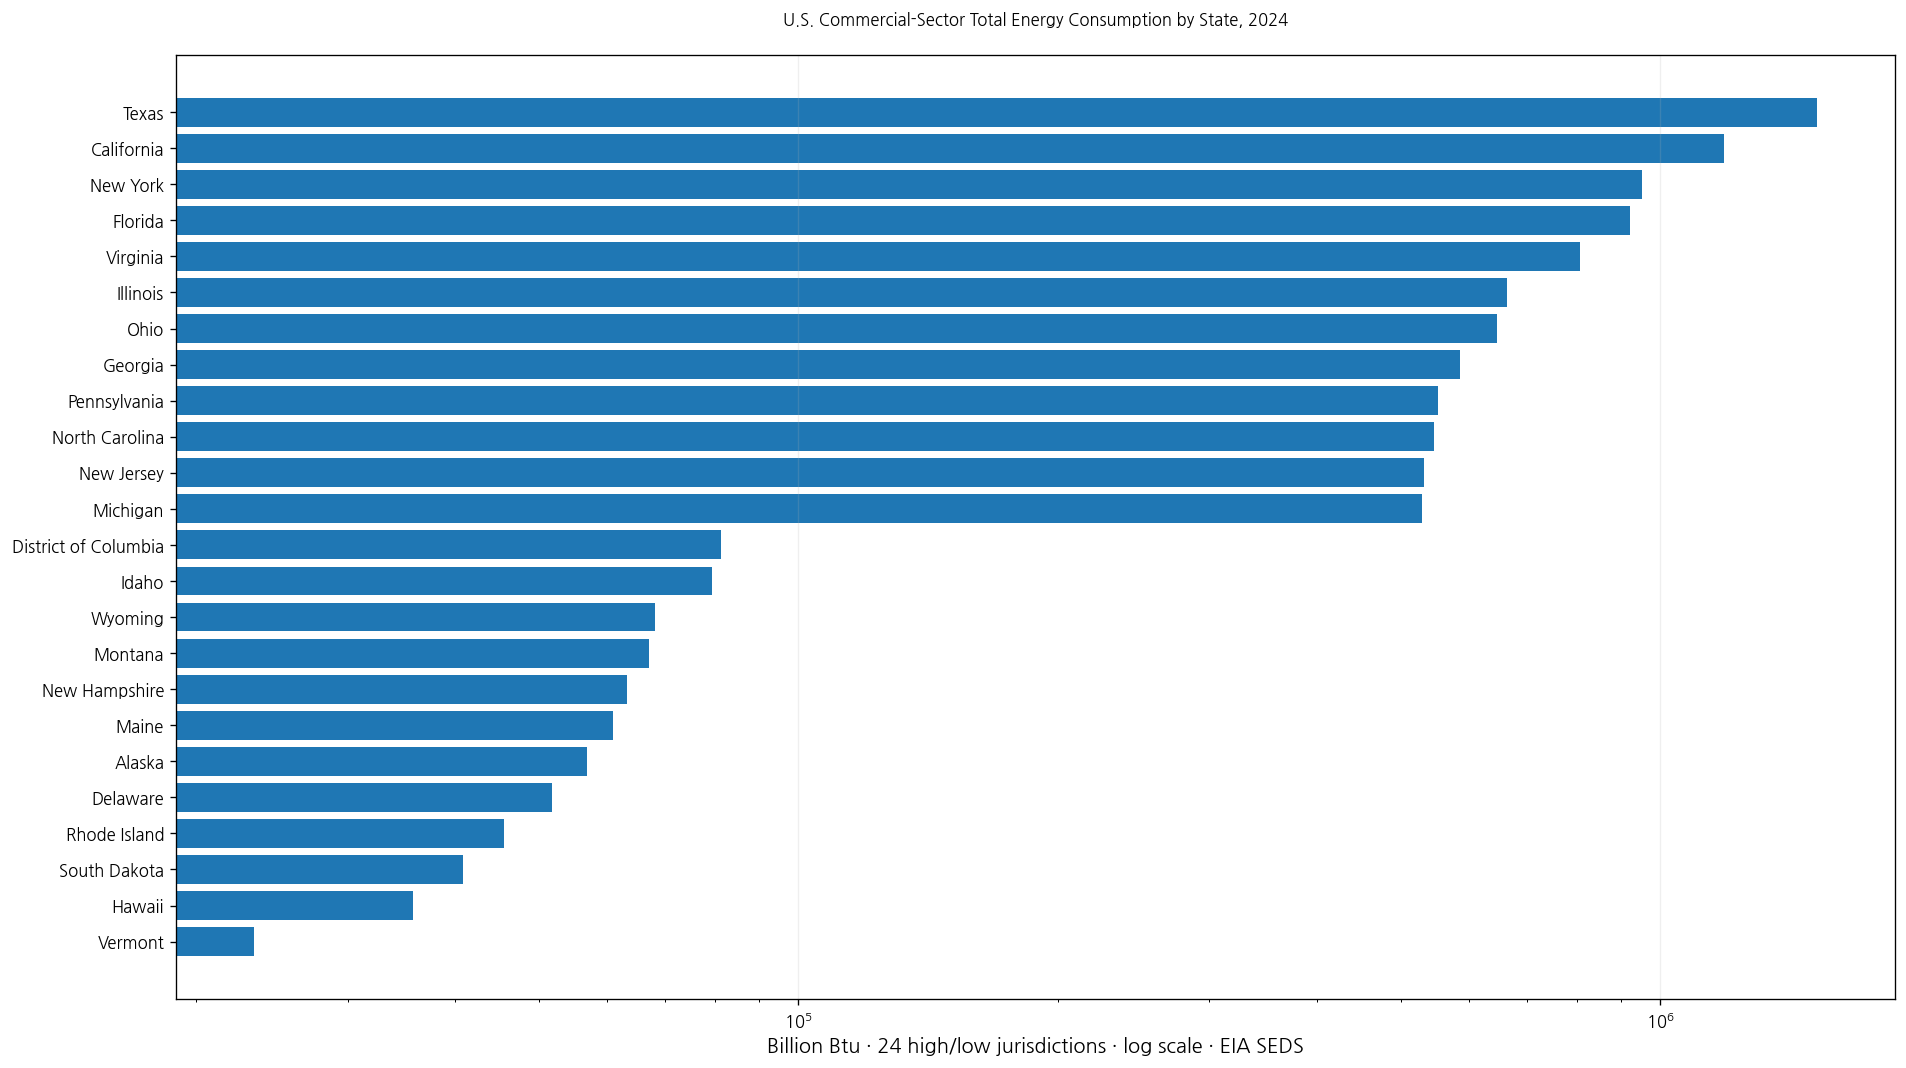
Table of Contents
What commercial-sector total energy consumption measures
This indicator reports the total amount of energy consumed in the commercial sector of each state. The commercial sector generally includes energy use associated with offices, retail establishments, schools, hospitals, lodging, religious facilities, and other nonmanufacturing service buildings and activities.
It is an energy-quantity measure rather than a price or expenditure measure. The number does not tell us what users paid, and it does not reveal the contribution of individual fuels unless it is combined with separate fuel-specific series.
How to read Billion Btu
A Btu is a British thermal unit, and one Billion Btu equals one billion Btu. Large state totals can also be expressed in trillion Btu. Texas, for example, records 1,518,752 Billion Btu, or about 1,518.8 trillion Btu.
Using a common energy unit allows energy from different sources to be aggregated into one total. Changing the display from Billion Btu to trillion Btu only rescales the number; it does not change the underlying consumption.
The 2024 median is 226,662 Billion Btu
The simple mean across the 51 jurisdictions is 322,510 Billion Btu, while the median is 226,662 Billion Btu. The first quartile is 103,378 Billion Btu and the third quartile 389,983 Billion Btu, placing the middle half roughly between 103,378 and 389,983 Billion Btu.
12 jurisdictions consume at least 500,000 Billion Btu, and 2 exceed one million Billion Btu. At the lower end, 13 are below 100,000 and 4 are below 50,000 Billion Btu. The high-end states pull the mean well above the median.
Texas is highest at 1,518,752 Billion Btu
Texas records the largest 2024 commercial-sector total at 1,518,752 Billion Btu. California follows at 1,184,912, New York at 952,597, Florida at 922,680, and Virginia at 808,092. Illinois, Ohio, Georgia, Pennsylvania, North Carolina, New Jersey, and Michigan also exceed 500,000 Billion Btu.
| 2024 rank | State/jurisdiction | Commercial-sector total energy consumption |
|---|---|---|
| 1 | Texas | 1,518,752 Billion Btu |
| 2 | California | 1,184,912 Billion Btu |
| 3 | New York | 952,597 Billion Btu |
| 4 | Florida | 922,680 Billion Btu |
| 5 | Virginia | 808,092 Billion Btu |
| 6 | Illinois | 664,329 Billion Btu |
| 7 | Ohio | 647,327 Billion Btu |
| 8 | Georgia | 585,718 Billion Btu |
| 9 | Pennsylvania | 552,237 Billion Btu |
| 10 | North Carolina | 547,195 Billion Btu |
| 11 | New Jersey | 531,533 Billion Btu |
| 12 | Michigan | 529,446 Billion Btu |
| 13 | Tennessee | 411,570 Billion Btu |
| 14 | Arizona | 368,396 Billion Btu |
| 15 | Missouri | 367,354 Billion Btu |
A high total does not automatically mean poor energy efficiency. Absolute consumption is strongly influenced by the scale of commercial activity, population, building stock, employment, climate, and the types of services operating in the state.
Vermont is lowest at 23,359 Billion Btu
Vermont records the smallest value at 23,359 Billion Btu, followed by Hawaii at 35,704, South Dakota at 40,834, Rhode Island at 45,612, and Delaware at 51,825. Alaska, Maine, New Hampshire, Montana, and Wyoming also remain below 70,000 Billion Btu.
| Low-order position | State/jurisdiction | Commercial-sector total energy consumption |
|---|---|---|
| 1 | Vermont | 23,359 Billion Btu |
| 2 | Hawaii | 35,704 Billion Btu |
| 3 | South Dakota | 40,834 Billion Btu |
| 4 | Rhode Island | 45,612 Billion Btu |
| 5 | Delaware | 51,825 Billion Btu |
| 6 | Alaska | 56,804 Billion Btu |
| 7 | Maine | 61,028 Billion Btu |
| 8 | New Hampshire | 63,218 Billion Btu |
| 9 | Montana | 67,182 Billion Btu |
| 10 | Wyoming | 68,231 Billion Btu |
| 11 | Idaho | 79,421 Billion Btu |
| 12 | District of Columbia | 81,297 Billion Btu |
| 13 | New Mexico | 99,725 Billion Btu |
| 14 | West Virginia | 107,031 Billion Btu |
| 15 | North Dakota | 118,715 Billion Btu |
A low total should not be interpreted as proof of greater efficiency. A smaller population, smaller commercial building stock, or lower level of service-sector activity can naturally produce a smaller absolute total.
The highest value is about 65 times the lowest
Texas consumes about 65.0 times as much commercial-sector energy as Vermont in this dataset. The absolute difference is roughly 1,495,393 Billion Btu. Because the range is so wide, the featured chart uses a logarithmic axis.
This spread highlights how different state-scale commercial energy systems are. It does not, by itself, identify which underlying factor explains the gap.
Absolute consumption is different from per-capita or intensity measures
Texas ranking first in total consumption does not mean it would rank first in consumption per person, per business, per square foot of commercial floor space, or per dollar of state economic output.
Efficiency and energy intensity require a denominator. Population, floor area, employment, or economic output could all be used for different analytical purposes, but those denominators are not part of this dataset.
Commercial and industrial energy use should remain separate
Manufacturing plants and large industrial processes are generally associated with the industrial sector rather than the commercial sector. Commercial totals are dominated by service and institutional activity.
A state with very large industrial energy use does not necessarily rank the same way in commercial energy consumption. Sector identity is therefore essential when comparing energy indicators.
Total energy consumption and total end-use consumption can be different series
EIA datasets can contain similarly named series such as total energy consumption and total end-use consumption. They should not be assumed to be identical simply because both use Btu units.
This article keeps the supplied indicator name, Total energy consumption in the commercial sector, and does not substitute a different EIA aggregation concept.
Consumption and energy prices answer different questions
Consumption measures the quantity of energy used. Prices measure the monetary cost per unit of energy. A state can have very high consumption and relatively low prices, or low consumption and relatively high prices.
Understanding commercial energy expenditure requires both quantity and price information, ideally broken out by fuel and electricity category.
All 51 jurisdictions are aligned to 2024
Every state and the District of Columbia has a 2024 value. There are no missing rows and no reported zeros, so rankings and distribution statistics compare a complete same-year set.
This makes cross-state comparison straightforward. It does not, however, establish whether a state’s energy use is rising or falling over time.
One year cannot establish a trend
A 2024 snapshot tells us which states have larger and smaller commercial-sector totals at that point in time. A trend requires the same indicator across multiple years.
Year-over-year analysis should keep the sector definition, unit, and series identity constant so that changes are not caused by switching indicators.
The simple state mean is not a national-average concept
The arithmetic mean of the 51 state-jurisdiction totals is 322,510 Billion Btu. Because this is an absolute quantity series, that mean is best interpreted as a descriptive statistic for a typical jurisdiction rather than an official U.S. average.
Adding the 51 rows gives 16.448 quadrillion Btu, but this article does not label that sum as an official U.S. aggregate. For a national total, the dedicated EIA U.S. aggregate series should take precedence.
Complete 2024 state list
The table below lists all 50 states and the District of Columbia alphabetically. Every row is from 2024 and the unit is Billion Btu.
| State/jurisdiction | Code | Year | Commercial-sector total energy consumption |
|---|---|---|---|
| Alabama | AL | 2024 | 241,935 Billion Btu |
| Alaska | AK | 2024 | 56,804 Billion Btu |
| Arizona | AZ | 2024 | 368,396 Billion Btu |
| Arkansas | AR | 2024 | 169,256 Billion Btu |
| California | CA | 2024 | 1,184,912 Billion Btu |
| Colorado | CO | 2024 | 238,434 Billion Btu |
| Connecticut | CT | 2024 | 177,835 Billion Btu |
| Delaware | DE | 2024 | 51,825 Billion Btu |
| District of Columbia | DC | 2024 | 81,297 Billion Btu |
| Florida | FL | 2024 | 922,680 Billion Btu |
| Georgia | GA | 2024 | 585,718 Billion Btu |
| Hawaii | HI | 2024 | 35,704 Billion Btu |
| Idaho | ID | 2024 | 79,421 Billion Btu |
| Illinois | IL | 2024 | 664,329 Billion Btu |
| Indiana | IN | 2024 | 329,360 Billion Btu |
| Iowa | IA | 2024 | 133,505 Billion Btu |
| Kansas | KS | 2024 | 162,775 Billion Btu |
| Kentucky | KY | 2024 | 250,456 Billion Btu |
| Louisiana | LA | 2024 | 226,037 Billion Btu |
| Maine | ME | 2024 | 61,028 Billion Btu |
| Maryland | MD | 2024 | 346,723 Billion Btu |
| Massachusetts | MA | 2024 | 348,137 Billion Btu |
| Michigan | MI | 2024 | 529,446 Billion Btu |
| Minnesota | MN | 2024 | 299,596 Billion Btu |
| Mississippi | MS | 2024 | 144,570 Billion Btu |
| Missouri | MO | 2024 | 367,354 Billion Btu |
| Montana | MT | 2024 | 67,182 Billion Btu |
| Nebraska | NE | 2024 | 147,598 Billion Btu |
| Nevada | NV | 2024 | 136,476 Billion Btu |
| New Hampshire | NH | 2024 | 63,218 Billion Btu |
| New Jersey | NJ | 2024 | 531,533 Billion Btu |
| New Mexico | NM | 2024 | 99,725 Billion Btu |
| New York | NY | 2024 | 952,597 Billion Btu |
| North Carolina | NC | 2024 | 547,195 Billion Btu |
| North Dakota | ND | 2024 | 118,715 Billion Btu |
| Ohio | OH | 2024 | 647,327 Billion Btu |
| Oklahoma | OK | 2024 | 226,662 Billion Btu |
| Oregon | OR | 2024 | 179,633 Billion Btu |
| Pennsylvania | PA | 2024 | 552,237 Billion Btu |
| Rhode Island | RI | 2024 | 45,612 Billion Btu |
| South Carolina | SC | 2024 | 305,730 Billion Btu |
| South Dakota | SD | 2024 | 40,834 Billion Btu |
| Tennessee | TN | 2024 | 411,570 Billion Btu |
| Texas | TX | 2024 | 1,518,752 Billion Btu |
| Utah | UT | 2024 | 183,592 Billion Btu |
| Vermont | VT | 2024 | 23,359 Billion Btu |
| Virginia | VA | 2024 | 808,092 Billion Btu |
| Washington | WA | 2024 | 267,811 Billion Btu |
| West Virginia | WV | 2024 | 107,031 Billion Btu |
| Wisconsin | WI | 2024 | 339,768 Billion Btu |
| Wyoming | WY | 2024 | 68,231 Billion Btu |
How to interpret the comparison
First, this is an absolute energy-consumption measure, so state size matters. Second, it is not a price or spending measure. Third, it is not a per-capita or efficiency indicator. Fourth, commercial energy use should not be mixed with industrial or residential consumption.
Fifth, similarly named total end-use series should be checked separately. Sixth, same-year coverage supports cross-state comparison but not a time trend. Seventh, the state differences should not be assigned a single cause without additional evidence.
Source and calculation
The source is the U.S. Energy Information Administration State Energy Data System (SEDS), indicator BULK_382D53EC52427A11C3C47C095A29C317. Statistics and rankings use all 51 official 2024 observations for the 50 states and District of Columbia.
Frequently Asked Questions
Does higher commercial energy consumption mean lower energy efficiency?
No. Absolute consumption is strongly affected by state size, commercial building stock, activity, and climate. Efficiency requires an appropriate denominator.
Which jurisdictions are highest and lowest in 2024?
Texas is highest at 1,518,752 Billion Btu and Vermont is lowest at 23,359 Billion Btu.
Is this a price or expenditure measure?
No. It measures the quantity of energy consumed. Expenditure analysis requires consumption and price information together.
Related Articles
Green Map creates custom-edited map images using open geographic data sources such as geoBoundaries, Natural Earth, OpenStreetMap, and government open data. These maps are edited visual materials, not raw data files, and are provided for education, documents, presentations, and graphic reference.