The Human Development Index (HDI) summarizes development through health, education and living standards rather than income alone. The UNDP Human Development Report 2025 data contain 193 country and territory observations for 2023. The highest value is Iceland at 0.972 and the lowest is South Sudan at 0.388. The median is 0.762 and the unweighted mean is about 0.741. Because every observation refers to 2023, this comparison does not mix countries whose latest available years differ.
HDI values run on a 0-to-1 index, but they are not percentages. UNDP measures health with life expectancy at birth, education with expected years of schooling and mean years of schooling, and living standards with gross national income per person. Those indicators are normalized into dimension indices and then combined with a geometric mean. The geometric mean limits the extent to which a very strong result in one dimension can compensate for a weak result in another.
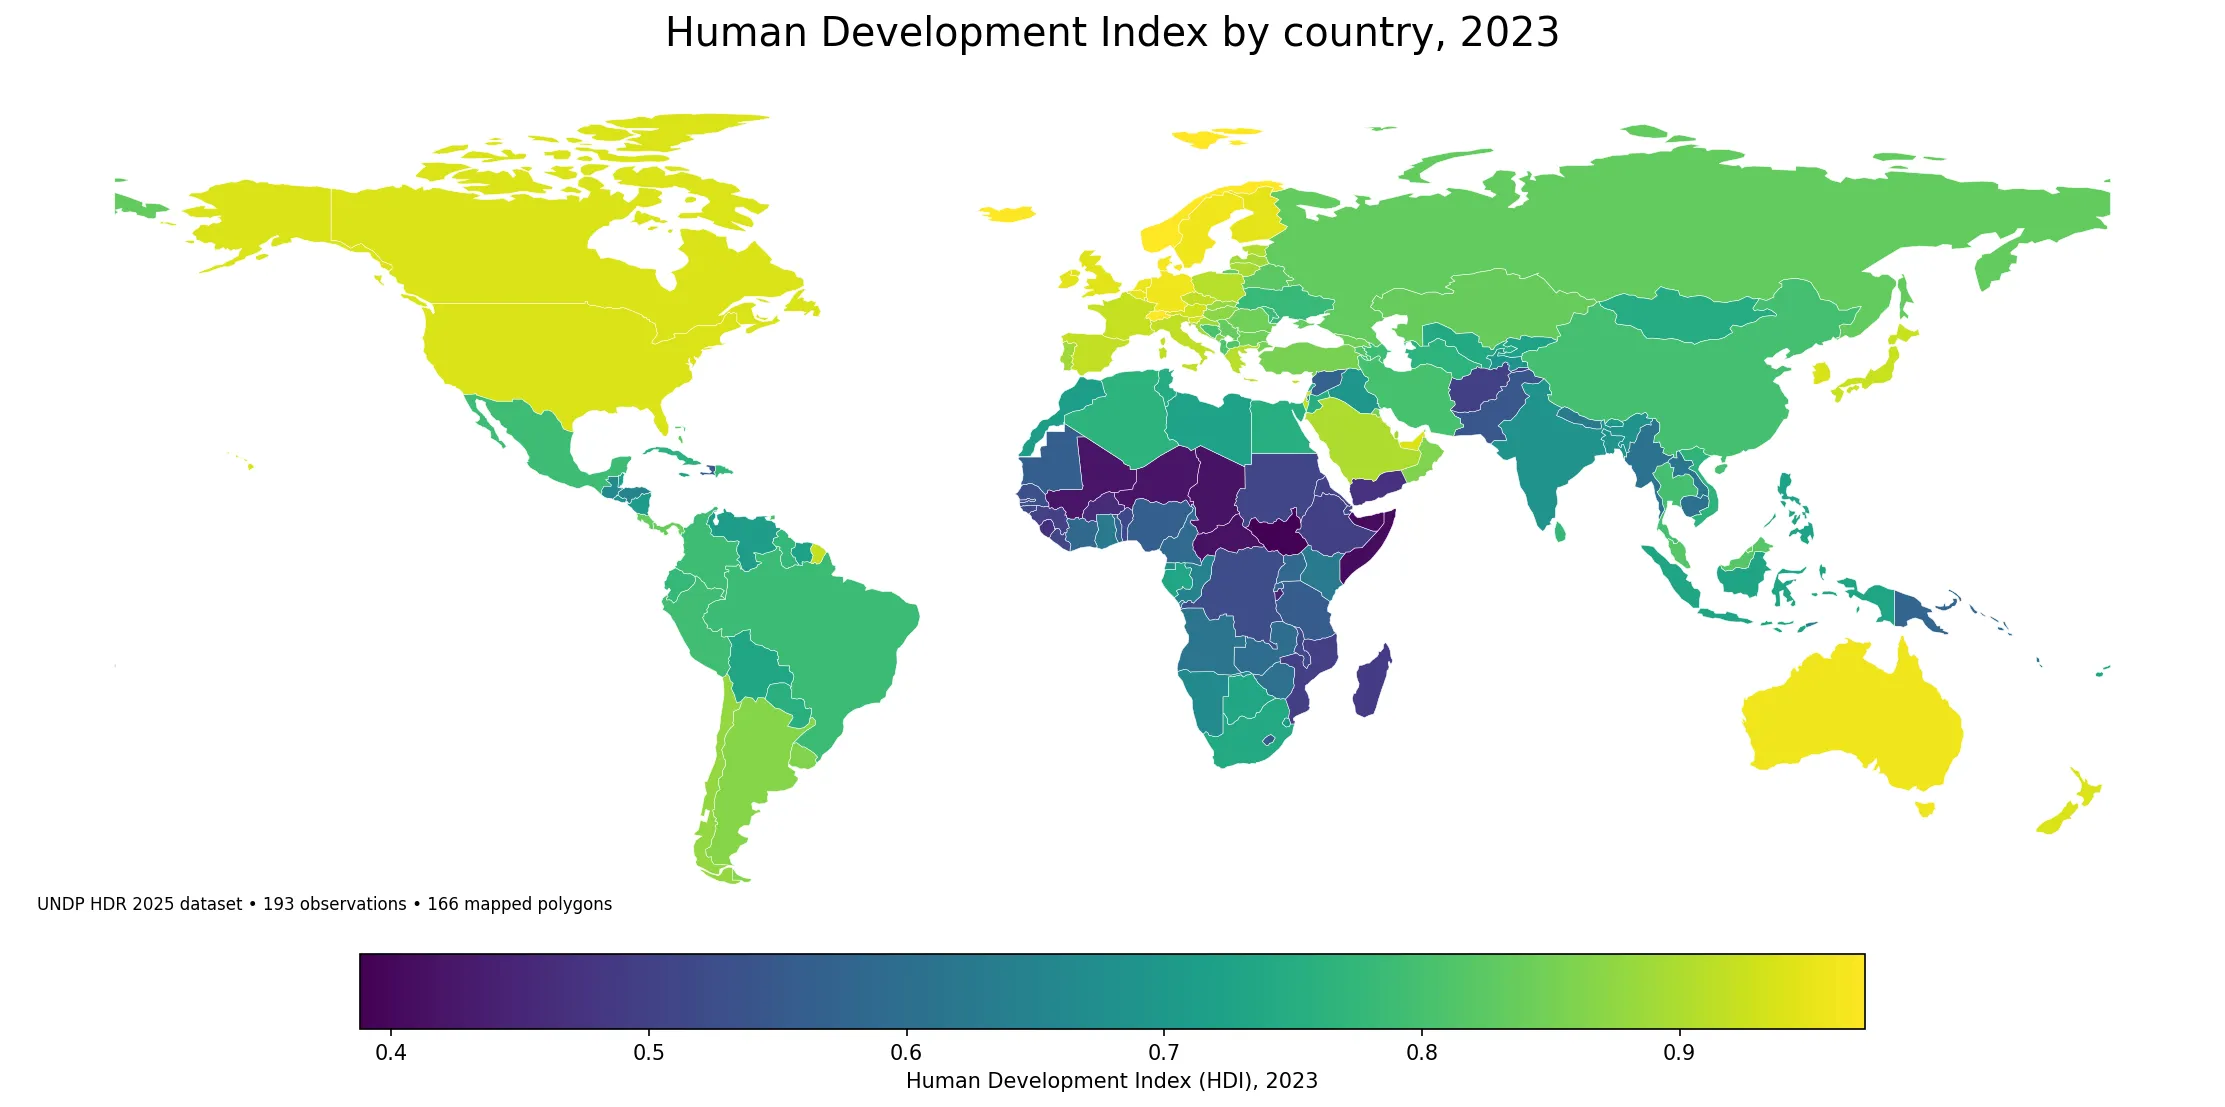
Table of Contents
How the Human Development Index is calculated
The health dimension uses life expectancy at birth. The education dimension combines expected years of schooling for children entering school with mean years of schooling among adults aged 25 and older. The standard-of-living dimension uses GNI per capita adjusted for purchasing power. In the 2025 technical notes, UNDP uses goalposts of 20 to 85 years for life expectancy, 0 to 18 years for expected schooling, 0 to 15 years for mean schooling, and $100 to $75,000 in 2021 PPP terms for GNI per capita. Income enters the calculation logarithmically so that additional income matters less at very high levels.
That design makes HDI a balanced summary, not a score of every aspect of society. Two countries can reach similar HDI values through different combinations of health, education and income. One may have stronger schooling outcomes but lower income, while another may have high income and weaker health outcomes. For policy analysis, the overall index is most useful when read alongside its three component dimensions.
The top values are tightly clustered near 0.95
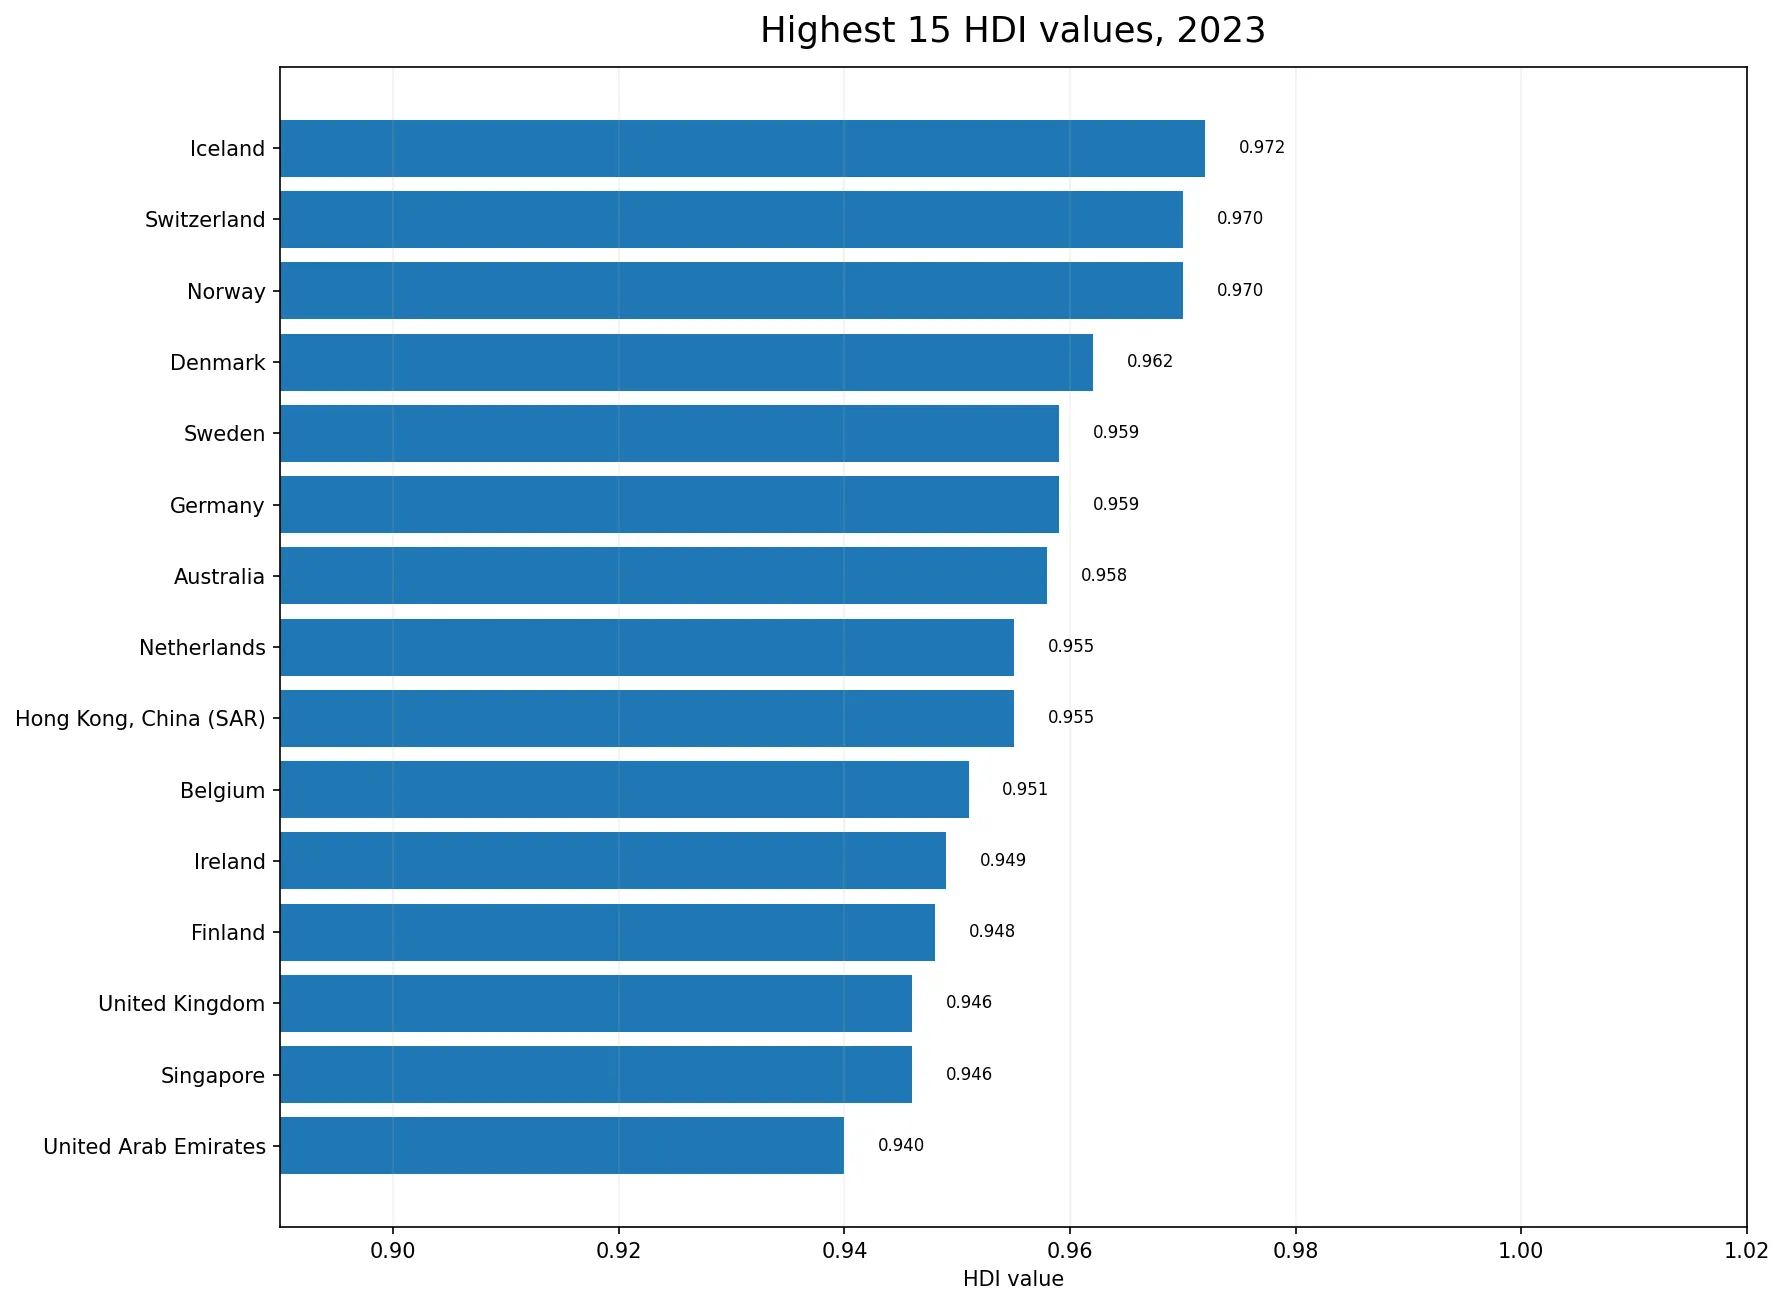
The upper end includes Iceland at 0.972, Norway and Switzerland at 0.970, Denmark at 0.962, Germany and Sweden at 0.959, Australia at 0.958, and Hong Kong, China (SAR) and the Netherlands at 0.955. There are 37 observations at 0.900 or above. Differences near the top are often only a few thousandths, so a small ranking gap should not be treated as a large substantive difference in human development.
The ranking also differs from a ranking of economic size or even income per person. HDI gives health and education equal conceptual status alongside living standards, and the income component is logarithmic and capped. A very high income therefore cannot raise the index without limit. Countries whose health and education outcomes are strong relative to their income can appear higher than a purely income-based ordering would suggest.
The lower end reflects multiple constraints at once
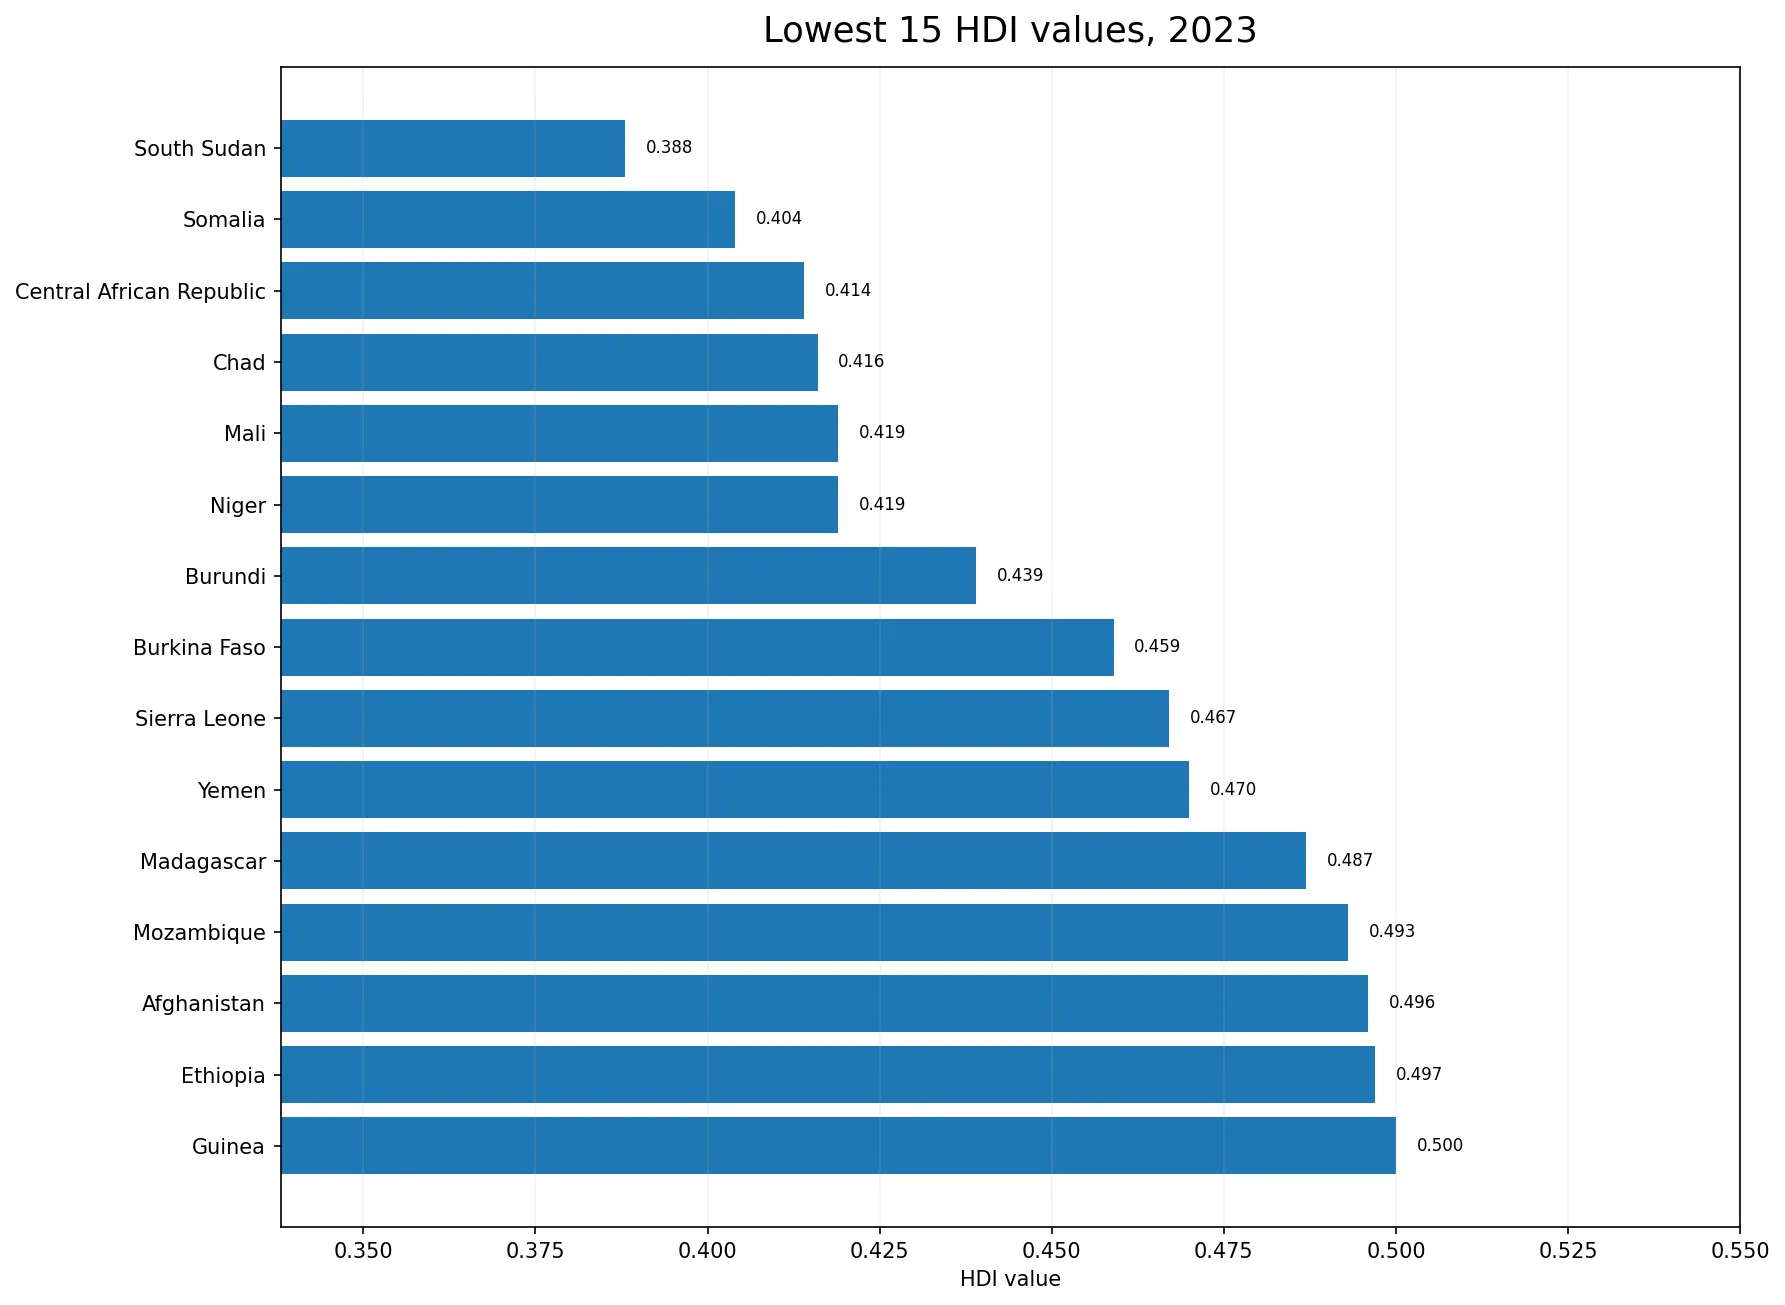
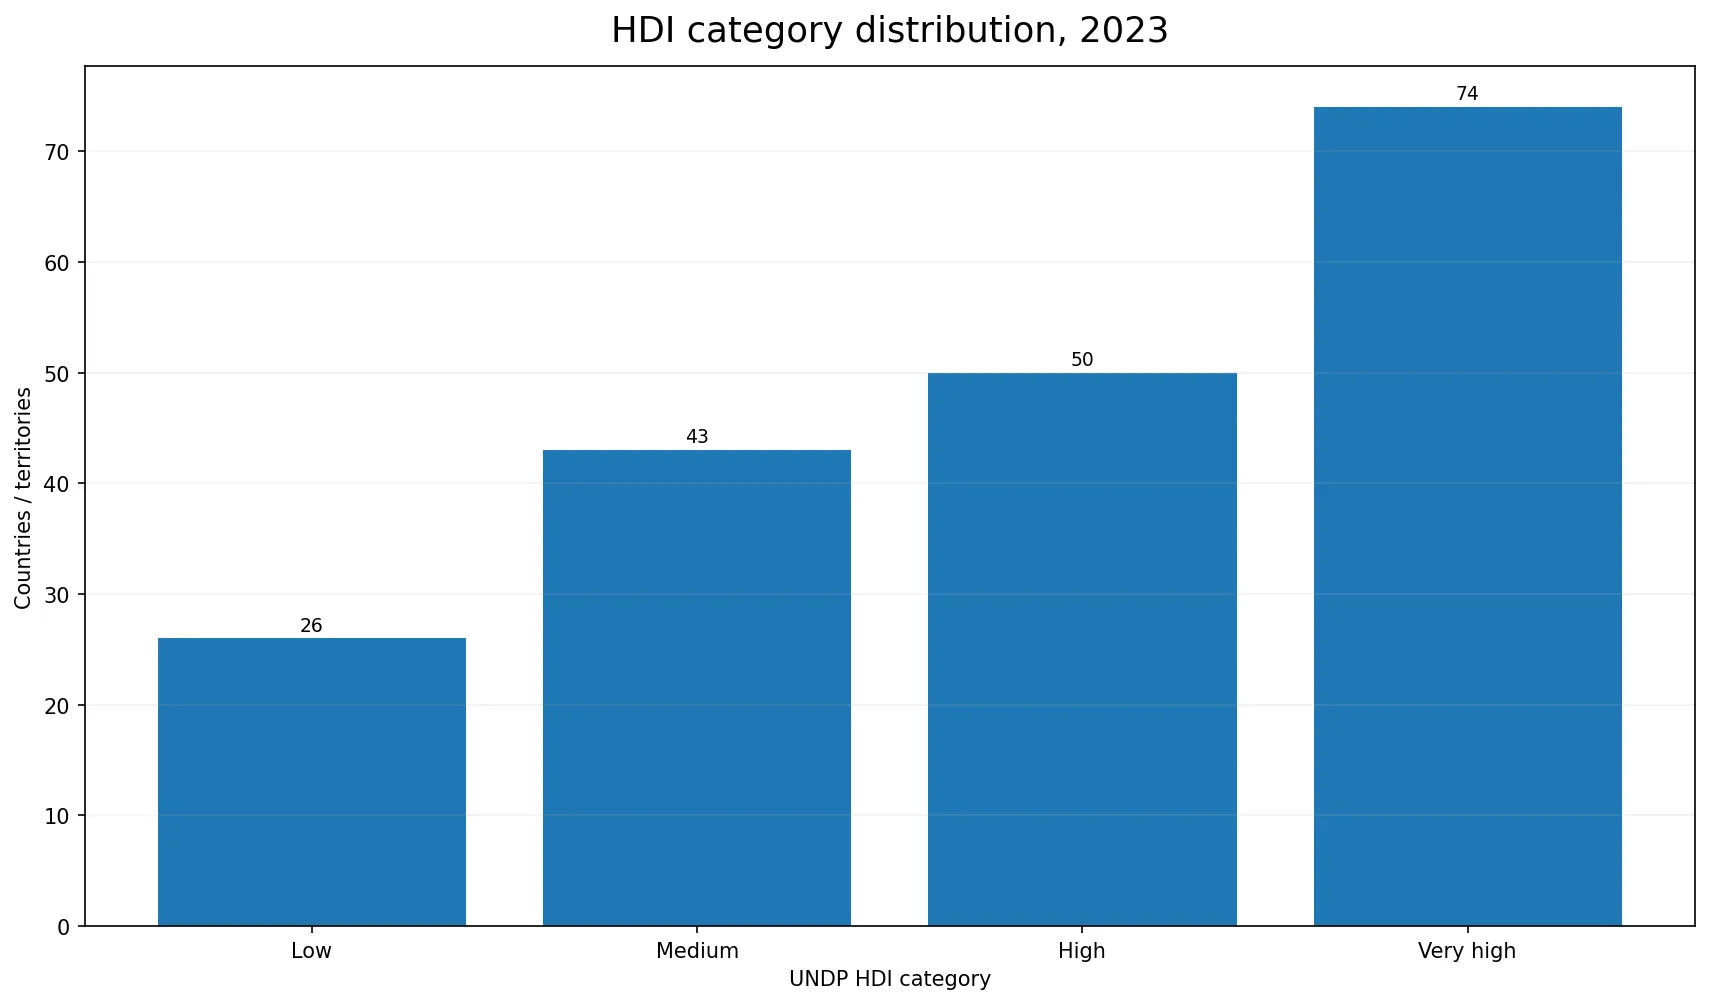
At the lower end, South Sudan is at 0.388, Somalia 0.404, the Central African Republic 0.414, Chad 0.416, Mali and Niger 0.419, and Burundi 0.439. Fourteen observations are below 0.500, while 26 fall below UNDP’s 0.550 threshold for the low human development category. Because HDI combines three dimensions, no single factor can explain a low value by itself.
Conflict, weak access to health and education, low incomes, infrastructure gaps and uneven opportunities can interact. National averages also hide distribution within countries. A rising national HDI does not prove that every region or population group improved equally. Measures such as the Inequality-adjusted Human Development Index are needed when the distribution of achievement matters.
The four UNDP categories make the distribution easier to read
Using UNDP’s current thresholds, the 193 observations divide into 74 very high (0.800 or above), 50 high (0.700–0.799), 43 medium (0.550–0.699) and 26 low (below 0.550) human development. The very high group is the largest single category, but the medium and low groups together still account for 69 observations.
The first quartile is 0.622 and the third quartile 0.862, placing the middle half of observations between those values. The median of 0.762 falls within the high category, while the mean of 0.741 is lower than the median. That difference reflects the long lower tail: very low observations pull the arithmetic mean down more than they affect the median.
Major economies within the full distribution
Examples among large economies include Germany at 0.959, Australia 0.958, the United States 0.938, Japan 0.925, France 0.920, China 0.797, Brazil 0.786 and India 0.685. These comparisons illustrate why HDI is not simply an income ranking. They also show why national averages should be followed by subnational and demographic analysis, especially in large countries where regional and social gaps can be substantial.
The simple mean of 0.741 across 193 rows is not the HDI of the average person in the world. Each country receives equal weight in that mean, regardless of population. A small state and a country with more than a billion people each contribute one observation. Population-weighted measures answer a different question and would require explicit population weights.
What HDI leaves out
HDI is deliberately compact, which is both its strength and its limitation. It does not directly measure political freedom, personal security, housing quality, environmental pressure, mental health, wealth distribution, gender inequality or the intensity of poverty. UNDP explicitly notes that HDI captures only part of human development and that a fuller assessment requires other indicators and complementary indices.
The same caution applies to the components. More years of schooling do not automatically imply equal education quality. High life expectancy does not describe healthy life expectancy or financial protection from medical costs. GNI per capita does not reveal how income is distributed across households. HDI is therefore a useful starting point for comparison, not a complete verdict on how well people live.
A 2023 snapshot should not be confused with a trend
This article compares one common year. It cannot by itself show which countries are improving fastest, stagnating or declining. Trend analysis requires a consistent time series and attention to revisions, because UNDP can update historical values when source data or methods are revised. Comparing values copied from different report editions can introduce artificial changes that do not represent real-world movement.
Rank movements need the same caution. A country’s HDI value can improve while its rank falls if other countries improve faster. Conversely, a nearly unchanged value can move up the ranking when others decline. For evaluating progress, the change in the index and its three component dimensions is generally more informative than rank alone.
All 193 HDI observations for 2023
The table is sorted from the highest to the lowest 2023 HDI value. Differences of only a few thousandths can change rank, so nearby positions should be read as very similar index levels rather than sharply different outcomes.
| Rank | Country / territory | Year | HDI |
|---|---|---|---|
| 1 | Iceland | 2023 | 0.972 |
| 2 | Norway | 2023 | 0.970 |
| 3 | Switzerland | 2023 | 0.970 |
| 4 | Denmark | 2023 | 0.962 |
| 5 | Germany | 2023 | 0.959 |
| 6 | Sweden | 2023 | 0.959 |
| 7 | Australia | 2023 | 0.958 |
| 8 | Hong Kong, China (SAR) | 2023 | 0.955 |
| 9 | Netherlands | 2023 | 0.955 |
| 10 | Belgium | 2023 | 0.951 |
| 11 | Ireland | 2023 | 0.949 |
| 12 | Finland | 2023 | 0.948 |
| 13 | Singapore | 2023 | 0.946 |
| 14 | United Kingdom | 2023 | 0.946 |
| 15 | United Arab Emirates | 2023 | 0.940 |
| 16 | Canada | 2023 | 0.939 |
| 17 | United States | 2023 | 0.938 |
| 18 | Liechtenstein | 2023 | 0.938 |
| 19 | New Zealand | 2023 | 0.938 |
| 20 | Korea (Republic of) | 2023 | 0.937 |
| 21 | Slovenia | 2023 | 0.931 |
| 22 | Austria | 2023 | 0.930 |
| 23 | Japan | 2023 | 0.925 |
| 24 | Malta | 2023 | 0.924 |
| 25 | Luxembourg | 2023 | 0.922 |
| 26 | France | 2023 | 0.920 |
| 27 | Israel | 2023 | 0.919 |
| 28 | Spain | 2023 | 0.918 |
| 29 | Italy | 2023 | 0.915 |
| 30 | San Marino | 2023 | 0.915 |
| 31 | Czechia | 2023 | 0.915 |
| 32 | Cyprus | 2023 | 0.913 |
| 33 | Andorra | 2023 | 0.913 |
| 34 | Greece | 2023 | 0.908 |
| 35 | Poland | 2023 | 0.906 |
| 36 | Estonia | 2023 | 0.905 |
| 37 | Saudi Arabia | 2023 | 0.900 |
| 38 | Bahrain | 2023 | 0.899 |
| 39 | Lithuania | 2023 | 0.895 |
| 40 | Portugal | 2023 | 0.890 |
| 41 | Latvia | 2023 | 0.889 |
| 42 | Croatia | 2023 | 0.889 |
| 43 | Qatar | 2023 | 0.886 |
| 44 | Slovakia | 2023 | 0.880 |
| 45 | Chile | 2023 | 0.878 |
| 46 | Hungary | 2023 | 0.870 |
| 47 | Argentina | 2023 | 0.865 |
| 48 | Montenegro | 2023 | 0.862 |
| 49 | Uruguay | 2023 | 0.862 |
| 50 | Oman | 2023 | 0.858 |
| 51 | Türkiye | 2023 | 0.853 |
| 52 | Kuwait | 2023 | 0.852 |
| 53 | Antigua and Barbuda | 2023 | 0.851 |
| 54 | Seychelles | 2023 | 0.848 |
| 55 | Bulgaria | 2023 | 0.845 |
| 56 | Romania | 2023 | 0.845 |
| 57 | Georgia | 2023 | 0.844 |
| 58 | Saint Kitts and Nevis | 2023 | 0.840 |
| 59 | Panama | 2023 | 0.839 |
| 60 | Brunei Darussalam | 2023 | 0.837 |
| 61 | Kazakhstan | 2023 | 0.837 |
| 62 | Serbia | 2023 | 0.833 |
| 63 | Costa Rica | 2023 | 0.833 |
| 64 | Russian Federation | 2023 | 0.832 |
| 65 | Belarus | 2023 | 0.824 |
| 66 | Bahamas | 2023 | 0.820 |
| 67 | Malaysia | 2023 | 0.819 |
| 68 | North Macedonia | 2023 | 0.815 |
| 69 | Barbados | 2023 | 0.811 |
| 70 | Armenia | 2023 | 0.811 |
| 71 | Albania | 2023 | 0.810 |
| 72 | Trinidad and Tobago | 2023 | 0.807 |
| 73 | Mauritius | 2023 | 0.806 |
| 74 | Bosnia and Herzegovina | 2023 | 0.804 |
| 75 | Iran (Islamic Republic of) | 2023 | 0.799 |
| 76 | Saint Vincent and the Grenadines | 2023 | 0.798 |
| 77 | Thailand | 2023 | 0.798 |
| 78 | China | 2023 | 0.797 |
| 79 | Peru | 2023 | 0.794 |
| 80 | Grenada | 2023 | 0.791 |
| 81 | Azerbaijan | 2023 | 0.789 |
| 82 | Mexico | 2023 | 0.789 |
| 83 | Colombia | 2023 | 0.788 |
| 84 | Brazil | 2023 | 0.786 |
| 85 | Palau | 2023 | 0.786 |
| 86 | Moldova (Republic of) | 2023 | 0.785 |
| 87 | Ukraine | 2023 | 0.779 |
| 88 | Ecuador | 2023 | 0.777 |
| 89 | Dominican Republic | 2023 | 0.776 |
| 90 | Sri Lanka | 2023 | 0.776 |
| 91 | Guyana | 2023 | 0.776 |
| 92 | Tonga | 2023 | 0.769 |
| 93 | Viet Nam | 2023 | 0.766 |
| 94 | Maldives | 2023 | 0.766 |
| 95 | Turkmenistan | 2023 | 0.764 |
| 96 | Algeria | 2023 | 0.763 |
| 97 | Cuba | 2023 | 0.762 |
| 98 | Dominica | 2023 | 0.761 |
| 99 | Paraguay | 2023 | 0.756 |
| 100 | Egypt | 2023 | 0.754 |
| 101 | Jordan | 2023 | 0.754 |
| 102 | Lebanon | 2023 | 0.752 |
| 103 | Saint Lucia | 2023 | 0.748 |
| 104 | Mongolia | 2023 | 0.747 |
| 105 | Tunisia | 2023 | 0.746 |
| 106 | South Africa | 2023 | 0.741 |
| 107 | Uzbekistan | 2023 | 0.740 |
| 108 | Bolivia (Plurinational State of) | 2023 | 0.733 |
| 109 | Gabon | 2023 | 0.733 |
| 110 | Marshall Islands | 2023 | 0.733 |
| 111 | Botswana | 2023 | 0.731 |
| 112 | Fiji | 2023 | 0.731 |
| 113 | Indonesia | 2023 | 0.728 |
| 114 | Suriname | 2023 | 0.722 |
| 115 | Libya | 2023 | 0.721 |
| 116 | Belize | 2023 | 0.721 |
| 117 | Kyrgyzstan | 2023 | 0.720 |
| 118 | Philippines | 2023 | 0.720 |
| 119 | Jamaica | 2023 | 0.720 |
| 120 | Morocco | 2023 | 0.710 |
| 121 | Venezuela (Bolivarian Republic of) | 2023 | 0.709 |
| 122 | Samoa | 2023 | 0.708 |
| 123 | Nicaragua | 2023 | 0.706 |
| 124 | Nauru | 2023 | 0.703 |
| 125 | Bhutan | 2023 | 0.698 |
| 126 | Iraq | 2023 | 0.695 |
| 127 | Eswatini (Kingdom of) | 2023 | 0.695 |
| 128 | Tajikistan | 2023 | 0.691 |
| 129 | Tuvalu | 2023 | 0.689 |
| 130 | Bangladesh | 2023 | 0.685 |
| 131 | India | 2023 | 0.685 |
| 132 | El Salvador | 2023 | 0.678 |
| 133 | Equatorial Guinea | 2023 | 0.674 |
| 134 | Palestine, State of | 2023 | 0.674 |
| 135 | Cabo Verde | 2023 | 0.668 |
| 136 | Namibia | 2023 | 0.665 |
| 137 | Guatemala | 2023 | 0.662 |
| 138 | Congo | 2023 | 0.649 |
| 139 | Honduras | 2023 | 0.645 |
| 140 | Kiribati | 2023 | 0.644 |
| 141 | Sao Tome and Principe | 2023 | 0.637 |
| 142 | Timor-Leste | 2023 | 0.634 |
| 143 | Kenya | 2023 | 0.628 |
| 144 | Ghana | 2023 | 0.628 |
| 145 | Nepal | 2023 | 0.622 |
| 146 | Vanuatu | 2023 | 0.621 |
| 147 | Lao People's Democratic Republic | 2023 | 0.617 |
| 148 | Angola | 2023 | 0.616 |
| 149 | Micronesia (Federated States of) | 2023 | 0.615 |
| 150 | Myanmar | 2023 | 0.609 |
| 151 | Cambodia | 2023 | 0.606 |
| 152 | Comoros | 2023 | 0.603 |
| 153 | Zimbabwe | 2023 | 0.598 |
| 154 | Zambia | 2023 | 0.595 |
| 155 | Cameroon | 2023 | 0.588 |
| 156 | Solomon Islands | 2023 | 0.584 |
| 157 | Côte d'Ivoire | 2023 | 0.582 |
| 158 | Uganda | 2023 | 0.582 |
| 159 | Rwanda | 2023 | 0.578 |
| 160 | Papua New Guinea | 2023 | 0.576 |
| 161 | Togo | 2023 | 0.571 |
| 162 | Syrian Arab Republic | 2023 | 0.564 |
| 163 | Mauritania | 2023 | 0.563 |
| 164 | Nigeria | 2023 | 0.560 |
| 165 | Tanzania (United Republic of) | 2023 | 0.555 |
| 166 | Haiti | 2023 | 0.554 |
| 167 | Lesotho | 2023 | 0.550 |
| 168 | Pakistan | 2023 | 0.544 |
| 169 | Senegal | 2023 | 0.530 |
| 170 | Gambia | 2023 | 0.524 |
| 171 | Congo (Democratic Republic of the) | 2023 | 0.522 |
| 172 | Malawi | 2023 | 0.517 |
| 173 | Benin | 2023 | 0.515 |
| 174 | Guinea-Bissau | 2023 | 0.514 |
| 175 | Djibouti | 2023 | 0.513 |
| 176 | Sudan | 2023 | 0.511 |
| 177 | Liberia | 2023 | 0.510 |
| 178 | Eritrea | 2023 | 0.503 |
| 179 | Guinea | 2023 | 0.500 |
| 180 | Ethiopia | 2023 | 0.497 |
| 181 | Afghanistan | 2023 | 0.496 |
| 182 | Mozambique | 2023 | 0.493 |
| 183 | Madagascar | 2023 | 0.487 |
| 184 | Yemen | 2023 | 0.470 |
| 185 | Sierra Leone | 2023 | 0.467 |
| 186 | Burkina Faso | 2023 | 0.459 |
| 187 | Burundi | 2023 | 0.439 |
| 188 | Niger | 2023 | 0.419 |
| 189 | Mali | 2023 | 0.419 |
| 190 | Chad | 2023 | 0.416 |
| 191 | Central African Republic | 2023 | 0.414 |
| 192 | Somalia | 2023 | 0.404 |
| 193 | South Sudan | 2023 | 0.388 |
The main takeaway
Across the 193 observations, HDI ranges from 0.388 to 0.972, with a median of 0.762. The index is valuable because it condenses health, education and living standards into one comparable measure, but it does not measure inequality or every dimension of wellbeing. The most informative interpretation combines the 2023 level with the component indicators, historical trends and complementary measures of inequality, poverty, gender gaps and environmental pressure.
Frequently Asked Questions
What does the Human Development Index measure?
HDI combines life expectancy, education indicators and GNI per capita to summarize average achievement in health, knowledge and living standards.
Which country has the highest 2023 HDI in this dataset?
Iceland is highest at 0.972 among the 193 countries and territories, followed by Norway and Switzerland at 0.970.
Does an HDI of 0.8 mean 80 percent?
No. HDI is a composite index on a 0-to-1 scale created from normalized dimension indices and a geometric mean; it is not a simple percentage.
Can HDI measure overall quality of life by itself?
No. It summarizes health, education and living standards but does not directly measure inequality, poverty, safety, environmental conditions or many other aspects of wellbeing.
Related Articles
Green Map creates custom-edited map images using open geographic data sources such as geoBoundaries, Natural Earth, OpenStreetMap, and government open data. These maps are edited visual materials, not raw data files, and are provided for education, documents, presentations, and graphic reference.