The Netherlands recorded 173,494 deaths in 2025. Across the 12 provinces, Zuid-Holland has the largest count at 34,502, followed by Noord-Brabant at 26,850, Noord-Holland at 26,444, and Gelderland at 21,737. The provincial total adds exactly to the national CBS figure. That ranking answers a question about annual headcounts, not about individual mortality risk: a populous province can record many more deaths even when its deaths per 1,000 residents are relatively low.
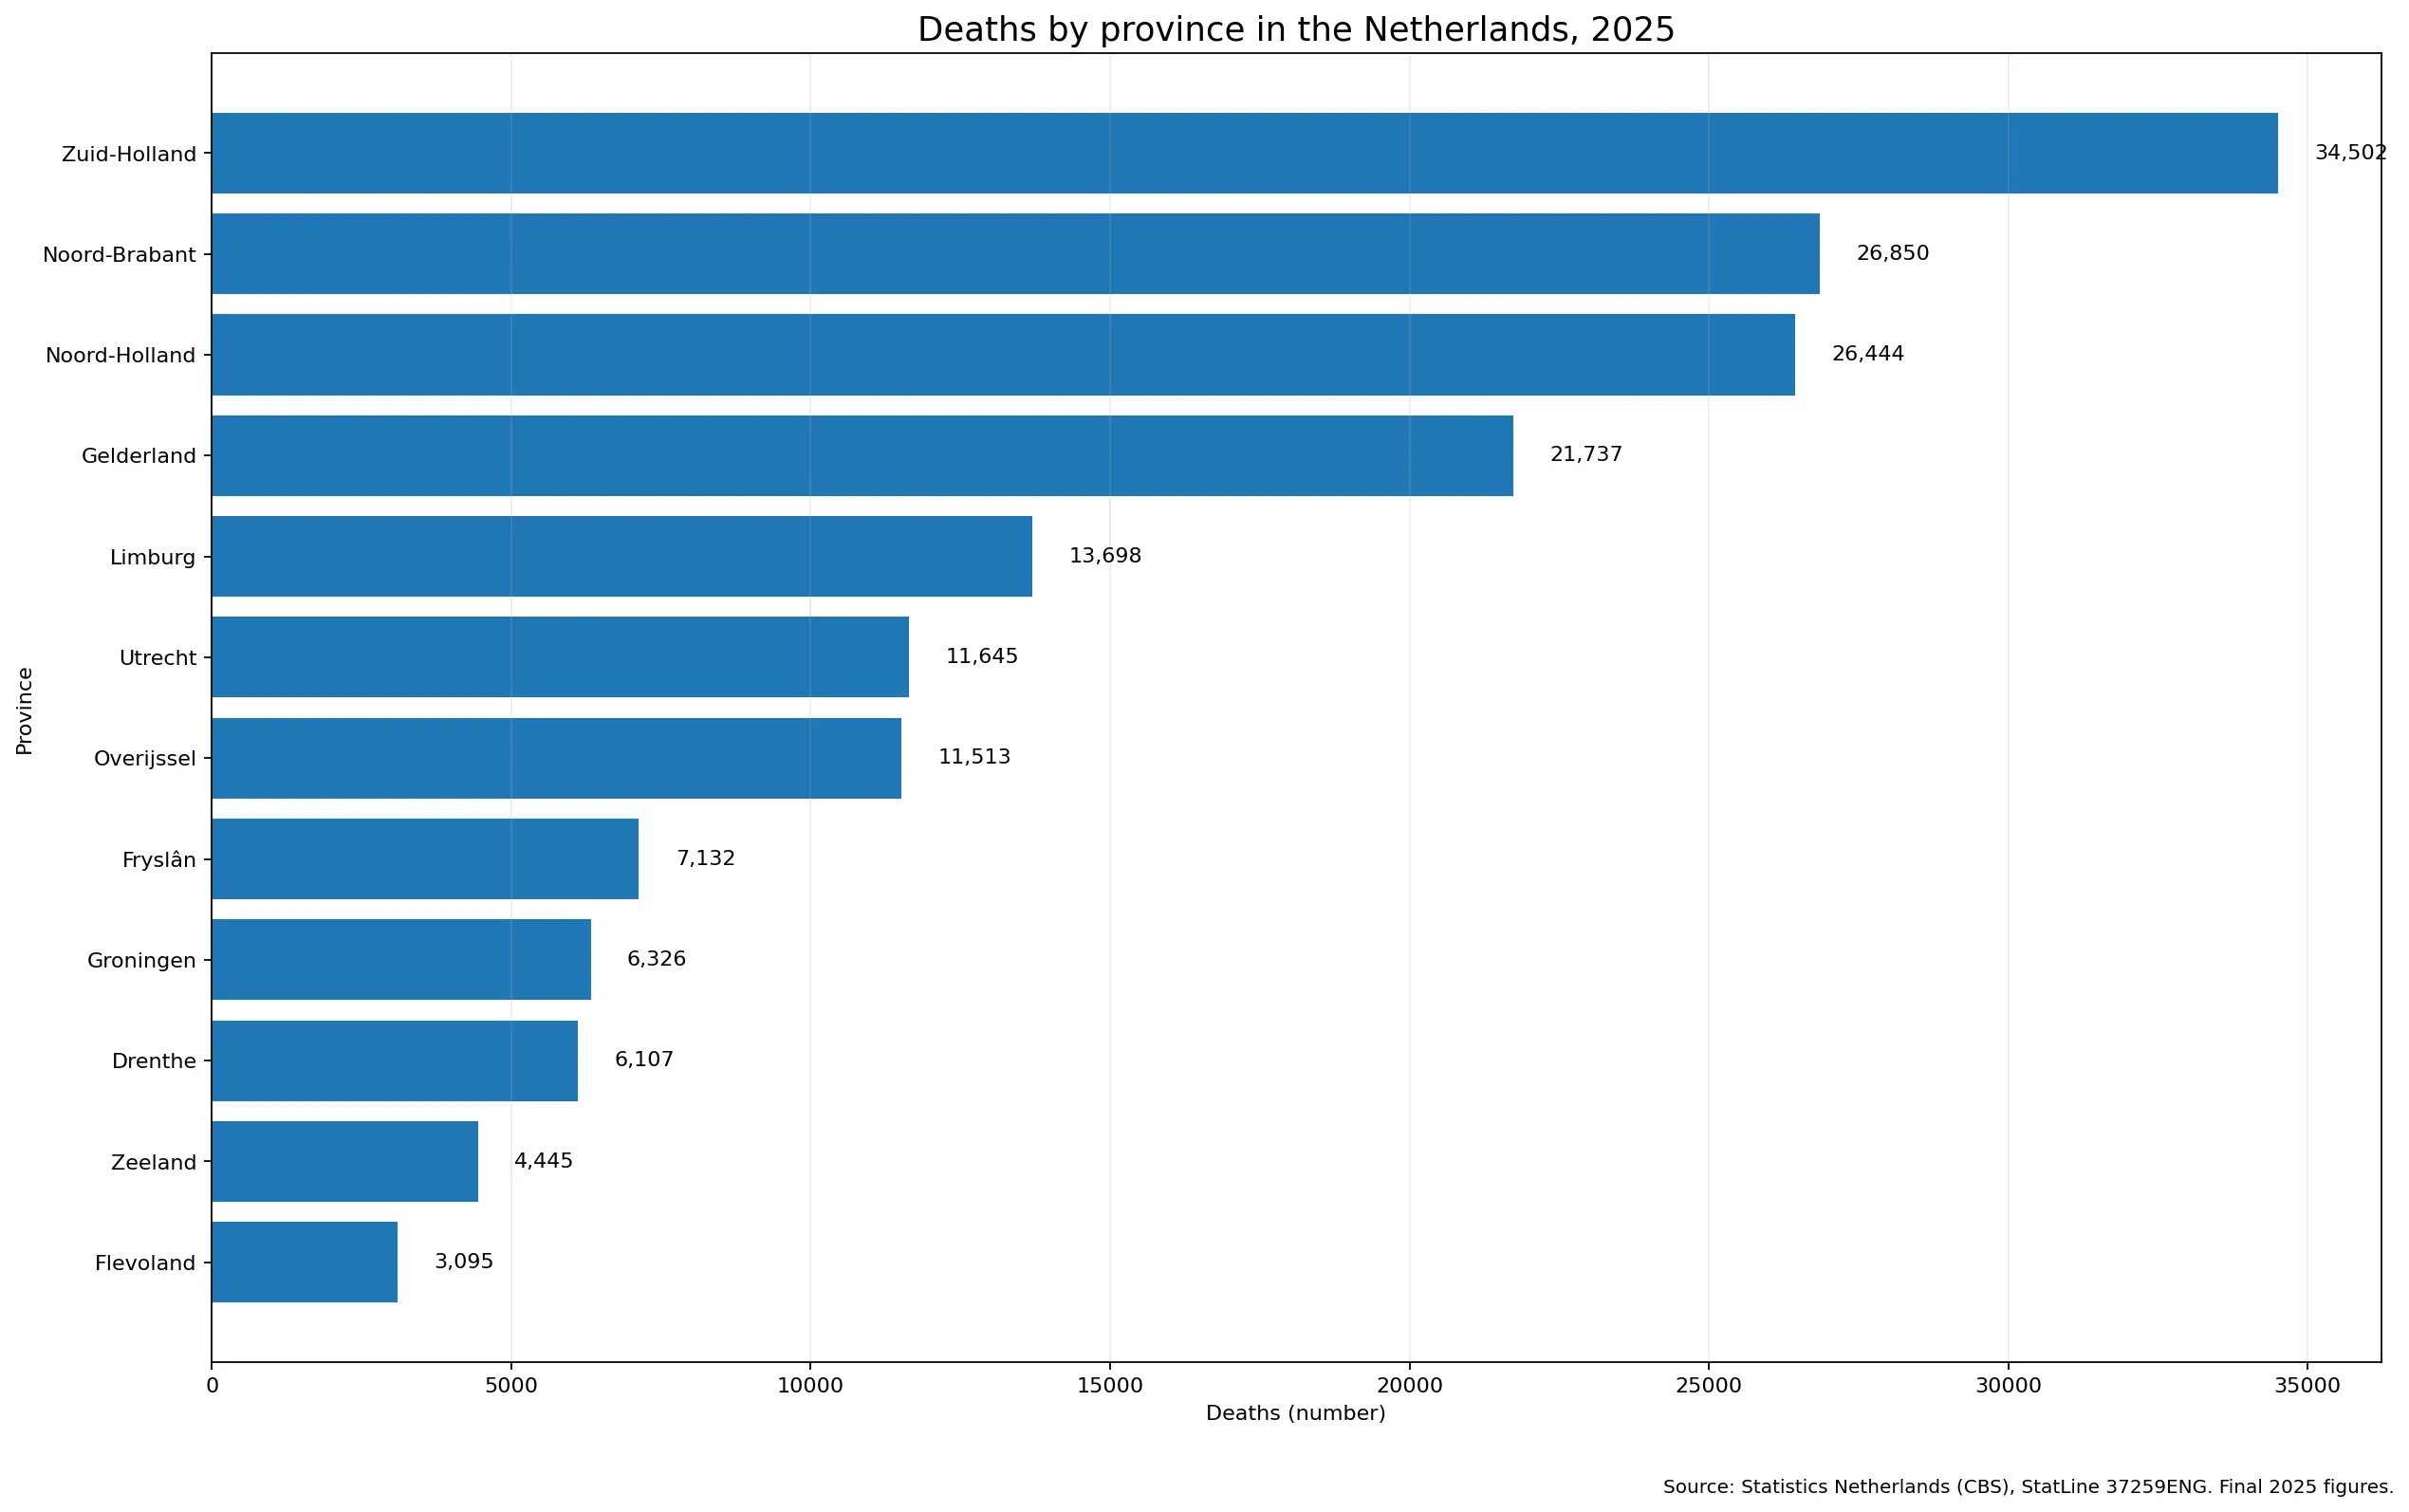
Table of Contents
Zuid-Holland accounts for 19.89% of all deaths in the national total
Zuid-Holland’s 34,502 deaths represent 19.89% of the national total. Noord-Brabant contributes 15.48%, Noord-Holland 15.24%, and Gelderland 12.53%. Together, these four provinces account for 63.13% of all deaths recorded in the Netherlands in 2025. Adding Limburg and Utrecht raises the share of the six largest provincial counts to 77.74%.
At the other end, Flevoland records 3,095 deaths, Zeeland 4,445, Drenthe 6,107, and Groningen 6,326. The largest provincial count is about 11.15 times the smallest. That gap is genuine as a count difference, but it should not be treated as an 11-fold difference in health or mortality risk. Population size and population age structure strongly affect how many deaths occur in a region over a year.
The count ranking changes when deaths are measured relative to population
| Province | Deaths, 2025 | Share of national deaths | Deaths per 1,000 average population |
|---|---|---|---|
| Zuid-Holland | 34,502 | 19.89% | 8.9 |
| Noord-Brabant | 26,850 | 15.48% | 10.1 |
| Noord-Holland | 26,444 | 15.24% | 8.8 |
| Gelderland | 21,737 | 12.53% | 10.0 |
| Limburg | 13,698 | 7.90% | 12.0 |
| Utrecht | 11,645 | 6.71% | 8.2 |
| Overijssel | 11,513 | 6.64% | 9.6 |
| Fryslân | 7,132 | 4.11% | 10.7 |
| Groningen | 6,326 | 3.65% | 10.5 |
| Drenthe | 6,107 | 3.52% | 12.0 |
| Zeeland | 4,445 | 2.56% | 11.3 |
| Flevoland | 3,095 | 1.78% | 6.7 |
The last column is the deaths ratio published by CBS in the same StatLine table. The Netherlands as a whole is at 9.6 deaths per 1,000 average population. Drenthe and Limburg are highest among the provinces at 12.0, followed by Zeeland at 11.3, Fryslân at 10.7, and Groningen at 10.5. Flevoland is lowest at 6.7, while Utrecht is at 8.2, Noord-Holland at 8.8, and Zuid-Holland at 8.9.
This produces a very different ordering from the headcount ranking. Zuid-Holland has the most deaths but not the highest population-relative value. Drenthe, by contrast, has only 6,107 deaths in absolute terms yet shares the highest per-1,000 figure. The two measures therefore answer different questions: one describes how many residents died, while the other scales deaths by the size of the average population.
Drenthe and Limburg reach 12.0 per 1,000 while Flevoland is at 6.7
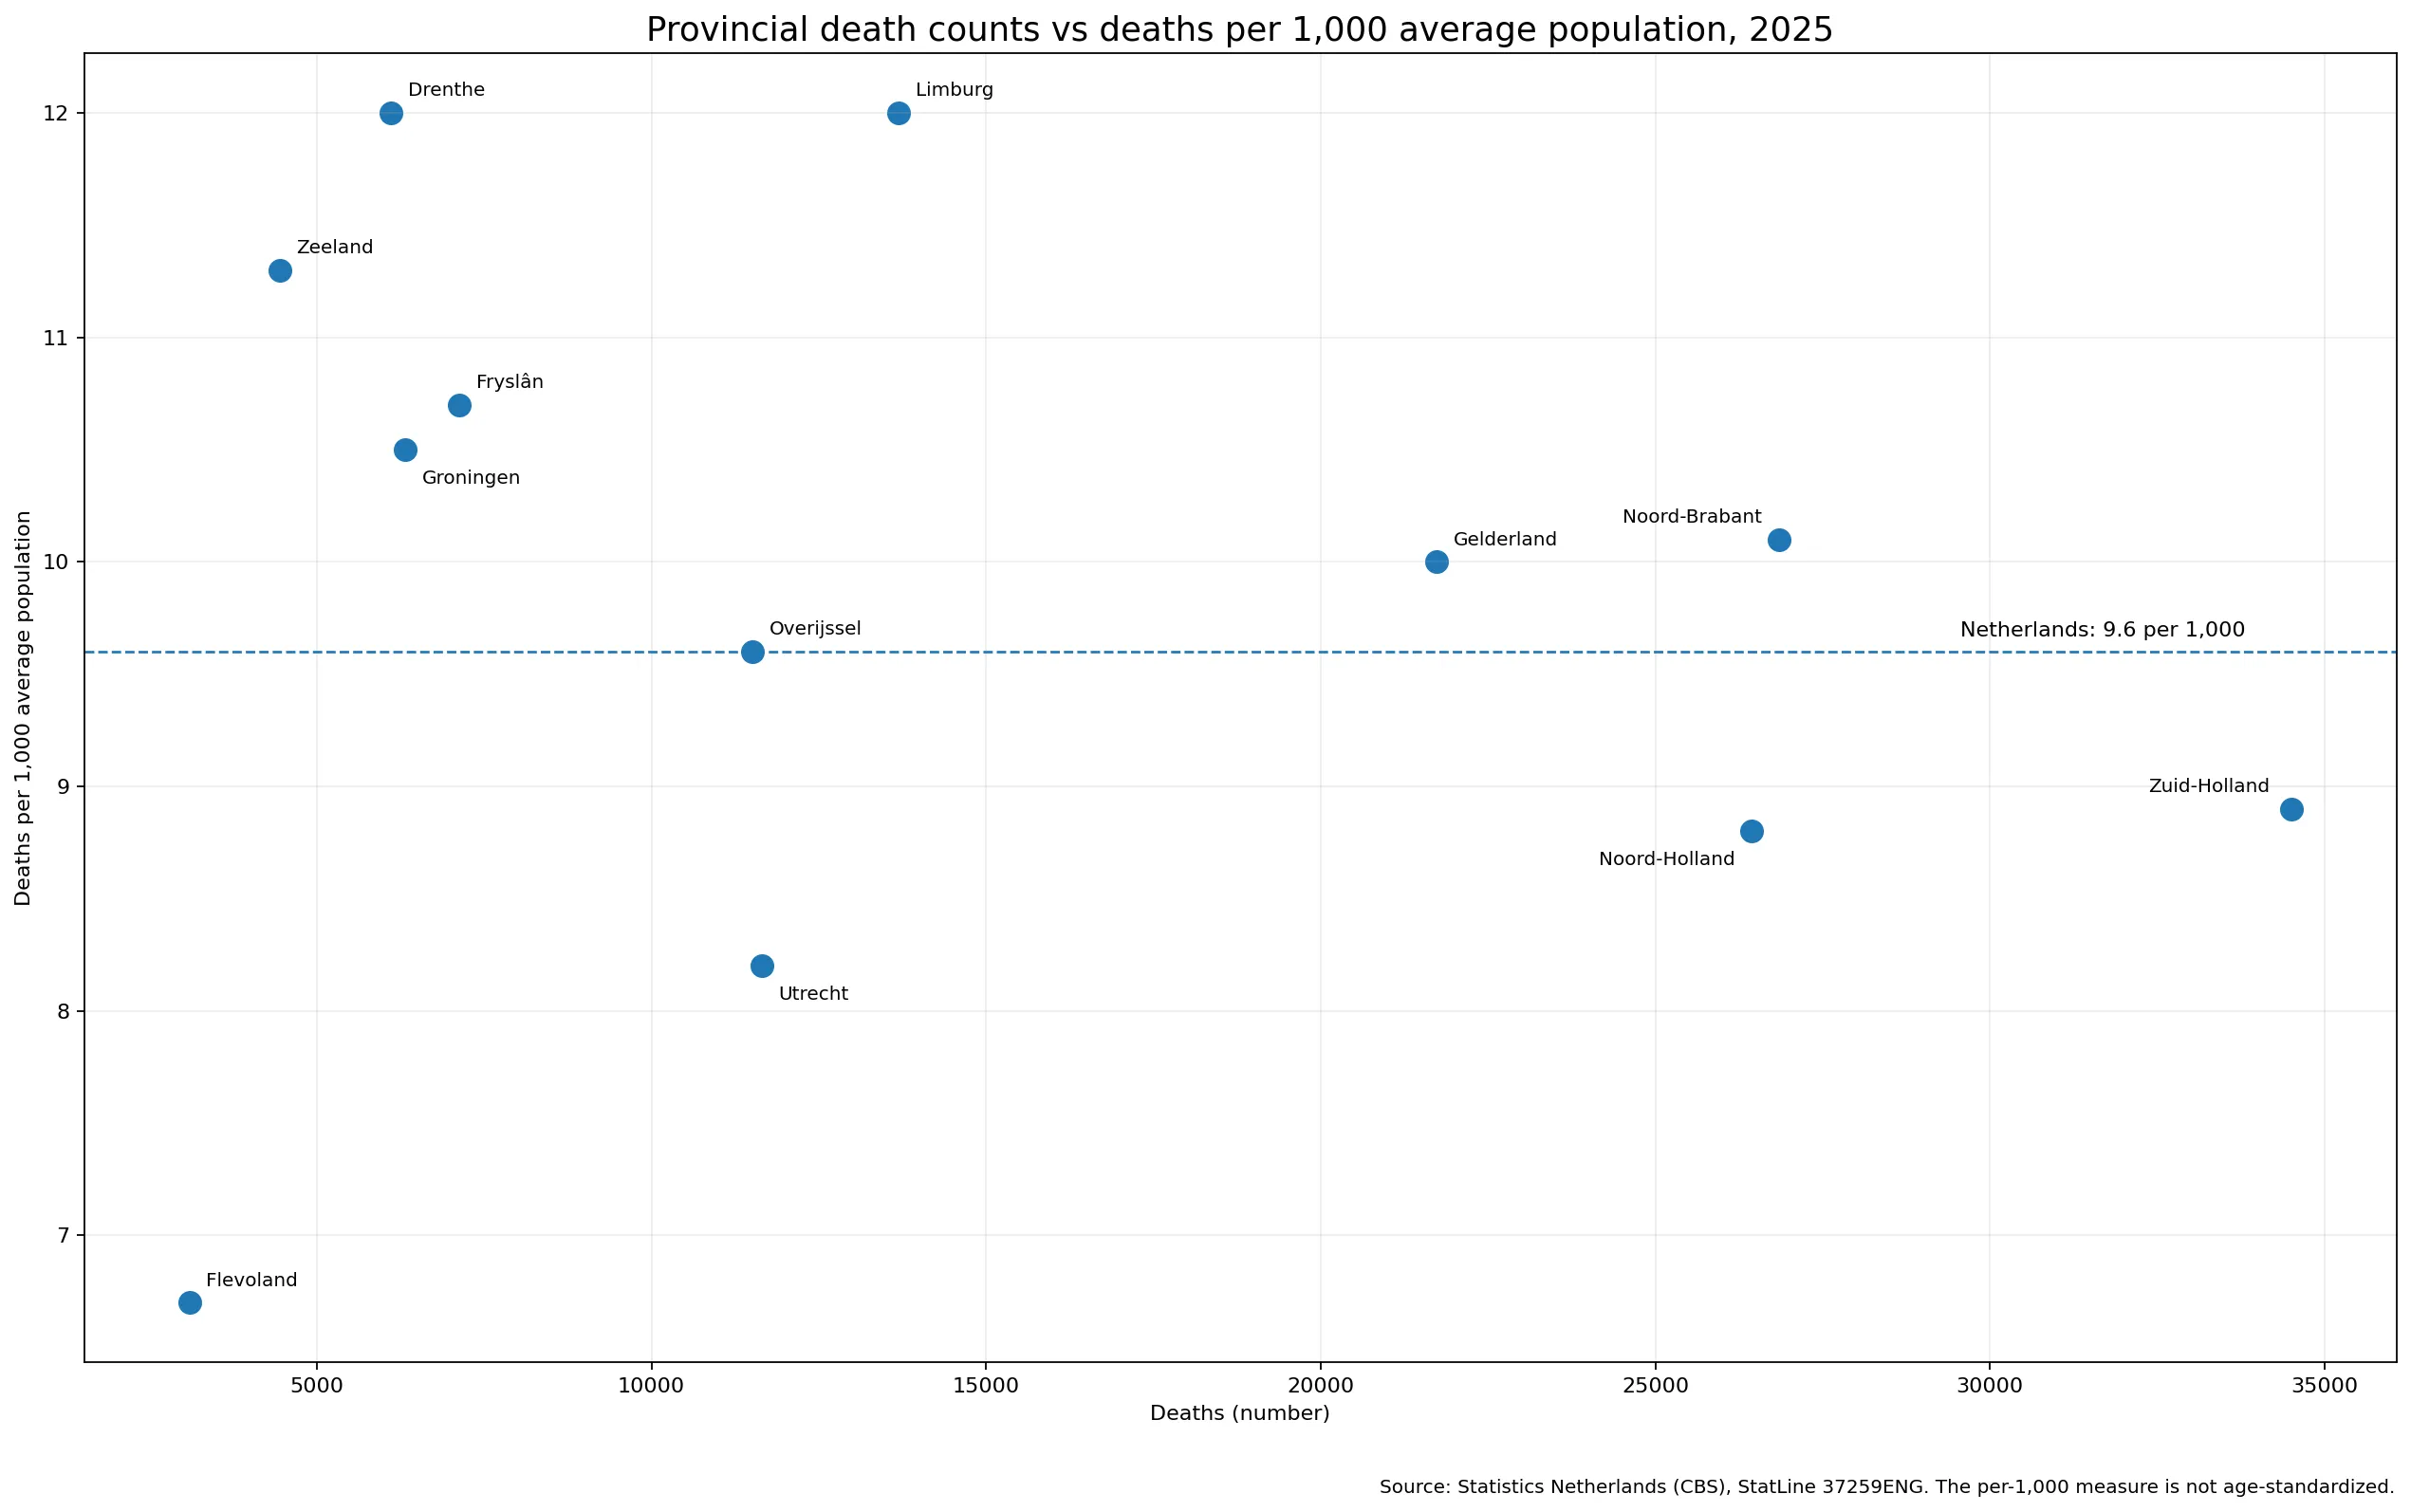
Flevoland sits at the low end on both measures: 3,095 deaths and 6.7 per 1,000 average population. Limburg, however, illustrates why counts and ratios should be separated. Its 13,698 deaths place it in the middle of the absolute ranking, but its per-1,000 value is 12.0, tied with Drenthe for the highest provincial figure. Zeeland is another example: only 4,445 deaths were recorded, yet its population-relative value is 11.3.
The national reference line is useful because it shows which provinces sit above or below the countrywide crude level without turning that comparison into a health score. Overijssel is exactly at 9.6, Gelderland is at 10.0, and Noord-Brabant is at 10.1. Utrecht, Noord-Holland, and Zuid-Holland are below the national line despite having substantial death counts.
Deaths per 1,000 is not an age-standardized measure of mortality risk
CBS defines the ratio as deaths per 1,000 of the average population. Because the denominator includes the entire population without adjusting for age, the measure is sensitive to demographic structure. A province with a larger share of older residents can have a higher crude death ratio even when age-specific mortality is not unusually high. The reverse can also occur in a younger province.
For that reason, the provincial ratios should not be ranked as a direct measure of healthcare quality, safety, or the chance that an individual will die. A proper risk comparison would require age-standardized mortality rates or age-specific death rates. Cause-of-death statistics would be needed to determine whether cardiovascular disease, cancer, respiratory disease, accidents, or other causes differ across provinces.
CBS has noted at the national level that population growth and ageing contribute to the long-run increase in annual deaths. That broad demographic point is important context, but the 12-row provincial dataset does not contain the age distribution needed to assign a specific cause to any province’s 2025 level. The chart identifies patterns that merit follow-up; it does not explain them by itself.
Deaths are assigned to the deceased person’s municipality of residence
The regional definition matters for interpreting the geography. CBS states that deaths are counted in the de jure population of the municipality where the deceased person lived, not necessarily the municipality where the death occurred. A person may die in a hospital located in another city or province while still being attributed statistically to the municipality of residence.
This residence-based method keeps the numerator aligned with the population used in regional demographic statistics. It also means a province with a large medical center does not automatically receive the deaths of patients who live elsewhere. Provincial totals remain broad aggregates, however, and can conceal substantial differences between large cities, suburbs, and rural municipalities within the same province.
The 2025 provincial figures are final and contain no missing observations
CBS added final 2025 figures to StatLine table 37259ENG on 10 July 2026. The comparison here uses total male and female and only the 12 province codes PV20 through PV31. National, landsdeel, COROP, and municipal rows are excluded, preventing hierarchical totals from being counted more than once.
The arithmetic mean across the 12 province counts is about 14,458 deaths and the median is 11,579. These are distribution summaries that treat every province as one observation; they are not population-weighted national mortality measures. For the Netherlands as a whole, the appropriate figures are the official national count of 173,494 and the official ratio of 9.6 per 1,000 average population.
What this comparison can and cannot establish
The data establish the number of deaths recorded for residents of each province in 2025, each province’s share of the national total, and the crude deaths-per-1,000 ratio. Because every provincial observation uses the same reference year and geographic level, the table supports a clean cross-sectional comparison.
The data do not contain cause of death, life expectancy, disease prevalence, healthcare access, income, environment, long-term care use, or the age distribution of each province. Finding a high or low observation is therefore not the same as explaining it. Those questions need additional datasets matched by province and year, and ideally measures designed to separate population composition from mortality risk.
Source and calculation method
The source is Statistics Netherlands (CBS), StatLine table 37259ENG: Population dynamics; birth, death and migration per region. The selection is total male and female, reference year 2025, and the 12 Dutch provinces. Published death counts and deaths-per-1,000 ratios are used as reported by CBS. Provincial shares are calculated by dividing each count by the verified sum of 173,494 deaths.
All 12 province counts are present; no missing observation is replaced with zero. The rankings and shares describe one year only. A statement about whether mortality increased or decreased would require a matched time series using the same definitions and geographic classification across years.
Frequently Asked Questions
Which Dutch province recorded the most deaths in 2025?
Zuid-Holland recorded the largest number with 34,502 deaths, followed by Noord-Brabant with 26,850 and Noord-Holland with 26,444.
Does the province with the most deaths also have the highest death ratio?
No. Zuid-Holland has the largest absolute count, while Drenthe and Limburg have the highest CBS deaths-per-1,000 value at 12.0. Counts and population-relative ratios answer different questions.
How many deaths were recorded in the Netherlands in 2025?
CBS reports a final total of 173,494 deaths in 2025. The sum of the 12 provincial counts used here is also 173,494.
Are deaths assigned to the province where the person died?
Not necessarily. CBS attributes deaths to the municipality of residence of the deceased person, so a death occurring in a hospital elsewhere can still be counted in the person’s home municipality.
Related Maps
Green Map creates custom-edited map images using open geographic data sources such as geoBoundaries, Natural Earth, OpenStreetMap, and government open data.
These maps are edited visual materials, not raw data files, and are provided for education, documents, presentations, and graphic reference.