Expected years of schooling summarizes how long a child entering school can expect to spend in education if the current pattern of age-specific enrolment rates continues. In the 2023 UNDP dataset used for the Human Development Report 2025, there are 195 country and territory observations. The values range from 5.63 years to 21.69 years, with a median of 13.34 years and an unweighted mean of 13.62 years. Because every row in this cross-section refers to 2023, the comparison does not mix recent values with older observations.
The measure is easy to misread. It is not the legal duration of compulsory education, not the average schooling already completed by adults, and not a prediction of how many years a particular child will ultimately graduate with. It compresses the current enrolment pattern across school ages into one number. That makes it useful for comparing the reach and continuation of education systems, but it cannot by itself describe learning quality, completion, inequality within a country or the reasons behind a low value.
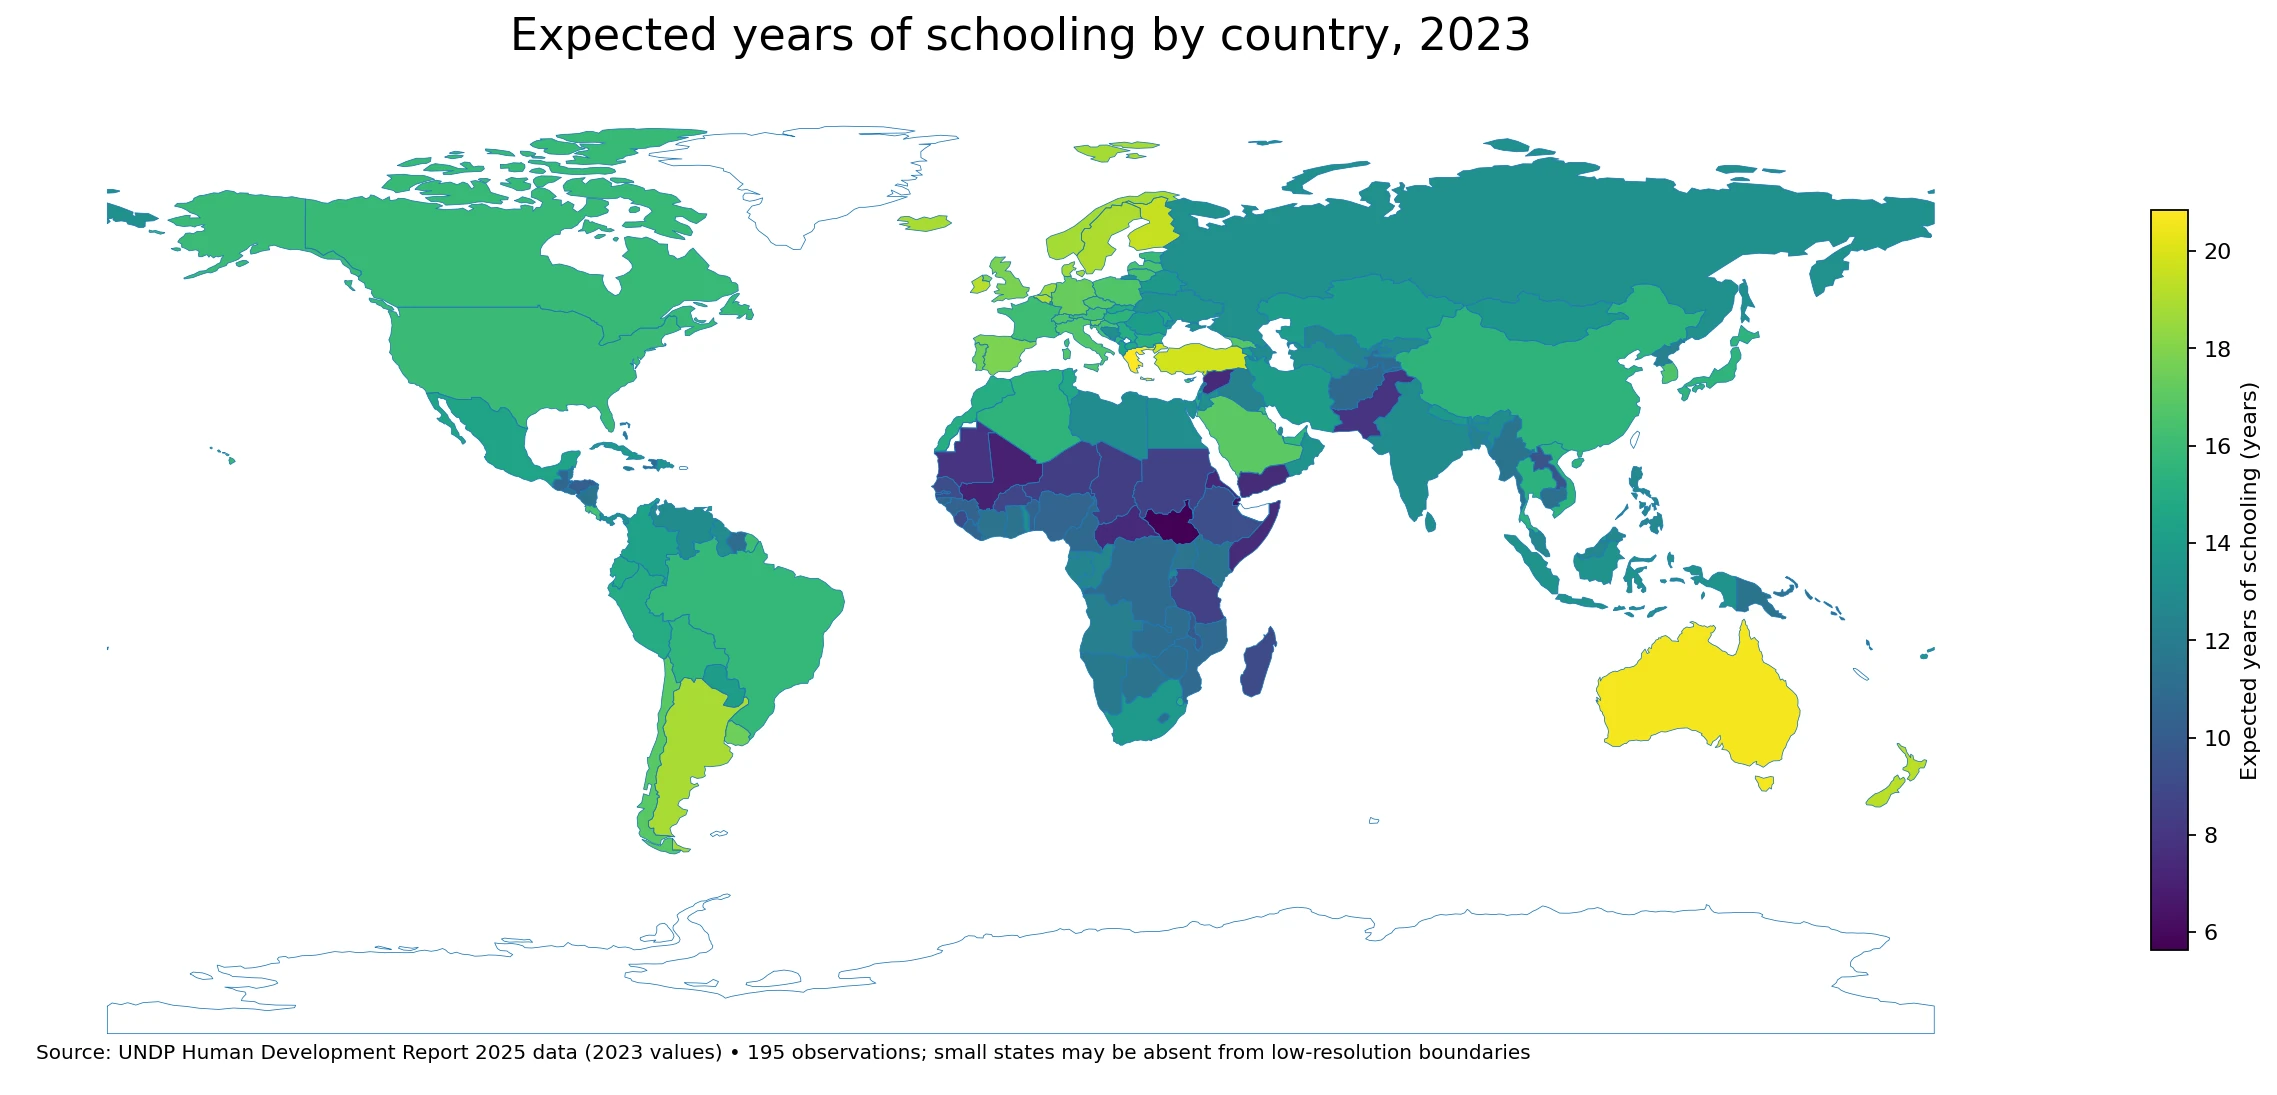
Table of Contents
What expected years of schooling measures
UNDP defines expected years of schooling as the number of years of schooling a child of school-entry age can expect to receive if prevailing patterns of age-specific enrolment rates persist throughout the child’s life. The “expected” part therefore comes from current participation rates rather than a forecast model about future policy or economic conditions. It is a synthetic period measure: it asks what current enrolment conditions imply for a hypothetical child if those conditions were maintained.
This indicator is one of the two education components used in the Human Development Index. The other is mean years of schooling for adults aged 25 and older. They capture different time perspectives. Mean years of schooling reflects accumulated educational attainment among adults, while expected years of schooling is more responsive to the participation patterns of today’s school-age population. A country can improve current enrolment relatively quickly while its adult attainment measure changes only gradually.
The top of the 2023 distribution extends above 20 years
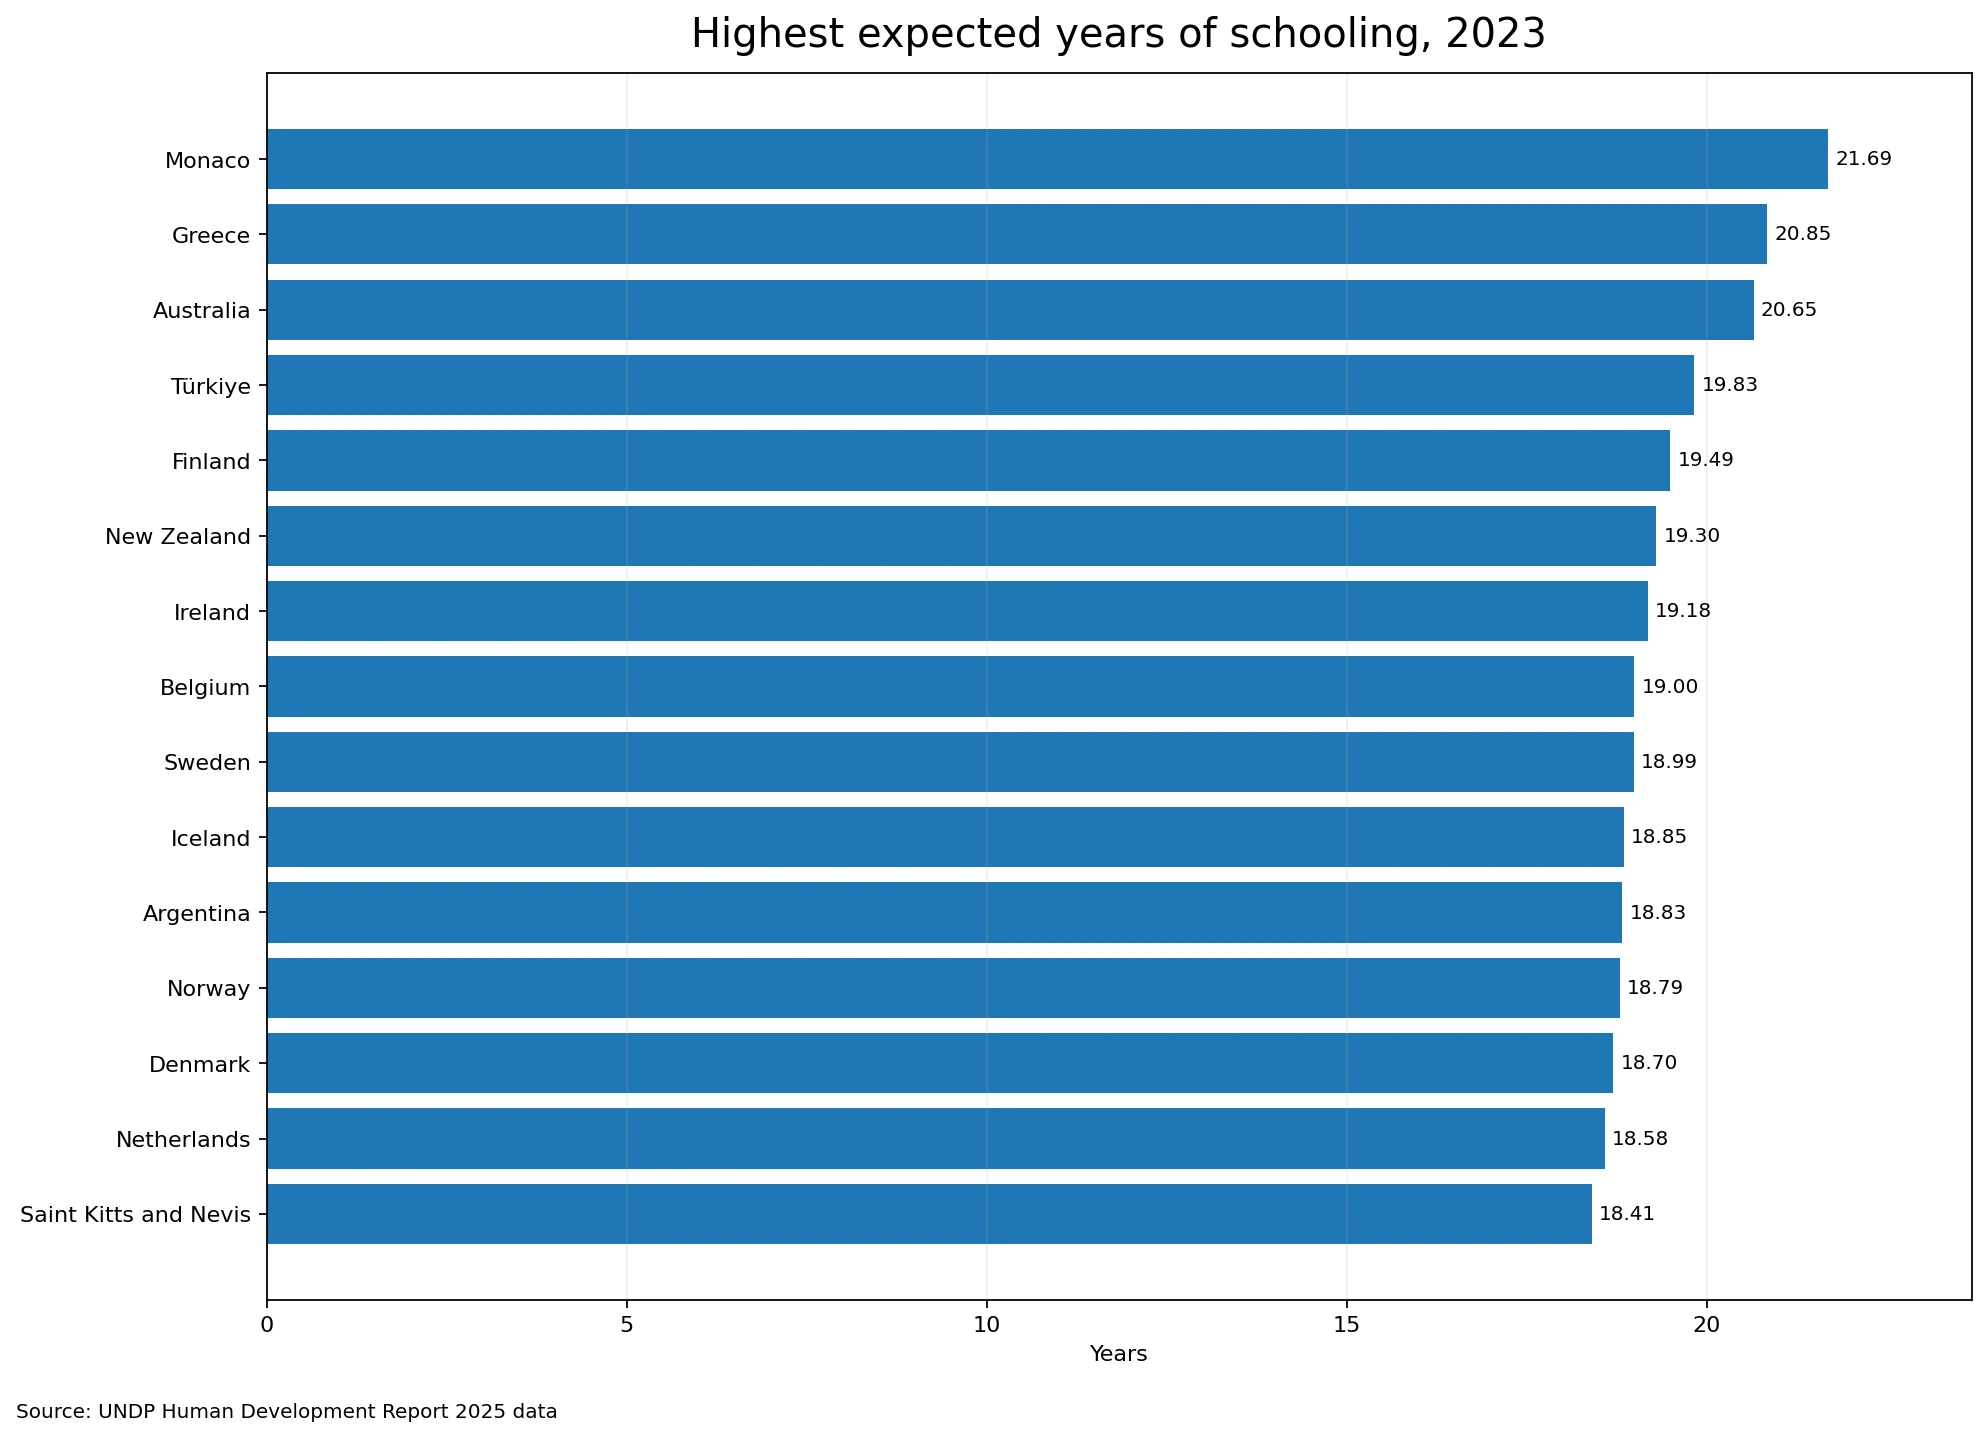
Monaco records 21.69 years, the highest value in the 195-observation dataset. Greece follows at 20.85 years and Australia at 20.65. Türkiye reaches 19.83, Finland 19.49, New Zealand 19.30, Ireland 19.18, Belgium 19.00, Sweden 18.99 and Iceland 18.85. In total, three observations are at least 20 years and sixteen are at least 18 years. The upper group includes several European economies as well as Australia, New Zealand and Argentina, so it is not confined to a single region.
Values above 18 years need one methodological clarification. UNDP caps expected years of schooling at 18 years when normalizing the education dimension for the HDI. That cap does not mean raw country values above 18 are errors. The source series can contain higher observations, while the HDI calculation applies an 18-year goalpost at the normalization stage. Reading the raw indicator and reading the normalized HDI education component are therefore two different tasks.
The lower end falls below eight years in ten observations
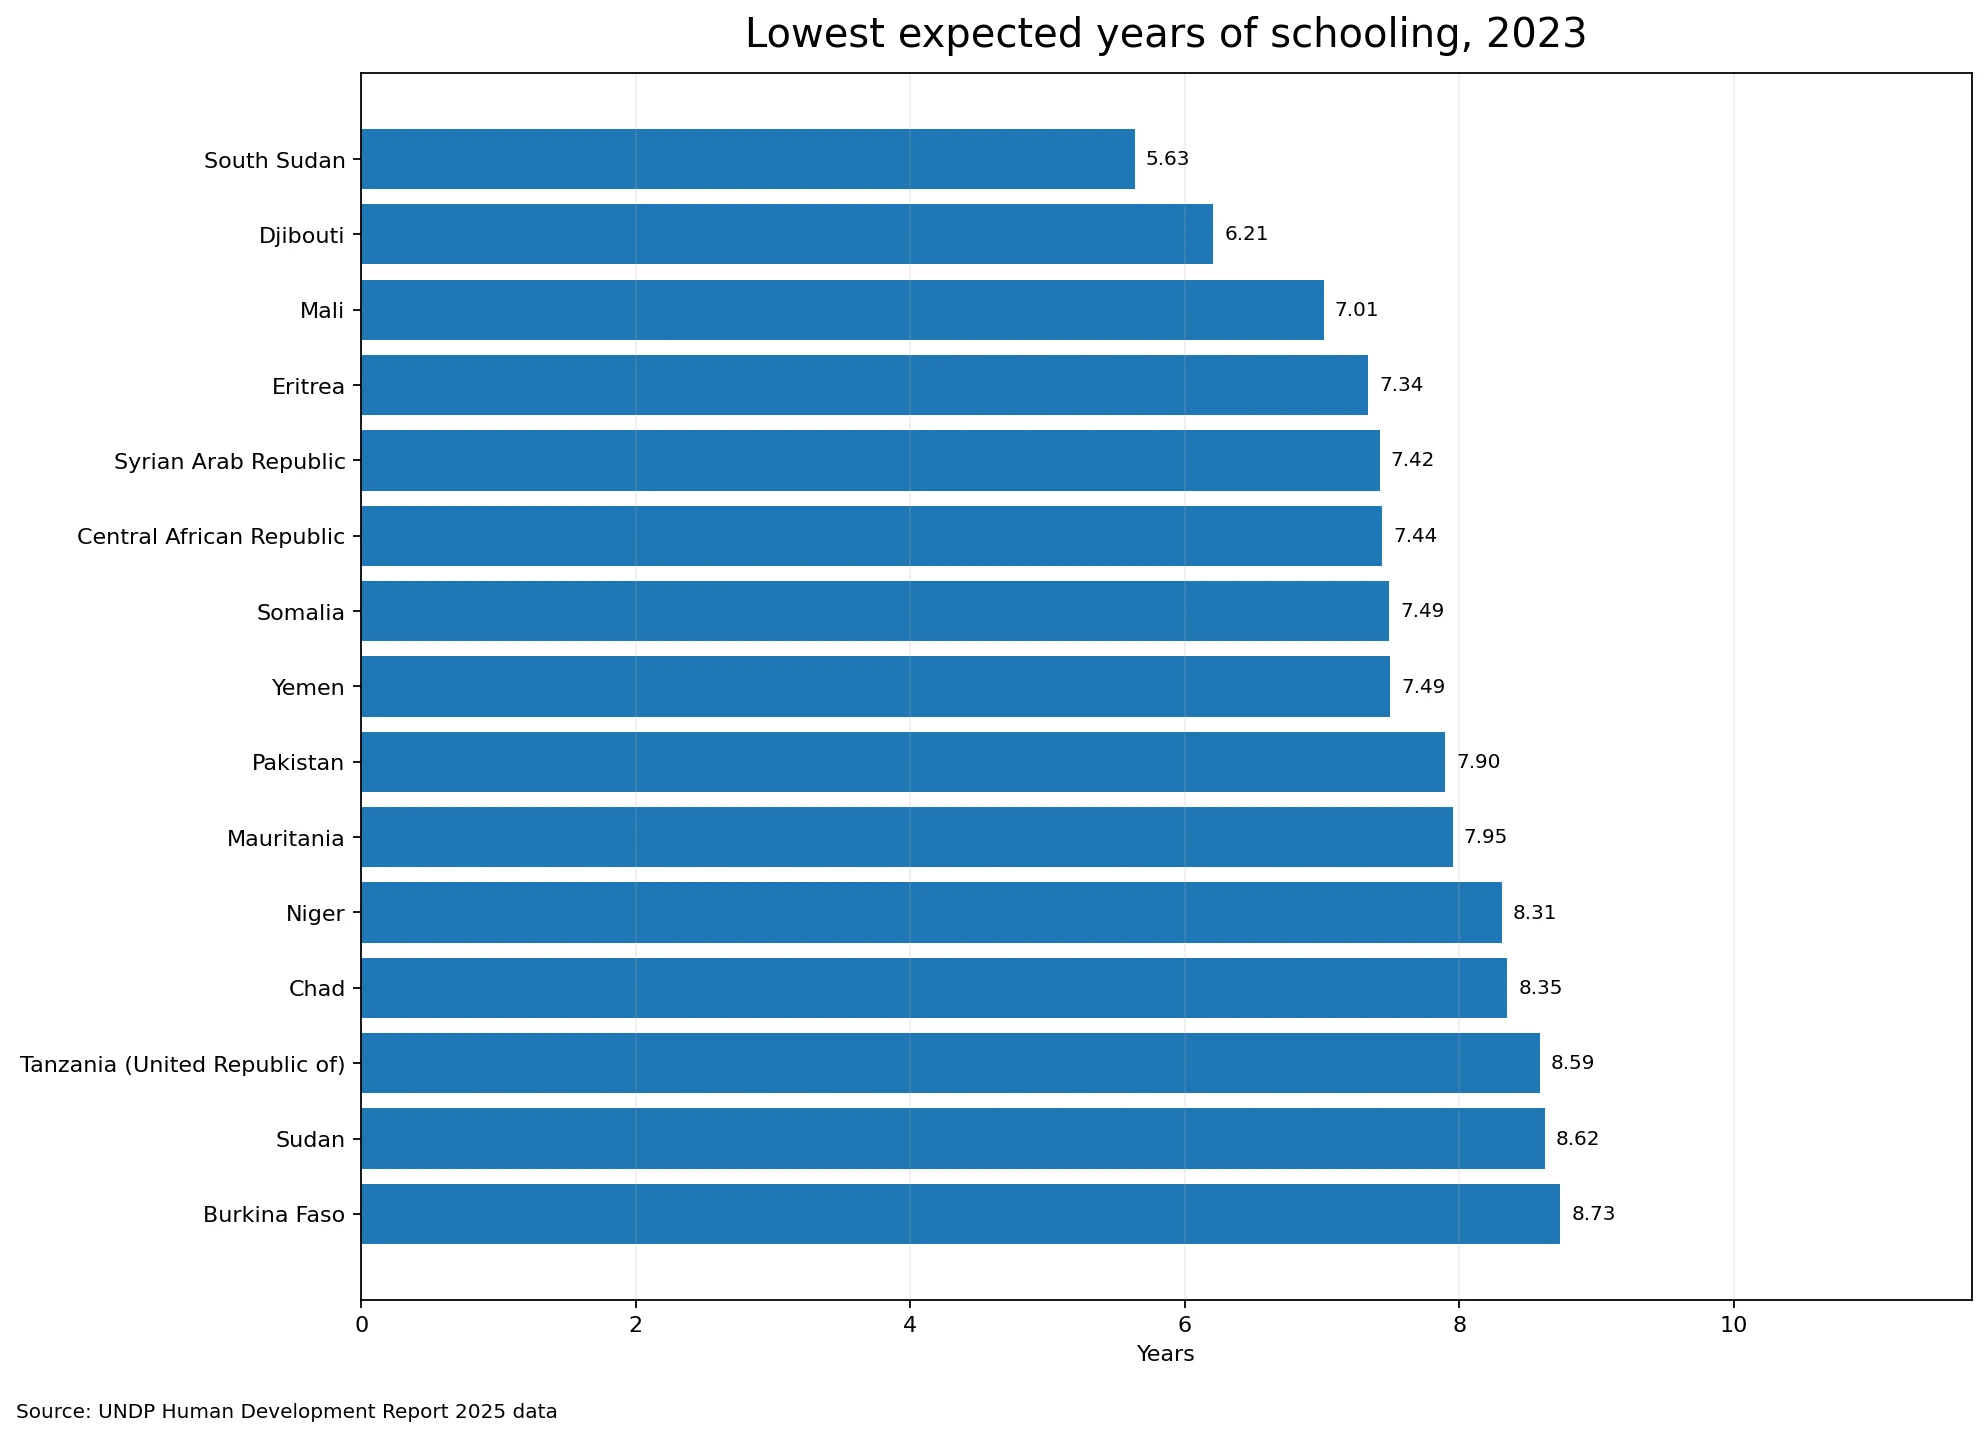
At the other end, South Sudan records 5.63 years. Djibouti is at 6.21, Mali at 7.01, Eritrea at 7.34, the Syrian Arab Republic at 7.42, the Central African Republic at 7.44, Somalia at 7.49 and Yemen at 7.49. Pakistan and Mauritania are both just below eight years. There are ten observations under eight years and twenty-three below ten years. Many of the lowest values appear in parts of Sub-Saharan Africa and in fragile or conflict-affected settings, but the indicator itself does not identify causation.
A low expected-years figure can be associated with many different mechanisms: limited access to schools, weak transition from one education level to the next, household constraints, displacement, conflict, gender gaps, dropout or other institutional factors. Those mechanisms require additional evidence. The country comparison tells us where current participation patterns imply a shorter educational path; it does not tell us which single factor produced that outcome.
Most observations lie between 10 and 16 years
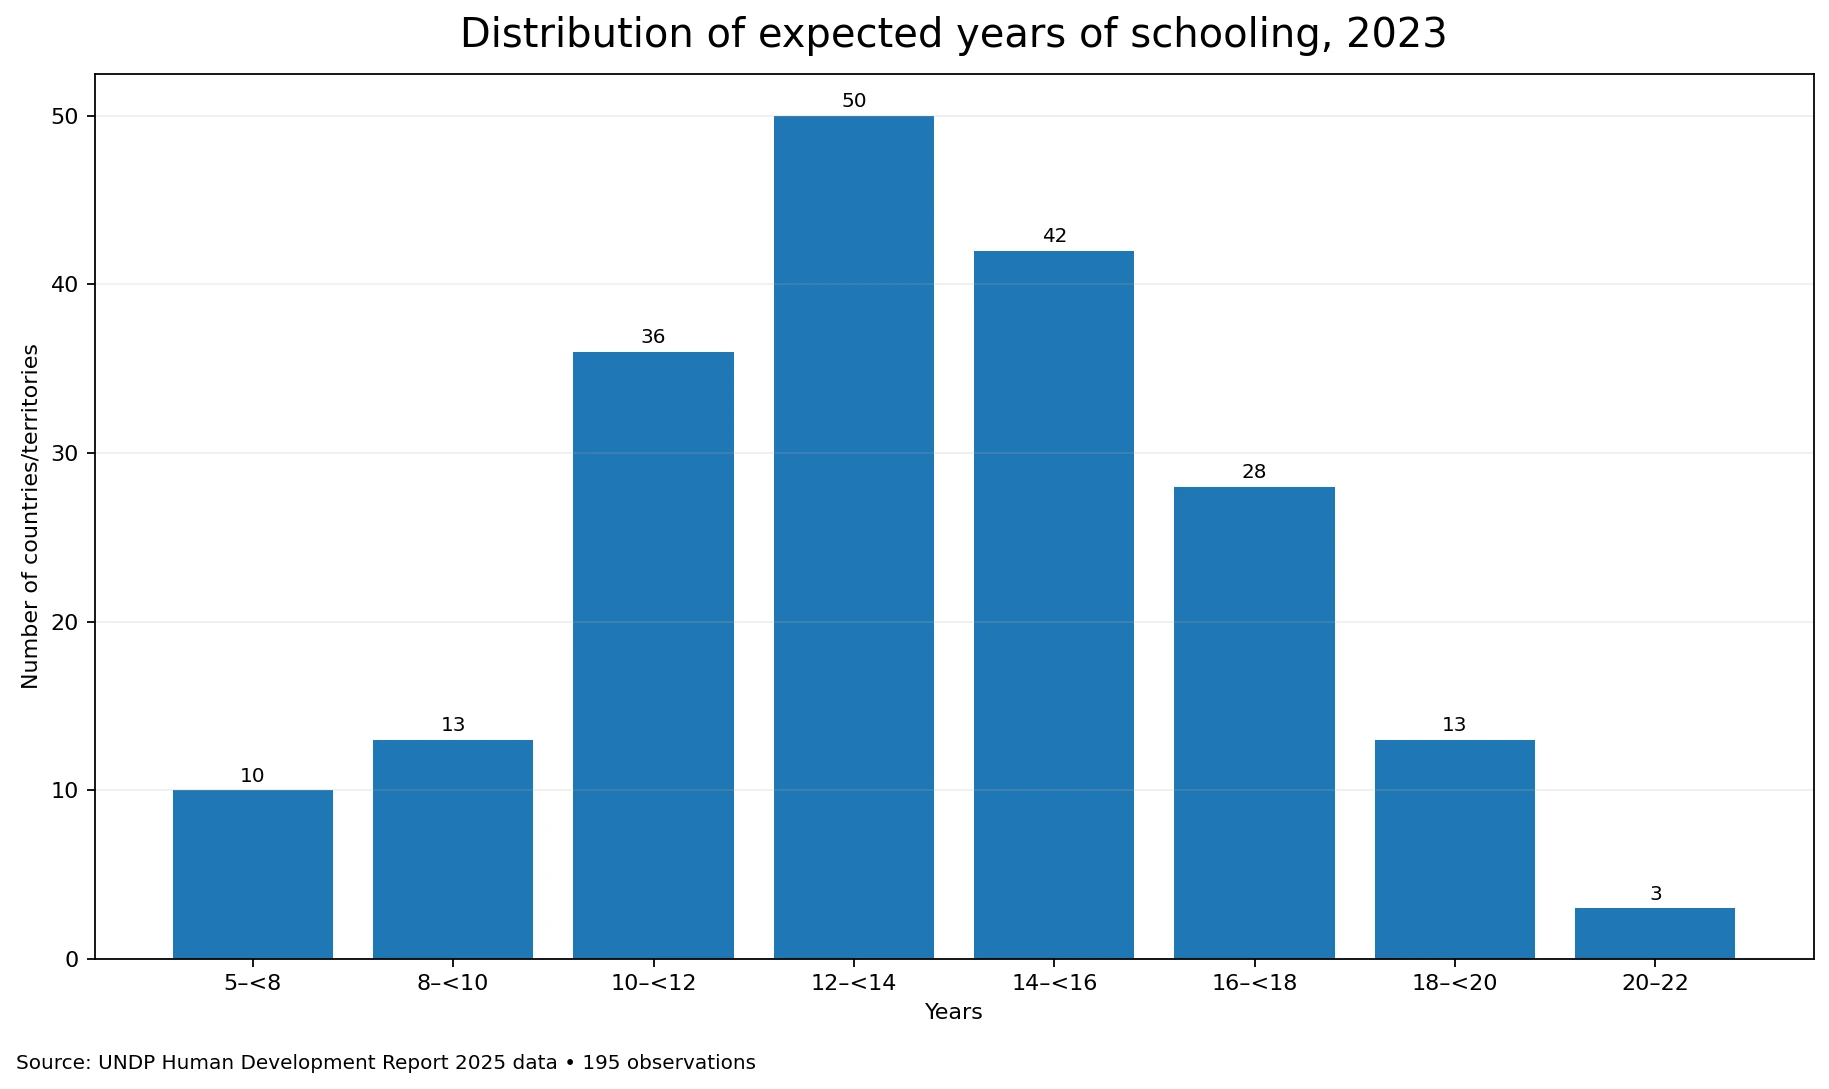
The distribution is densest in the middle. Ten observations are below 8 years, thirteen are from 8 to under 10, thirty-six are from 10 to under 12, fifty are from 12 to under 14, forty-two are from 14 to under 16, twenty-eight are from 16 to under 18, thirteen are from 18 to under 20 and three are at 20 or above. The 12 to under 14 band is the largest, and 128 of the 195 observations fall between 10 and under 16 years.
The first quartile is about 11.51 years and the third quartile about 15.90, meaning the middle half of observations lies within a span of roughly 4.39 years. The mean of 13.62 is close to the median of 13.34, so the centre of this dataset is not dominated by a small number of extreme values. Even so, the full range is wide: the maximum exceeds the minimum by more than 16 years.
Near-neighbours in the ranking should not be overinterpreted
Large economies illustrate how tightly packed the middle of the ranking can be. Germany records 17.31 years, France 16.10, the United States 15.92, Canada 15.89, Brazil 15.79, Japan 15.51, China 15.48 and India 12.95. The Republic of Korea is at 16.62 years. Differences of only a few hundredths or tenths of a year are much smaller than the broad gaps between the upper, middle and lower parts of the distribution.
For that reason, a rank of 47 versus 49 should not be treated as a definitive judgement about one education system being better than another. International indicators depend on the quality and harmonization of underlying data, and education systems also differ in structure. The most defensible use is to identify broad position and scale: whether a country is around 8 years, 13 years, 16 years or above 18 years, and then examine more specific indicators when the policy question requires detail.
It is not the same as compulsory schooling or adult attainment
Compulsory education duration is a legal rule. Expected years of schooling is an empirical summary derived from observed enrolment rates across ages and education levels. A country can mandate many years of schooling but still have lower expected schooling if participation drops before students reach later levels. Conversely, participation in upper-secondary or tertiary education can extend expected years well beyond the compulsory period.
Mean years of schooling answers another question again. It measures the average number of years of education received by adults aged 25 and older, based on educational attainment. Because it reflects the stock of education accumulated over many cohorts, it typically changes more slowly. Expected years of schooling is closer to a snapshot of the opportunities implied by today’s participation pattern. Analysts often read both together to distinguish current access from the educational experience already accumulated in the adult population.
What the indicator cannot tell us
Expected years of schooling is fundamentally a quantity-of-participation measure. It does not directly measure whether students are learning at grade level, whether schools have adequate resources, whether attendance is regular, or whether students complete the qualifications associated with the years in which they are enrolled. Two countries with similar expected years can have very different learning outcomes, completion rates and school quality.
The national average also hides distributional differences. Urban and rural areas, income groups, girls and boys, children with disabilities and subnational regions can have very different access to education. A single national value cannot reveal those disparities. For a question about equity or quality, expected years should be combined with disaggregated enrolment, completion, learning and attainment data rather than used as a stand-alone verdict.
Source and comparison method
The values come from the UNDP Human Development Report 2025 composite-indicator time series for 2023. UNDP describes expected years of schooling as an HDI education component and notes that it is updated using education statistics, including data from the UNESCO Institute for Statistics. The 2025 statistical documentation also states that expected years of schooling is capped at 18 years for the HDI normalization step. Official definitions, downloads and technical material are available from the UNDP Human Development Reports documentation and downloads page and the Human Development Report 2025.
The table below sorts all 195 observations by the unrounded 2023 value and displays each value to two decimal places. The world map uses a low-resolution boundary layer, so a number of very small states do not appear as visible polygons. Their values are not discarded: they remain in the ranking and full table, which should be treated as the complete reference for the dataset.
All 195 country and territory observations for 2023
| Rank | Country or territory | Year | Expected years of schooling |
|---|---|---|---|
| 1 | Monaco | 2023 | 21.69 |
| 2 | Greece | 2023 | 20.85 |
| 3 | Australia | 2023 | 20.65 |
| 4 | Türkiye | 2023 | 19.83 |
| 5 | Finland | 2023 | 19.49 |
| 6 | New Zealand | 2023 | 19.30 |
| 7 | Ireland | 2023 | 19.18 |
| 8 | Belgium | 2023 | 19.00 |
| 9 | Sweden | 2023 | 18.99 |
| 10 | Iceland | 2023 | 18.85 |
| 11 | Argentina | 2023 | 18.83 |
| 12 | Norway | 2023 | 18.79 |
| 13 | Denmark | 2023 | 18.70 |
| 14 | Netherlands | 2023 | 18.58 |
| 15 | Saint Kitts and Nevis | 2023 | 18.41 |
| 16 | Seychelles | 2023 | 18.22 |
| 17 | Spain | 2023 | 17.83 |
| 18 | United Kingdom | 2023 | 17.81 |
| 19 | Tonga | 2023 | 17.79 |
| 20 | Portugal | 2023 | 17.49 |
| 21 | Uruguay | 2023 | 17.48 |
| 22 | Slovenia | 2023 | 17.48 |
| 23 | Germany | 2023 | 17.31 |
| 24 | Saudi Arabia | 2023 | 16.95 |
| 25 | Chile | 2023 | 16.91 |
| 26 | Hong Kong, China (SAR) | 2023 | 16.90 |
| 27 | Czechia | 2023 | 16.79 |
| 28 | Georgia | 2023 | 16.75 |
| 29 | Singapore | 2023 | 16.74 |
| 30 | Italy | 2023 | 16.71 |
| 31 | Poland | 2023 | 16.68 |
| 32 | Switzerland | 2023 | 16.67 |
| 33 | Barbados | 2023 | 16.63 |
| 34 | Korea (Republic of) | 2023 | 16.62 |
| 35 | Grenada | 2023 | 16.58 |
| 36 | Latvia | 2023 | 16.48 |
| 37 | Lithuania | 2023 | 16.45 |
| 38 | Marshall Islands | 2023 | 16.39 |
| 39 | Costa Rica | 2023 | 16.35 |
| 40 | Croatia | 2023 | 16.35 |
| 41 | Austria | 2023 | 16.28 |
| 42 | Saint Vincent and the Grenadines | 2023 | 16.25 |
| 43 | Cyprus | 2023 | 16.22 |
| 44 | France | 2023 | 16.10 |
| 45 | Estonia | 2023 | 15.97 |
| 46 | Bahrain | 2023 | 15.93 |
| 47 | United States | 2023 | 15.92 |
| 48 | Malta | 2023 | 15.91 |
| 49 | Kuwait | 2023 | 15.90 |
| 50 | Canada | 2023 | 15.89 |
| 51 | Brazil | 2023 | 15.79 |
| 52 | Bolivia (Plurinational State of) | 2023 | 15.61 |
| 53 | United Arab Emirates | 2023 | 15.60 |
| 54 | Montenegro | 2023 | 15.54 |
| 55 | Japan | 2023 | 15.51 |
| 56 | Antigua and Barbuda | 2023 | 15.50 |
| 57 | Algeria | 2023 | 15.50 |
| 58 | China | 2023 | 15.48 |
| 59 | Hungary | 2023 | 15.47 |
| 60 | Viet Nam | 2023 | 15.46 |
| 61 | Liechtenstein | 2023 | 15.41 |
| 62 | Thailand | 2023 | 15.36 |
| 63 | Bulgaria | 2023 | 15.32 |
| 64 | Eswatini (Kingdom of) | 2023 | 15.25 |
| 65 | Morocco | 2023 | 15.07 |
| 66 | Serbia | 2023 | 15.04 |
| 67 | Slovakia | 2023 | 14.95 |
| 68 | Israel | 2023 | 14.93 |
| 69 | Peru | 2023 | 14.91 |
| 70 | Ecuador | 2023 | 14.85 |
| 71 | North Macedonia | 2023 | 14.78 |
| 72 | Tunisia | 2023 | 14.67 |
| 73 | Moldova (Republic of) | 2023 | 14.64 |
| 74 | San Marino | 2023 | 14.60 |
| 75 | Andorra | 2023 | 14.54 |
| 76 | Albania | 2023 | 14.51 |
| 77 | Mexico | 2023 | 14.47 |
| 78 | Armenia | 2023 | 14.38 |
| 79 | Luxembourg | 2023 | 14.36 |
| 80 | Colombia | 2023 | 14.29 |
| 81 | Trinidad and Tobago | 2023 | 14.24 |
| 82 | Mauritius | 2023 | 14.16 |
| 83 | Dominica | 2023 | 14.15 |
| 84 | Palau | 2023 | 14.07 |
| 85 | Romania | 2023 | 14.05 |
| 86 | Kazakhstan | 2023 | 14.01 |
| 87 | Paraguay | 2023 | 13.99 |
| 88 | Iran (Islamic Republic of) | 2023 | 13.97 |
| 89 | Cuba | 2023 | 13.88 |
| 90 | Fiji | 2023 | 13.85 |
| 91 | South Africa | 2023 | 13.79 |
| 92 | Nepal | 2023 | 13.75 |
| 93 | Belarus | 2023 | 13.72 |
| 94 | Brunei Darussalam | 2023 | 13.70 |
| 95 | Mongolia | 2023 | 13.64 |
| 96 | Dominican Republic | 2023 | 13.62 |
| 97 | Oman | 2023 | 13.44 |
| 98 | Indonesia | 2023 | 13.34 |
| 99 | Ukraine | 2023 | 13.33 |
| 100 | Panama | 2023 | 13.31 |
| 101 | Comoros | 2023 | 13.29 |
| 102 | Timor-Leste | 2023 | 13.25 |
| 103 | Turkmenistan | 2023 | 13.24 |
| 104 | Russian Federation | 2023 | 13.19 |
| 105 | Bosnia and Herzegovina | 2023 | 13.16 |
| 106 | Bhutan | 2023 | 13.15 |
| 107 | Qatar | 2023 | 13.14 |
| 108 | Sri Lanka | 2023 | 13.13 |
| 109 | Egypt | 2023 | 13.13 |
| 110 | Jordan | 2023 | 13.11 |
| 111 | Togo | 2023 | 13.10 |
| 112 | Guyana | 2023 | 13.02 |
| 113 | Palestine, State of | 2023 | 13.00 |
| 114 | Venezuela (Bolivarian Republic of) | 2023 | 12.97 |
| 115 | India | 2023 | 12.95 |
| 116 | Libya | 2023 | 12.92 |
| 117 | Azerbaijan | 2023 | 12.91 |
| 118 | Sao Tome and Principe | 2023 | 12.86 |
| 119 | Nauru | 2023 | 12.84 |
| 120 | Philippines | 2023 | 12.82 |
| 121 | Maldives | 2023 | 12.77 |
| 122 | Saint Lucia | 2023 | 12.73 |
| 123 | Kyrgyzstan | 2023 | 12.71 |
| 124 | Congo | 2023 | 12.68 |
| 125 | Malaysia | 2023 | 12.68 |
| 126 | Rwanda | 2023 | 12.59 |
| 127 | Equatorial Guinea | 2023 | 12.49 |
| 128 | Gabon | 2023 | 12.48 |
| 129 | Uzbekistan | 2023 | 12.46 |
| 130 | Samoa | 2023 | 12.44 |
| 131 | Jamaica | 2023 | 12.38 |
| 132 | Tuvalu | 2023 | 12.38 |
| 133 | Iraq | 2023 | 12.36 |
| 134 | Bangladesh | 2023 | 12.31 |
| 135 | Korea (Democratic People's Rep. of) | 2023 | 12.20 |
| 136 | Angola | 2023 | 12.17 |
| 137 | Belize | 2023 | 11.98 |
| 138 | Bahamas | 2023 | 11.89 |
| 139 | Kiribati | 2023 | 11.87 |
| 140 | Vanuatu | 2023 | 11.81 |
| 141 | Namibia | 2023 | 11.79 |
| 142 | Lebanon | 2023 | 11.68 |
| 143 | Uganda | 2023 | 11.56 |
| 144 | Micronesia (Federated States of) | 2023 | 11.54 |
| 145 | Papua New Guinea | 2023 | 11.51 |
| 146 | Nicaragua | 2023 | 11.51 |
| 147 | Myanmar | 2023 | 11.50 |
| 148 | Kenya | 2023 | 11.47 |
| 149 | Botswana | 2023 | 11.43 |
| 150 | Ghana | 2023 | 11.42 |
| 151 | Côte d'Ivoire | 2023 | 11.41 |
| 152 | Cabo Verde | 2023 | 11.37 |
| 153 | Solomon Islands | 2023 | 11.31 |
| 154 | Cambodia | 2023 | 11.20 |
| 155 | El Salvador | 2023 | 11.11 |
| 156 | Zimbabwe | 2023 | 11.06 |
| 157 | Zambia | 2023 | 11.02 |
| 158 | Lesotho | 2023 | 10.99 |
| 159 | Suriname | 2023 | 10.96 |
| 160 | Congo (Democratic Republic of the) | 2023 | 10.91 |
| 161 | Haiti | 2023 | 10.90 |
| 162 | Tajikistan | 2023 | 10.85 |
| 163 | Mozambique | 2023 | 10.85 |
| 164 | Cameroon | 2023 | 10.79 |
| 165 | Afghanistan | 2023 | 10.79 |
| 166 | Guatemala | 2023 | 10.68 |
| 167 | Guinea-Bissau | 2023 | 10.64 |
| 168 | Nigeria | 2023 | 10.51 |
| 169 | Liberia | 2023 | 10.47 |
| 170 | Benin | 2023 | 10.45 |
| 171 | Guinea | 2023 | 10.39 |
| 172 | Honduras | 2023 | 10.16 |
| 173 | Malawi | 2023 | 9.90 |
| 174 | Burundi | 2023 | 9.83 |
| 175 | Lao People's Democratic Republic | 2023 | 9.61 |
| 176 | Ethiopia | 2023 | 9.22 |
| 177 | Senegal | 2023 | 9.14 |
| 178 | Sierra Leone | 2023 | 9.06 |
| 179 | Madagascar | 2023 | 9.06 |
| 180 | Gambia | 2023 | 8.98 |
| 181 | Burkina Faso | 2023 | 8.73 |
| 182 | Sudan | 2023 | 8.62 |
| 183 | Tanzania (United Republic of) | 2023 | 8.59 |
| 184 | Chad | 2023 | 8.35 |
| 185 | Niger | 2023 | 8.31 |
| 186 | Mauritania | 2023 | 7.95 |
| 187 | Pakistan | 2023 | 7.90 |
| 188 | Yemen | 2023 | 7.49 |
| 189 | Somalia | 2023 | 7.49 |
| 190 | Central African Republic | 2023 | 7.44 |
| 191 | Syrian Arab Republic | 2023 | 7.42 |
| 192 | Eritrea | 2023 | 7.34 |
| 193 | Mali | 2023 | 7.01 |
| 194 | Djibouti | 2023 | 6.21 |
| 195 | South Sudan | 2023 | 5.63 |
How to use the map and table
The central fact in the 2023 cross-section is the scale of the gap. The middle half of observations lies from roughly 11.5 to 15.9 years, while the lowest values are near six years and the highest exceed twenty. Those differences reveal major variation in current education participation patterns, but they are not a complete measure of education performance. Expected years of schooling works best as a first layer: locate a country in the global distribution, then use completion, learning, adult attainment and equity indicators to understand what sits behind that position.
Frequently Asked Questions
What does expected years of schooling mean?
It is the number of years of schooling a child entering school can expect to receive if current age-specific enrolment patterns persist.
Is expected years of schooling the same as compulsory education duration?
No. Compulsory schooling is a legal requirement, while expected years of schooling is calculated from observed enrolment patterns.
Which economy has the highest 2023 expected years of schooling?
Monaco has the highest value in this 195-observation dataset at 21.69 years, followed by Greece and Australia.
Are values above 18 years errors?
No. Raw observations can exceed 18 years. UNDP applies an 18-year upper goalpost when normalizing expected years of schooling for the HDI.
Related Articles
Green Map creates custom-edited map images using open geographic data sources such as geoBoundaries, Natural Earth, OpenStreetMap, and government open data. These maps are edited visual materials, not raw data files, and are provided for education, documents, presentations, and graphic reference.