Severe wasting is an important child-nutrition indicator, but country values need more context than a simple ranking can provide. World Bank indicator SH.SVR.WAST.ZS reports the share of children under age 5 whose weight-for-height is more than three standard deviations below the median of the international reference population for ages 0–59 months. The series is expressed as a percentage and is sourced from the UNICEF-WHO-World Bank Joint Child Malnutrition Estimates (JME). It therefore describes a very specific anthropometric condition: it is not a general score for child health, food security, or the quality of a national health system.
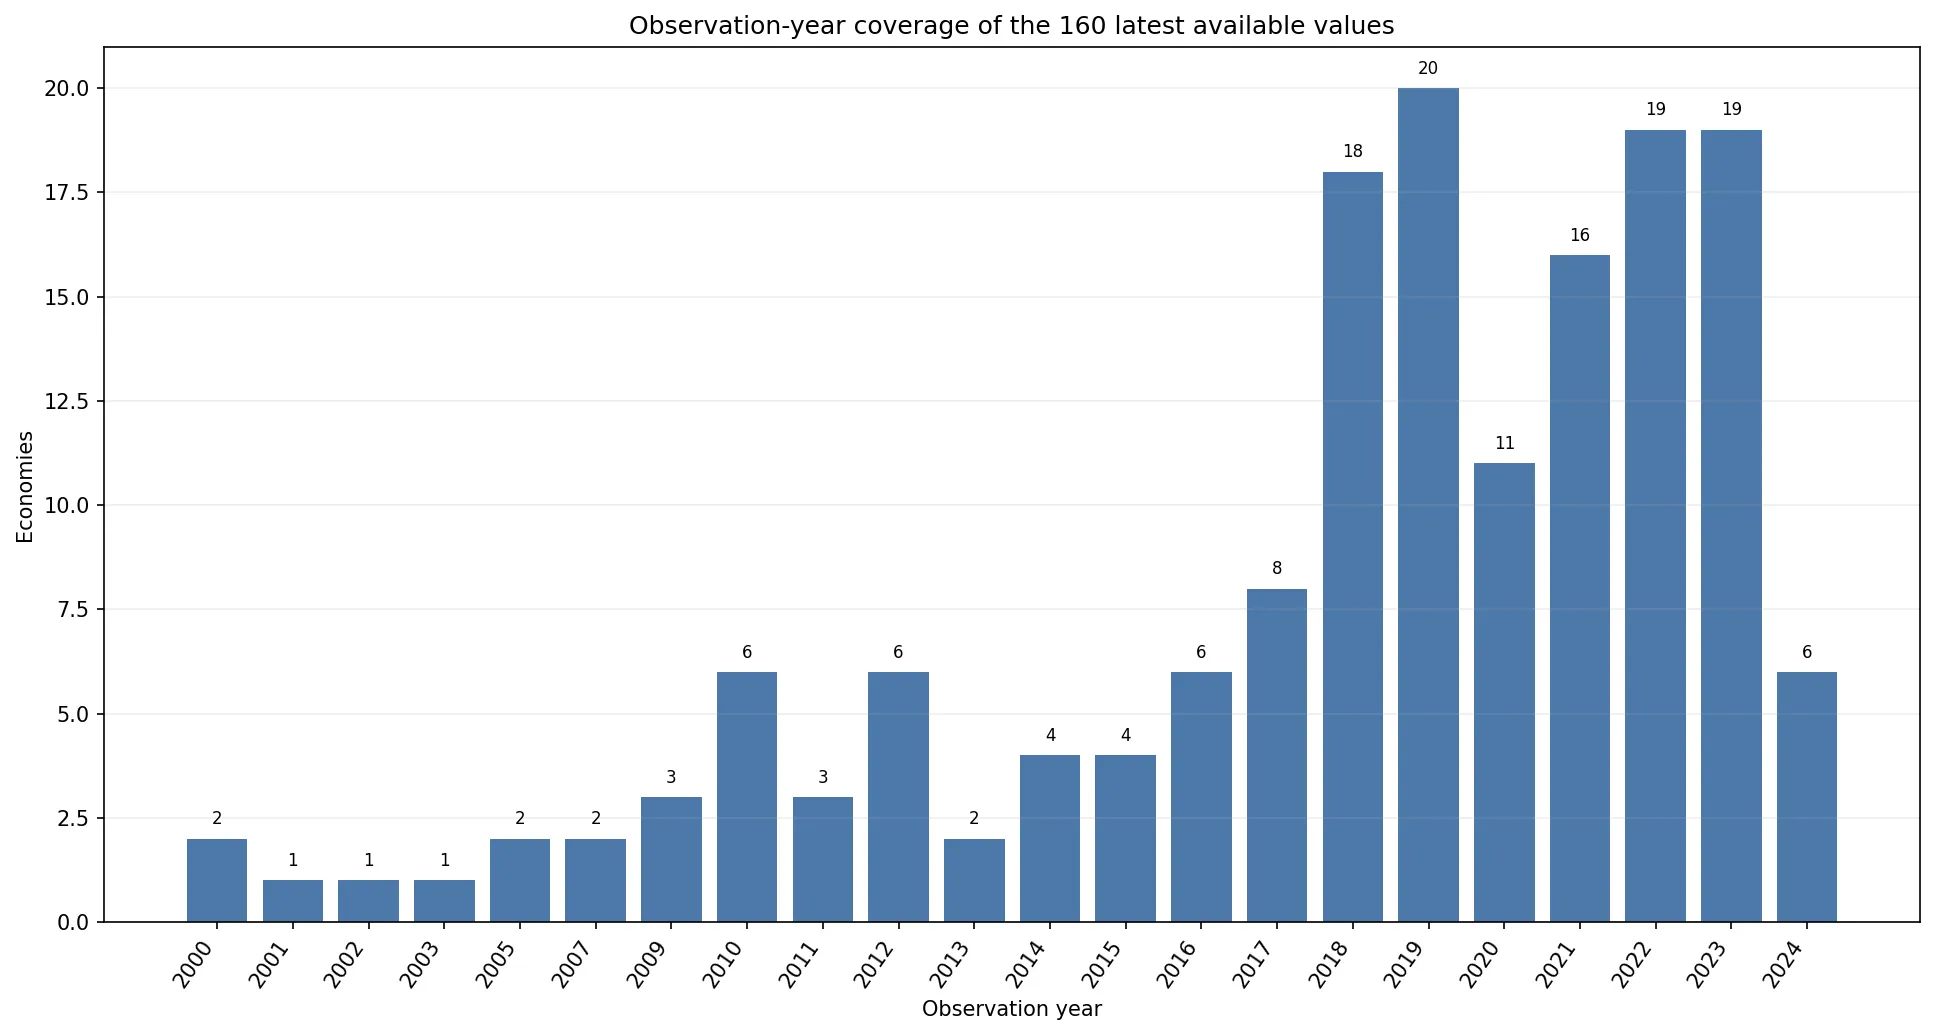
The dataset used here contains the latest non-empty observation for 160 countries and economies. Those observations do not share one year. Their year fields range from 2000 to 2024. Only six values are dated 2024; 19 are dated 2023, another 19 are from 2022, and 16 are from 2021. In total, 60 of the 160 latest values are from 2021–2024. The other 100 have 2020 or an earlier year as their latest available observation. That structure matters more than the “2024” label attached to the candidate dataset: the map below is a latest-available map, not a 2024 world snapshot.
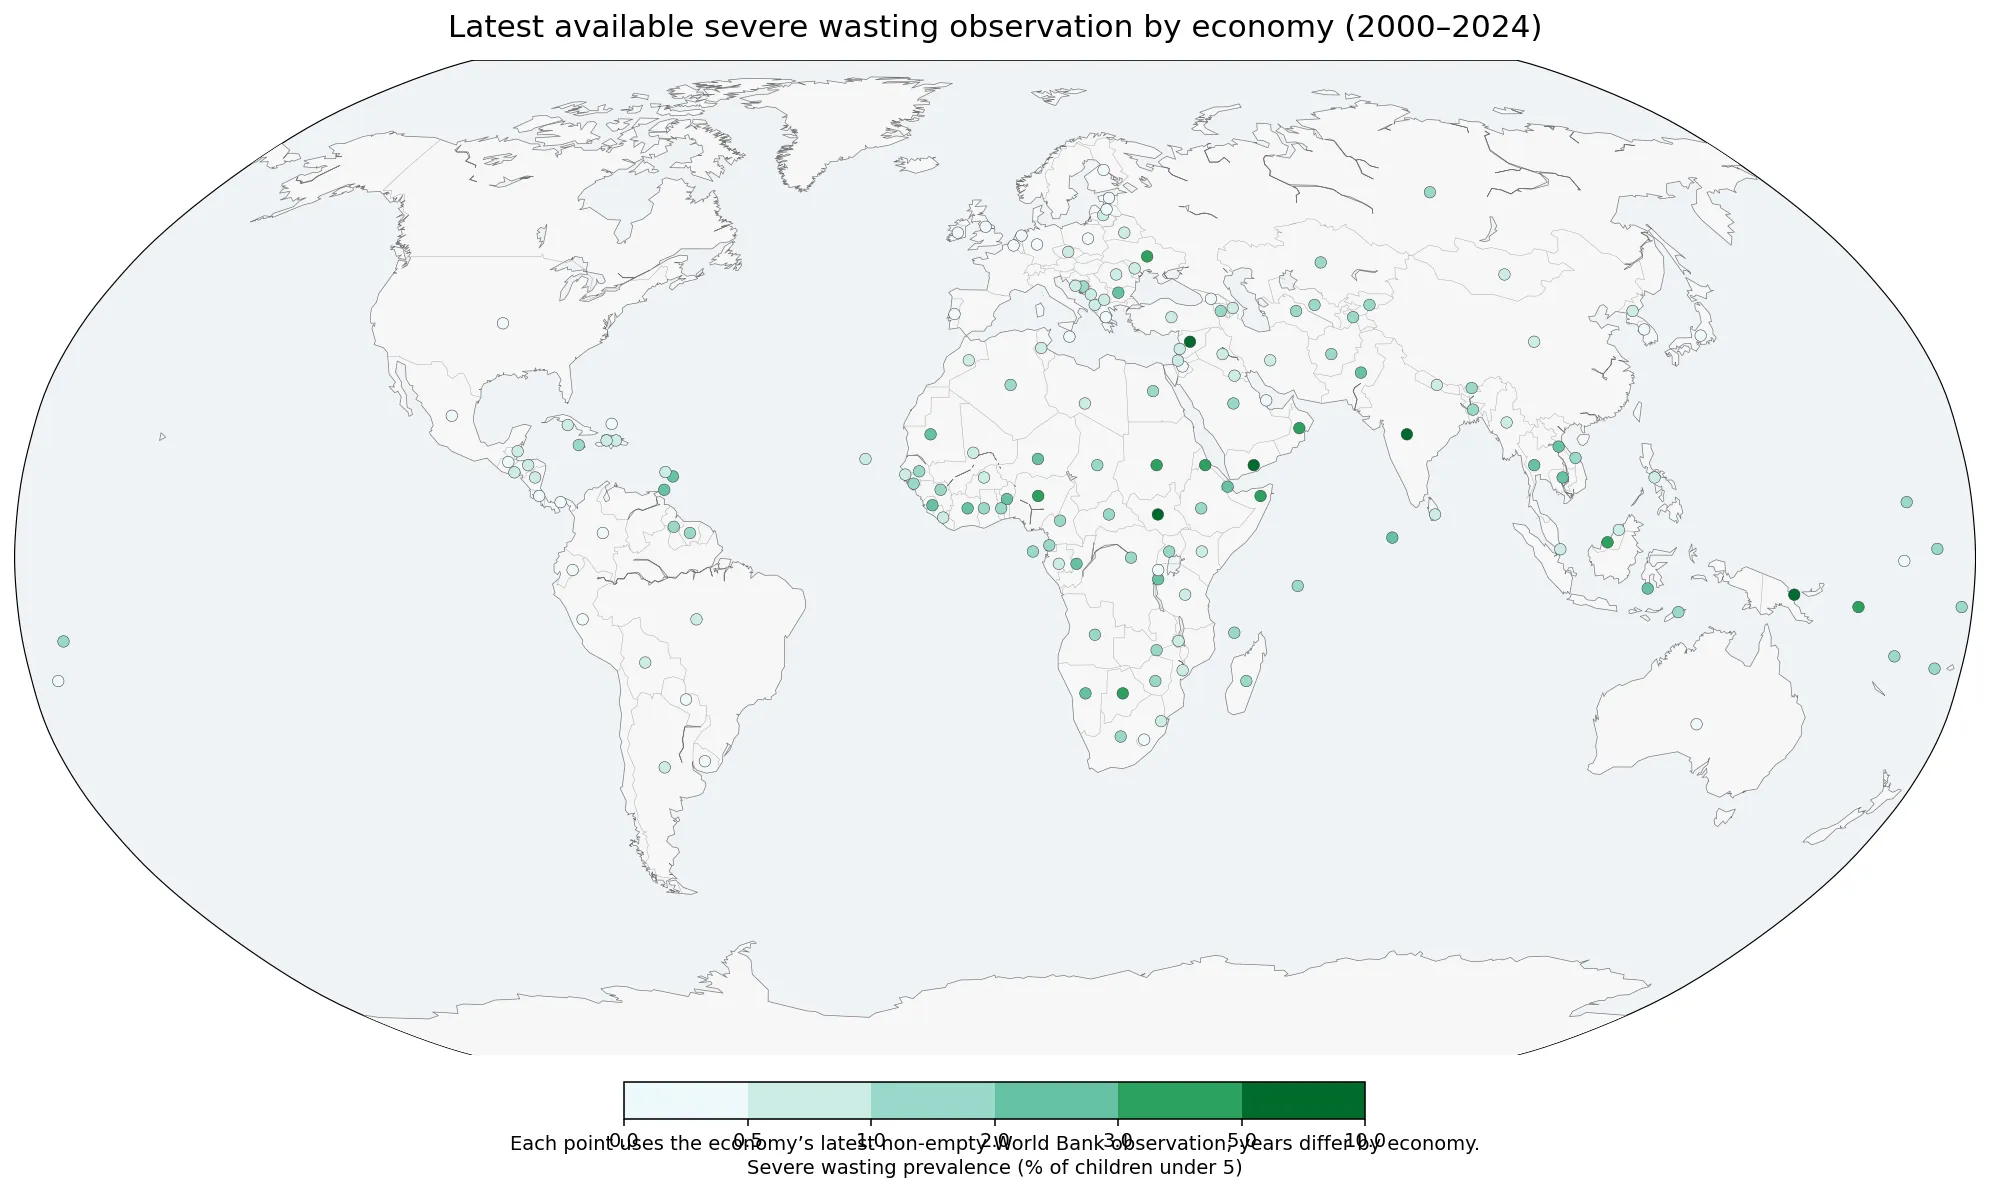
Table of Contents
The 160 latest values are not observations from the same year
The year distribution shows why direct ranking needs caution. Eighteen latest observations are from 2018 and 20 are from 2019. Another 11 are from 2020. The 2021–2024 period contributes 60 observations, while a smaller group of economies retains a latest value from the 2000s or early 2010s. This mixed timing reflects how severe-wasting estimates are assembled from survey-based evidence rather than a synchronized annual measurement collected in every country on the same date.
That timing difference is substantive, not merely a database inconvenience. Wasting is an acute condition that can change quickly and can be affected by season, food availability, disease patterns, shocks, and the timing of fieldwork. UNICEF’s indicator guidance notes that country-year estimates may not be comparable over time because surveys are conducted in particular periods and the condition can show seasonal variation. For that reason, a latest-available value should be read as “the most recent reported estimate for this economy and this stated year,” not as a substitute for a missing 2024 measurement.
What the severe-wasting indicator actually measures
The indicator uses weight in relation to height rather than weight alone. A child is counted in the severe-wasting category when weight-for-height is more than three standard deviations below the reference median. A reported value of 2.0% therefore means that about 2.0% of children under 5 represented by that estimate fell below the defined anthropometric threshold. Because the result is a percentage, it can be compared across populations of different sizes, but it does not tell us how many children are affected without additional information on the under-5 population and the survey design.
Severe wasting should also be kept distinct from other nutrition indicators. Stunting primarily reflects low height for age, underweight compares weight with age, and overweight measures a different end of the nutritional spectrum. Weight-for-height wasting is used to identify children who are too thin for their height and is more closely related to acute nutritional stress. A country can therefore perform differently across these indicators. One percentage cannot summarize all dimensions of childhood nutrition, and it should not be treated as a composite national nutrition grade.
The latest-available distribution is right-skewed
If the 160 mixed-year latest observations are summarized only as a descriptive distribution, the median is 0.9% and the simple mean is about 1.31%. The mean is higher than the median because a relatively small number of high observations pull it upward. Thirty-two observations are at or above 2%, 14 are at or above 3%, and five are at or above 5%. Four entries are recorded as 0.0% in the source data. A displayed 0.0% should not be interpreted as proof that no child was affected; rounded survey estimates can be reported at one decimal place.
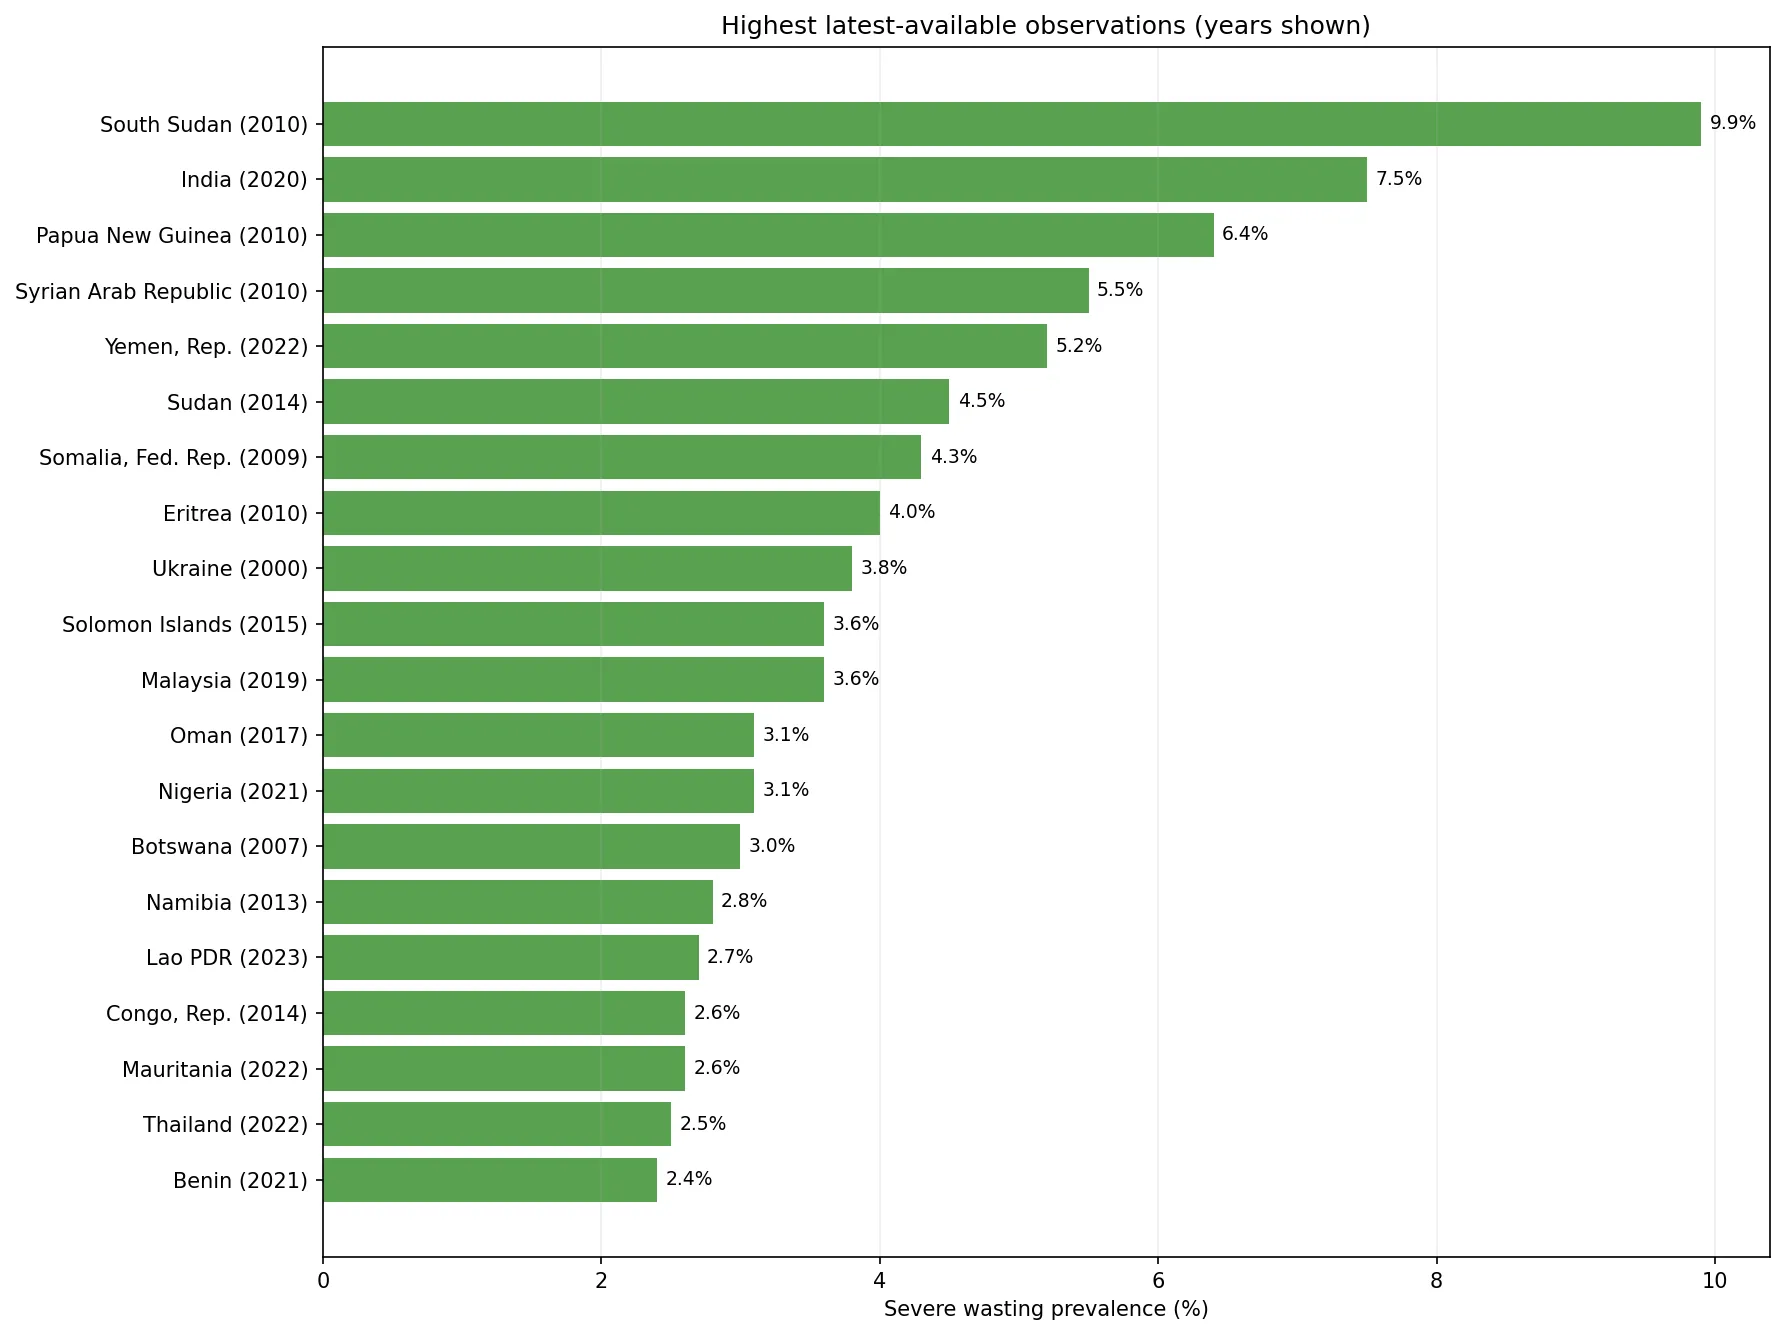
The highest latest-available observations in this particular file include South Sudan at 9.9% in 2010, India at 7.5% in 2020, Papua New Guinea at 6.4% in 2010, the Syrian Arab Republic at 5.5% in 2010, and Yemen at 5.2% in 2022. These figures demonstrate the range in the source but not a current league table. A 2010 estimate and a 2022 estimate answer different time-specific questions. The chart deliberately places the observation year next to every economy name so the age of each figure remains visible.
Only six observations are from 2024
A same-year comparison is possible for the six economies that actually have a 2024 value in this file: Burundi 2.1%, Zimbabwe 1.6%, Sri Lanka 0.8%, Mali 0.7%, Lesotho 0.2%, and Ecuador 0.1%. These six can be compared with one another without a year mismatch, but they are far too small a subset to represent the world. Calling them a 2024 global ranking would exclude 154 of the 160 economies with a latest observation and would create a false sense of complete coverage.
| Economy | 2024 value |
|---|---|
| Burundi | 2.1% |
| Zimbabwe | 1.6% |
| Sri Lanka | 0.8% |
| Mali | 0.7% |
| Lesotho | 0.2% |
| Ecuador | 0.1% |
This trade-off between recency and coverage is central to the dataset. If analysis is restricted strictly to 2024, the comparison becomes temporally consistent but geographically sparse. If all 160 latest values are included, geographic coverage expands but timing is inconsistent. Neither choice is automatically wrong; the correct choice depends on the question. For “What is the most recent reported value for each economy?” the mixed-year set is useful. For “Which country had the highest prevalence in 2024?” this file does not contain enough same-year coverage to support a global answer.
High and low observations need survey context
A high severe-wasting prevalence can signal an important nutrition and health burden, but the country-level CSV does not establish a single cause. Food access, infectious disease, water and sanitation, maternal and child health services, household resources, conflict, displacement, climate shocks, and other factors may interact. The map shows where high observations appear in the available data; it does not prove why a particular economy has that value. Causal claims require additional evidence that is not contained in this indicator alone.
Low observations require similar restraint. A low national percentage describes the estimated prevalence for the survey population and period, not the experience of every community or subgroup. National averages can conceal subnational differences by residence, income, age, or other characteristics. Survey estimates also carry sampling and non-sampling uncertainty, including measurement and recording error. For operational decisions, a national point estimate is best read alongside the original survey documentation, uncertainty information, and disaggregated data where available.
What can and cannot be concluded from this file
The file can support several clear conclusions. It tells us the latest non-empty severe-wasting prevalence stored for 160 economies, the year attached to each observation, and the distribution of those latest values. It shows that only six of the observations are dated 2024 and that most of the apparent cross-country “ranking” would mix survey years. It can also identify which economies have especially old latest observations, which is useful for discussing data gaps and the need for updated measurement.
The file cannot support a country-by-country time trend because it contains one observation per economy rather than the full historical series. Even a full series would need careful handling: JME guidance emphasizes that wasting can vary by season and that national survey data are often collected infrequently. A simple line connecting irregular survey points can therefore suggest a smooth annual trend that the underlying measurement process does not justify. Trend analysis should use the underlying survey rounds, fieldwork timing, methodology, and uncertainty, not just year labels and point estimates.
Sources and methodology
The indicator definition follows the World Bank World Development Indicators metadata for SH.SVR.WAST.ZS. The underlying source is the UNICEF-WHO-World Bank Joint Child Malnutrition Estimates. UNICEF provides additional context in its child malnutrition data overview and JME standard methodology, including the survey basis and the caution required when interpreting wasting observations across time. The charts and map in this article were calculated directly from the 160 latest non-empty observations supplied for this indicator; missing economies were not filled with zero.
The most useful way to read this dataset is therefore to keep value and year together. The mixed-year median of 0.9% is a description of the available latest observations, not a 2024 global prevalence estimate. The six 2024 values are too few for a worldwide same-year ranking. Used with these limits in view, the dataset is valuable for exploring where the latest reported severe-wasting estimates are high or low, which economies have stale observations, and where a new survey could materially change the picture.
Frequently Asked Questions
What does severe wasting prevalence measure?
It is the percentage of children under age 5 whose weight-for-height is more than three standard deviations below the international reference median. It measures severe wasting by weight-for-height, not every form of child malnutrition.
Can the 160 values be treated as a 2024 country ranking?
No. The latest available observations span 2000–2024, and only six are dated 2024. The 160-row set is useful for latest-reported values, but it is not a same-year global ranking.
Does a reported 0.0% mean there were no affected children?
Not necessarily. It is a survey-based prevalence estimate displayed to one decimal place and may be rounded. It should not be interpreted as proof that the number of affected children was exactly zero.
Related Articles
Green Map creates custom-edited map images using open geographic data sources such as geoBoundaries, Natural Earth, OpenStreetMap, and government open data. These maps are edited visual materials, not raw data files, and are provided for education, documents, presentations, and graphic reference.