World Bank indicator NV.IND.MANF.KD.ZG measures the annual percentage growth of manufacturing value added in a constant-price series. Manufacturing value added is output minus intermediate consumption, and this growth measure is based on the constant 2015-price series rather than current nominal values. The latest non-empty file contains 191 observations, with 136 from 2025, so the main same-year comparison uses those 136 economies.
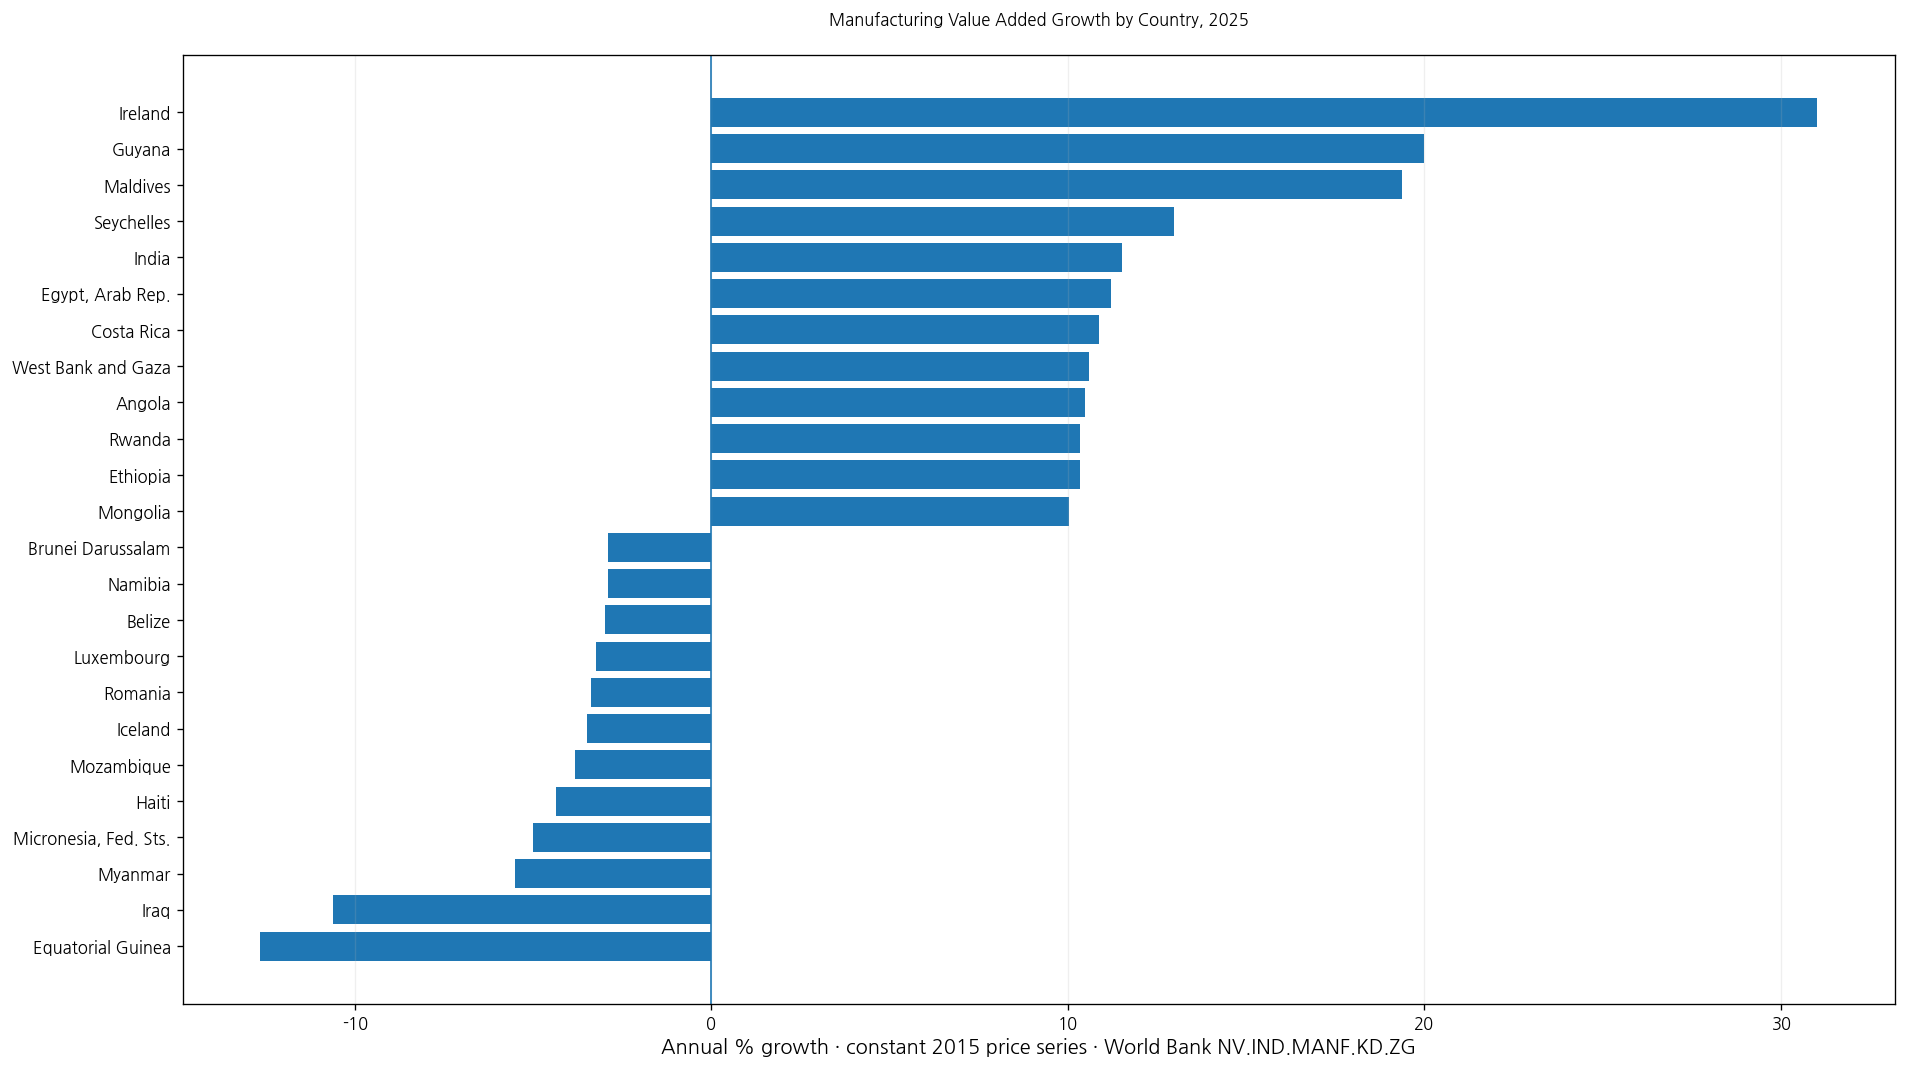
Table of Contents
What manufacturing value added growth measures
Manufacturing value added is the economic contribution created by manufacturing after subtracting intermediate goods and services from total output. Manufacturing covers the physical or chemical transformation of materials or components into new products under the World Bank’s industry definition.
The annual growth indicator measures how that real value added changed from the previous year. A 10% result does not mean manufacturing represents 10% of GDP, nor that manufacturing output is 10% of the economy.
The series is based on constant 2015 prices
The World Bank describes this growth series as the annual percentage change in the constant-price manufacturing value-added series with 2015 as the base year. Using constant prices is intended to separate real changes from purely nominal price increases.
A rise in manufactured-goods prices alone therefore should not be interpreted as real manufacturing growth. The indicator is designed to reflect changes in real value added after price effects are adjusted.
The 2025 mean is 3.26% and the median is 2.65%
The 2025 subset contains 136 economies. Its mean is 3.26% and median 2.65%. The first quartile is 0.84% and the third quartile 5.31%, putting the middle half roughly between 0.84% and 5.31%.
109 economies have positive growth and 27 have negative growth. 40 are at or above 5%, 12 are at or above 10%, 4 are at or below -5%, and 2 are at or below -10%.
Ireland is highest in 2025 at 31.03%
Ireland records 31.03%, followed by Guyana at 19.99%, Maldives at 19.36%, Seychelles at 12.99%, India at 11.53%, Egypt, Arab Rep. at 11.20%, Costa Rica at 10.87%, West Bank and Gaza at 10.60%, Angola at 10.50%, and Rwanda at 10.34%.
| 2025 rank | Economy/territory | Manufacturing value added growth |
|---|---|---|
| 1 | Ireland | 31.03% |
| 2 | Guyana | 19.99% |
| 3 | Maldives | 19.36% |
| 4 | Seychelles | 12.99% |
| 5 | India | 11.53% |
| 6 | Egypt, Arab Rep. | 11.20% |
| 7 | Costa Rica | 10.87% |
| 8 | West Bank and Gaza | 10.60% |
| 9 | Angola | 10.50% |
| 10 | Rwanda | 10.34% |
| 11 | Ethiopia | 10.33% |
| 12 | Mongolia | 10.03% |
| 13 | Viet Nam | 9.97% |
| 14 | Kyrgyz Republic | 9.80% |
| 15 | Cambodia | 9.76% |
| 16 | Denmark | 9.17% |
| 17 | Singapore | 8.71% |
| 18 | Benin | 8.58% |
| 19 | St. Vincent and the Grenadines | 7.99% |
| 20 | Azerbaijan | 7.85% |
A high growth rate means real manufacturing value added increased quickly from the previous year. It does not mean the economy has one of the world’s largest manufacturing sectors. A smaller manufacturing base can produce a large percentage increase.
Equatorial Guinea is lowest in 2025 at -12.65%
At the lower end, Equatorial Guinea records -12.65%, Iraq -10.61%, Myanmar -5.50%, Micronesia, Fed. Sts. -5.01%, Haiti -4.35%, Mozambique -3.82%, Iceland -3.49%, Romania -3.37%, and Luxembourg -3.23%.
| Low-order position in 2025 | Economy/territory | Manufacturing value added growth |
|---|---|---|
| 1 | Equatorial Guinea | -12.65% |
| 2 | Iraq | -10.61% |
| 3 | Myanmar | -5.50% |
| 4 | Micronesia, Fed. Sts. | -5.01% |
| 5 | Haiti | -4.35% |
| 6 | Mozambique | -3.82% |
| 7 | Iceland | -3.49% |
| 8 | Romania | -3.37% |
| 9 | Luxembourg | -3.23% |
| 10 | Belize | -2.98% |
| 11 | Namibia | -2.91% |
| 12 | Brunei Darussalam | -2.89% |
| 13 | Canada | -2.60% |
| 14 | Hungary | -2.60% |
| 15 | Bosnia and Herzegovina | -2.47% |
| 16 | Belarus | -2.30% |
| 17 | Australia | -2.18% |
| 18 | Albania | -1.59% |
| 19 | Slovenia | -1.31% |
| 20 | South Africa | -1.18% |
A negative value means real manufacturing value added declined from the previous year. It does not mean manufacturing disappeared. Demand, output, supply chains, investment, exchange rates, energy costs, and many other factors can contribute, so the indicator alone does not establish causation.
Growth is different from manufacturing’s share of GDP
Manufacturing value added as a percentage of GDP describes economic structure. Manufacturing value added growth describes the year-over-year change in the real size of manufacturing itself.
An economy can have a large manufacturing share and still post negative growth during a downturn. Another economy can have a small manufacturing share and post rapid growth after new capacity comes online.
Growth is also different from absolute manufacturing size
Large manufacturing economies such as China or the United States do not automatically have the highest annual growth rates. A growth rate is a percentage change from the previous year’s base.
To compare manufacturing scale, a manufacturing value-added level in constant or current U.S. dollars is more appropriate. To compare structural importance, the share-of-GDP indicator is more appropriate.
Base effects can produce unusually high annual growth
If manufacturing value added fell sharply in the previous year because of a disruption, normalization can produce a very high growth rate in the next year. The reverse can happen after an unusually strong base year.
One-year growth should therefore be interpreted alongside multi-year history before drawing conclusions about sustained manufacturing competitiveness.
The 191 latest observations are not all from the same year
Of the 191 latest non-empty observations, 136 are from 2025, or about 71.2%. There are 38 from 2024 and 7 from 2023, with a small number of final observations dating back as far as 1999.
| Observation year | Economies/territories | Share of 191 |
|---|---|---|
| 2025 | 136 | 71.2% |
| 2024 | 38 | 19.9% |
| 2023 | 7 | 3.7% |
| 2022 | 1 | 0.5% |
| 2021 | 2 | 1.0% |
| 2020 | 1 | 0.5% |
| 2017 | 1 | 0.5% |
| 2015 | 1 | 0.5% |
| 2014 | 1 | 0.5% |
| 2009 | 2 | 1.0% |
| 1999 | 1 | 0.5% |
The complete latest-value file should not be described as a single-year 2025 ranking. Same-year statistics and rankings are based only on the 136 observations dated 2025.
The Bahamas -52.08% observation is from 2024
The lowest value in the full latest-observation file is Bahamas, The at -52.08%, but its observation year is 2024. It is therefore not mixed into the 2025 ranking headed by Equatorial Guinea at -12.65%.
This illustrates why observation year matters whenever latest-value country datasets contain mixed vintages.
Manufacturing growth is not the same as manufacturing employment growth
Real value added can increase through higher productivity or automation without a matching increase in employment. Conversely, employment can rise while value added grows slowly if productivity weakens.
Employment, wages, productivity, exports, and investment require separate indicators. Manufacturing value added growth is one dimension of industrial performance.
The 2025 same-year group is large enough for a useful distribution
With 136 economies observed in 2025, the data provide a broad same-year view. The fact that 109 have positive growth and 27 negative growth shows that real manufacturing value added expanded in a majority of the observed economies.
That pattern still does not tell us whether growth will persist. Global demand, investment cycles, energy prices, exchange rates, and sector-specific shocks can change the next year’s result substantially.
Complete list of the 191 latest observations
The table below lists every economy and territory’s latest non-empty observation in alphabetical order. Rows outside 2025 retain their actual observation year.
| Economy/territory | Observation year | Manufacturing value added growth |
|---|---|---|
| Afghanistan | 2024 | 1.57% |
| Albania | 2025 | -1.59% |
| Algeria | 2024 | 4.19% |
| Andorra | 2024 | -4.47% |
| Angola | 2025 | 10.50% |
| Antigua and Barbuda | 2025 | 2.00% |
| Argentina | 2025 | 0.85% |
| Armenia | 2025 | 2.00% |
| Aruba | 2023 | -1.23% |
| Australia | 2025 | -2.18% |
| Austria | 2025 | 1.18% |
| Azerbaijan | 2025 | 7.85% |
| Bahamas, The | 2024 | -52.08% |
| Bahrain | 2025 | 3.71% |
| Bangladesh | 2025 | 5.83% |
| Barbados | 2024 | 0.40% |
| Belarus | 2025 | -2.30% |
| Belgium | 2025 | 0.22% |
| Belize | 2025 | -2.98% |
| Benin | 2025 | 8.58% |
| Bermuda | 2024 | -9.73% |
| Bhutan | 2024 | 2.58% |
| Bolivia | 2024 | 1.12% |
| Bosnia and Herzegovina | 2025 | -2.47% |
| Botswana | 2025 | 1.94% |
| Brazil | 2025 | -0.16% |
| Brunei Darussalam | 2025 | -2.89% |
| Burkina Faso | 2025 | 5.49% |
| Burundi | 2025 | 1.43% |
| Cabo Verde | 2025 | 6.21% |
| Cambodia | 2025 | 9.76% |
| Cameroon | 2025 | 3.13% |
| Canada | 2025 | -2.60% |
| Cayman Islands | 2024 | -3.40% |
| Central African Republic | 2023 | -10.28% |
| Chad | 2024 | 9.14% |
| Channel Islands | 2023 | -3.42% |
| Chile | 2025 | 3.13% |
| Colombia | 2025 | 1.85% |
| Comoros | 2025 | 4.26% |
| Congo, Dem. Rep. | 2025 | 2.16% |
| Congo, Rep. | 2020 | 0.70% |
| Costa Rica | 2025 | 10.87% |
| Cote d’Ivoire | 2025 | 4.52% |
| Croatia | 2025 | 3.94% |
| Cuba | 2024 | -10.08% |
| Cyprus | 2025 | 2.77% |
| Czechia | 2025 | 0.93% |
| Denmark | 2025 | 9.17% |
| Djibouti | 2024 | 15.57% |
| Dominica | 2025 | 2.00% |
| Dominican Republic | 2025 | 1.46% |
| Ecuador | 2025 | 5.36% |
| Egypt, Arab Rep. | 2025 | 11.20% |
| El Salvador | 2025 | 1.96% |
| Equatorial Guinea | 2025 | -12.65% |
| Eritrea | 2009 | -0.41% |
| Estonia | 2025 | 5.67% |
| Eswatini | 2025 | 1.60% |
| Ethiopia | 2025 | 10.33% |
| Fiji | 2025 | 1.23% |
| Finland | 2025 | 1.87% |
| France | 2025 | 0.42% |
| Gabon | 2025 | 1.20% |
| Gambia, The | 2024 | 7.44% |
| Georgia | 2025 | 3.94% |
| Germany | 2025 | -0.98% |
| Ghana | 2025 | 5.74% |
| Greece | 2025 | 4.09% |
| Greenland | 2023 | -14.93% |
| Grenada | 2025 | 2.70% |
| Guatemala | 2025 | 2.63% |
| Guinea | 2022 | 3.66% |
| Guinea-Bissau | 2025 | 5.09% |
| Guyana | 2025 | 19.99% |
| Haiti | 2025 | -4.35% |
| Honduras | 2025 | 2.01% |
| Hong Kong SAR, China | 2025 | 3.21% |
| Hungary | 2025 | -2.60% |
| Iceland | 2025 | -3.49% |
| India | 2025 | 11.53% |
| Indonesia | 2025 | 5.30% |
| Iran, Islamic Rep. | 2024 | 2.26% |
| Iraq | 2025 | -10.61% |
| Ireland | 2025 | 31.03% |
| Isle of Man | 2023 | 6.73% |
| Israel | 2024 | 2.21% |
| Italy | 2025 | -0.28% |
| Jamaica | 2025 | 1.08% |
| Japan | 2024 | -5.78% |
| Jordan | 2025 | 5.11% |
| Kazakhstan | 2025 | 6.40% |
| Kenya | 2025 | 1.98% |
| Kiribati | 2024 | 0.35% |
| Korea, Rep. | 2025 | 2.03% |
| Kosovo | 2025 | 3.93% |
| Kuwait | 2025 | 0.83% |
| Kyrgyz Republic | 2025 | 9.80% |
| Lao PDR | 2025 | 5.24% |
| Latvia | 2025 | 4.75% |
| Lebanon | 2021 | -6.85% |
| Lesotho | 2024 | 9.77% |
| Libya | 2017 | -9.02% |
| Lithuania | 2025 | 3.23% |
| Luxembourg | 2025 | -3.23% |
| Madagascar | 2024 | 9.20% |
| Malawi | 2024 | 0.18% |
| Malaysia | 2025 | 4.53% |
| Maldives | 2025 | 19.36% |
| Mali | 2025 | 7.76% |
| Malta | 2025 | -0.88% |
| Marshall Islands | 2024 | -4.30% |
| Mauritania | 2025 | 0.85% |
| Mauritius | 2025 | 1.36% |
| Mexico | 2025 | -0.51% |
| Micronesia, Fed. Sts. | 2025 | -5.01% |
| Moldova | 2025 | 2.99% |
| Mongolia | 2025 | 10.03% |
| Montenegro | 2024 | 15.94% |
| Morocco | 2025 | 4.22% |
| Mozambique | 2025 | -3.82% |
| Myanmar | 2025 | -5.50% |
| Namibia | 2025 | -2.91% |
| Nepal | 2025 | 2.27% |
| Netherlands | 2025 | 3.26% |
| New Zealand | 2024 | -1.03% |
| Nicaragua | 2025 | 5.14% |
| Niger | 2024 | 3.39% |
| Nigeria | 2025 | 1.41% |
| North Macedonia | 2025 | 3.61% |
| Norway | 2025 | 4.23% |
| Oman | 2025 | 2.49% |
| Pakistan | 2025 | 1.96% |
| Palau | 2024 | 18.94% |
| Panama | 2025 | 1.11% |
| Papua New Guinea | 2024 | 6.31% |
| Paraguay | 2025 | 5.65% |
| Peru | 2025 | 2.71% |
| Philippines | 2025 | 2.53% |
| Poland | 2025 | 3.65% |
| Portugal | 2025 | 0.85% |
| Qatar | 2025 | 3.93% |
| Romania | 2025 | -3.37% |
| Russian Federation | 2025 | 3.93% |
| Rwanda | 2025 | 10.34% |
| Samoa | 2025 | 2.64% |
| San Marino | 2023 | -5.17% |
| Sao Tome and Principe | 2025 | -0.09% |
| Saudi Arabia | 2025 | 5.11% |
| Senegal | 2025 | 0.10% |
| Serbia | 2024 | 4.59% |
| Seychelles | 2025 | 12.99% |
| Sierra Leone | 2024 | 0.17% |
| Singapore | 2025 | 8.71% |
| Sint Maarten (Dutch part) | 2021 | 5.26% |
| Slovak Republic | 2025 | 1.67% |
| Slovenia | 2025 | -1.31% |
| Solomon Islands | 2024 | 3.68% |
| South Africa | 2025 | -1.18% |
| South Sudan | 2015 | 17.83% |
| Spain | 2025 | 2.03% |
| Sri Lanka | 2025 | 6.23% |
| St. Kitts and Nevis | 2025 | 5.00% |
| St. Lucia | 2025 | 2.65% |
| St. Vincent and the Grenadines | 2025 | 7.99% |
| Sudan | 2009 | 8.49% |
| Suriname | 2024 | -6.06% |
| Sweden | 2025 | 0.53% |
| Switzerland | 2025 | 0.27% |
| Tajikistan | 1999 | 5.00% |
| Tanzania | 2023 | 5.30% |
| Thailand | 2025 | 0.43% |
| Timor-Leste | 2024 | 3.85% |
| Togo | 2024 | 3.03% |
| Tonga | 2024 | 20.60% |
| Trinidad and Tobago | 2024 | 7.63% |
| Tunisia | 2025 | 3.16% |
| Turkiye | 2024 | -0.52% |
| Turks and Caicos Islands | 2024 | 1.49% |
| Uganda | 2025 | 5.62% |
| Ukraine | 2025 | 2.47% |
| United Arab Emirates | 2024 | 3.08% |
| United Kingdom | 2025 | -0.76% |
| Uruguay | 2025 | 6.25% |
| Uzbekistan | 2025 | 7.70% |
| Vanuatu | 2024 | 0.21% |
| Venezuela, RB | 2014 | -7.22% |
| Viet Nam | 2025 | 9.97% |
| West Bank and Gaza | 2025 | 10.60% |
| Zambia | 2025 | 7.13% |
| Zimbabwe | 2025 | 4.75% |
How to interpret the comparison
First, this is the annual real growth rate of manufacturing value added. Second, it is not manufacturing’s share of GDP or its absolute size. Third, the underlying series uses constant 2015 prices rather than current nominal prices.
Fourth, high one-year growth can reflect rebound and base effects. Fifth, a negative value means contraction from the previous year, not the disappearance of manufacturing. Sixth, the full 191-row file mixes years, so direct ranking centers on the 136 observations from 2025.
Source and calculation
The source is World Bank World Development Indicators NV.IND.MANF.KD.ZG, Manufacturing, value added (annual % growth). The 2025 mean, median, quartiles, threshold counts, and rankings use only the 136 observations dated 2025. The complete table preserves all 191 latest non-empty observations.
Frequently Asked Questions
Does 10% manufacturing value added growth mean manufacturing is 10% of GDP?
No. It means real manufacturing value added increased 10% from the previous year. Manufacturing's share of GDP is a separate indicator.
What is the 2025 median?
The median across the 136 observations dated 2025 is 2.65%, while the mean is 3.26%.
Does negative growth mean manufacturing disappeared?
No. It means real manufacturing value added declined from the previous year.
Related Articles
Green Map creates custom-edited map images using open geographic data sources such as geoBoundaries, Natural Earth, OpenStreetMap, and government open data. These maps are edited visual materials, not raw data files, and are provided for education, documents, presentations, and graphic reference.