Services value added growth measures the year-over-year real change in the contribution of service industries to the economy. The World Bank series has 198 latest non-empty observations, of which 161 are dated 2025. The rest are from earlier years, so the same-year 2025 comparison is kept separate from the complete latest-observation list.
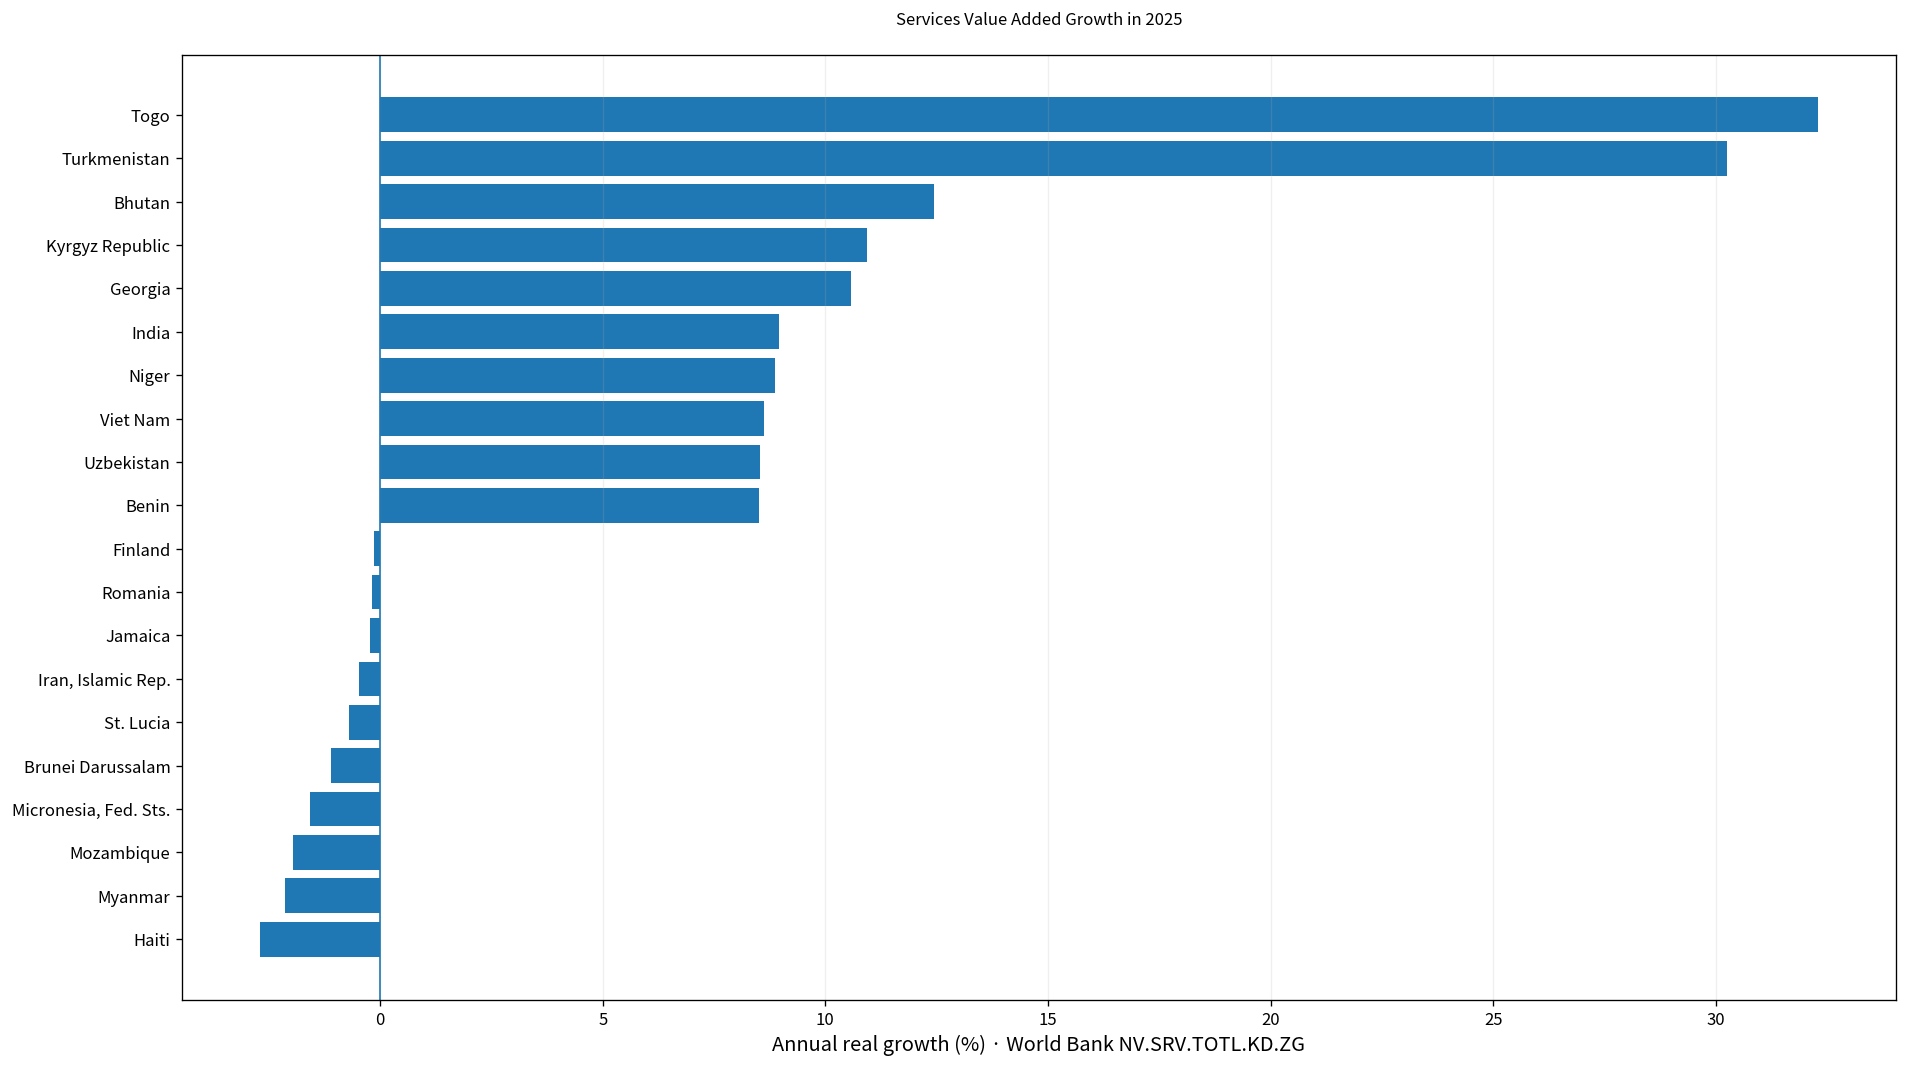
Table of Contents
What services value added growth measures
Value added is the contribution created by a producer or industry after subtracting intermediate consumption from total output. In the World Bank definition, services cover a broad set of activities under ISIC Rev. 4, including wholesale and retail trade, repair, hotels and restaurants, transport, storage and communication, finance, real estate, business services, public administration, education, health, and other service activities.
The indicator reports the percentage change from the previous year in the constant-price series expressed in 2015 U.S. dollars. A value of 5% therefore means real services value added increased by about 5% from the prior year. It does not mean services account for 5% of GDP.
Most of the 198 latest observations are from 2025
Among the 198 latest observations, 161 are from 2025 and 26 from 2024. There are 5 from 2023, plus a few older latest values from 2022, 2021, 2018, 2015, and 2014. Older latest values are useful for availability but are not included in the 2025 ranking.
| Observation year | Economies/territories | Share of 198 |
|---|---|---|
| 2025 | 161 | 81.3% |
| 2024 | 26 | 13.1% |
| 2023 | 5 | 2.5% |
| 2022 | 1 | 0.5% |
| 2021 | 1 | 0.5% |
| 2018 | 1 | 0.5% |
| 2015 | 1 | 0.5% |
| 2014 | 2 | 1.0% |
The mixed-year collection has a mean of 3.85% and a median of 3.44%. The range extends from -7.14% to 32.29%. Because those figures combine different economic periods, they should not be presented as a current global services-growth average.
The 2025 mean is 3.99% and the median is 3.49%
The 2025 same-year subset contains 161 economies. Its mean is 3.99% and median 3.49%. The first quartile is 1.88% and the third quartile 5.20%, placing the middle half of observations in a moderate positive range.
150 observations are positive and 11 are negative, with no exact zeros. 43 economies record at least 5% growth and 5 reach at least 10%. Most observations are positive, but the upper tail includes a few very large increases.
Togo is highest in 2025 at 32.29%
Togo records 32.29%, followed by Turkmenistan at 30.24%. Bhutan reaches 12.45%, Kyrgyz Republic 10.94%, and Georgia 10.59%. India, Niger, Viet Nam, Uzbekistan, and Benin are also among the higher 2025 observations.
| 2025 rank | Economy/territory | Services value added growth |
|---|---|---|
| 1 | Togo | 32.29% |
| 2 | Turkmenistan | 30.24% |
| 3 | Bhutan | 12.45% |
| 4 | Kyrgyz Republic | 10.94% |
| 5 | Georgia | 10.59% |
| 6 | India | 8.97% |
| 7 | Niger | 8.86% |
| 8 | Viet Nam | 8.62% |
| 9 | Uzbekistan | 8.53% |
| 10 | Benin | 8.51% |
| 11 | Rwanda | 8.50% |
| 12 | Ghana | 8.12% |
| 13 | Guyana | 8.02% |
| 14 | Iraq | 7.86% |
| 15 | Ethiopia | 7.52% |
A high growth rate means real services value added expanded rapidly from the previous year. It does not mean the economy has the largest services sector. Base effects, tourism recovery, transport activity, financial services, public services, and other components can all influence the annual figure, so a single indicator does not establish the cause.
Eleven 2025 observations are negative
Haiti is lowest at -2.69%, followed by Myanmar at -2.14%, Mozambique at -1.96%, Micronesia, Fed. Sts. at -1.57%, and Brunei Darussalam at -1.10%. St. Lucia, Iran, Islamic Rep., Jamaica, Romania, Finland, and Estonia also show negative growth.
| Low-order position in 2025 | Economy/territory | Services value added growth |
|---|---|---|
| 1 | Haiti | -2.69% |
| 2 | Myanmar | -2.14% |
| 3 | Mozambique | -1.96% |
| 4 | Micronesia, Fed. Sts. | -1.57% |
| 5 | Brunei Darussalam | -1.10% |
| 6 | St. Lucia | -0.69% |
| 7 | Iran, Islamic Rep. | -0.48% |
| 8 | Jamaica | -0.23% |
| 9 | Romania | -0.17% |
| 10 | Finland | -0.13% |
| 11 | Estonia | -0.11% |
| 12 | South Africa | 0.00% |
| 13 | Slovak Republic | 0.09% |
| 14 | Italy | 0.29% |
| 15 | Germany | 0.49% |
A negative rate means real services value added declined from the prior year. It does not show that every service industry contracted or that the decline is structural. Tourism, transport, finance, real estate, public services, and other activities can move differently, and temporary shocks can matter.
The center of the 2025 distribution is roughly 2% to 5%
The first quartile is 1.88% and the third quartile 5.20%, so half of the 2025 observations lie within a relatively compact positive band. The mean of 3.99% is slightly above the median of 3.49% because large values such as Togo and Turkmenistan lift the upper tail.
South Africa is almost unchanged at a tiny positive rate, while Slovak Republic, Italy, Germany, Greece, and several other economies also sit near the lower positive end. This contrast with the 8% to 30% upper tail shows why a median and a ranked view are more informative than the mean alone.
Why 2024 and 2025 should not be merged into one ranking
The 2024 subset contains 26 observations, with a mean of 3.08% and a median of 2.61%. Its range runs from -7.14% to 17.23%. Lebanon’s 2024 value of -7.14% is lower than any 2025 observation, but it belongs to a different year and is therefore excluded from the 2025 ranking.
Services growth can respond quickly to business cycles, travel activity, financial conditions, and public-sector demand. Mixing different years can make developments under different conditions look simultaneous.
Growth is different from the services share of GDP
Services value added growth measures how fast real services value added changes from one year to the next. The services share of GDP measures how large the services sector is relative to the whole economy. A large services-based economy can post slow growth, while a smaller services sector can grow quickly from a lower base.
For structural comparisons, the GDP-share indicator is more appropriate. For changes in real service activity, the annual growth indicator is more useful. Using both helps separate economic size from growth momentum.
Complete list of the 198 latest observations
The table below lists the latest non-empty observation for every economy and territory in alphabetical order. The original observation year is shown for rows not dated 2025. For a strict same-year comparison, use only the 2025 observations.
| Economy/territory | Observation year | Services value added growth |
|---|---|---|
| Afghanistan | 2024 | 0.51% |
| Albania | 2025 | 5.70% |
| Algeria | 2025 | 3.63% |
| Andorra | 2025 | 4.14% |
| Angola | 2025 | 5.62% |
| Antigua and Barbuda | 2025 | 4.04% |
| Argentina | 2025 | 3.73% |
| Armenia | 2025 | 6.90% |
| Aruba | 2023 | 6.01% |
| Australia | 2025 | 1.72% |
| Austria | 2025 | 0.98% |
| Azerbaijan | 2025 | 3.28% |
| Bahamas, The | 2024 | 2.04% |
| Bahrain | 2025 | 4.34% |
| Bangladesh | 2025 | 4.35% |
| Barbados | 2024 | 3.44% |
| Belarus | 2025 | 1.82% |
| Belgium | 2025 | 0.89% |
| Belize | 2025 | 2.93% |
| Benin | 2025 | 8.51% |
| Bermuda | 2024 | 1.77% |
| Bhutan | 2025 | 12.45% |
| Bolivia | 2024 | 0.89% |
| Bosnia and Herzegovina | 2025 | 3.11% |
| Botswana | 2025 | 2.83% |
| Brazil | 2025 | 1.82% |
| Brunei Darussalam | 2025 | -1.10% |
| Bulgaria | 2025 | 3.93% |
| Burkina Faso | 2025 | 3.23% |
| Burundi | 2025 | 6.52% |
| Cabo Verde | 2025 | 6.30% |
| Cambodia | 2025 | 3.34% |
| Cameroon | 2025 | 3.44% |
| Canada | 2025 | 1.54% |
| Cayman Islands | 2024 | 3.93% |
| Central African Republic | 2025 | 3.30% |
| Chad | 2025 | 5.02% |
| Channel Islands | 2023 | 4.00% |
| Chile | 2025 | 3.18% |
| China | 2025 | 5.39% |
| Colombia | 2025 | 3.95% |
| Comoros | 2025 | 3.61% |
| Congo, Dem. Rep. | 2025 | 6.78% |
| Congo, Rep. | 2025 | 4.50% |
| Costa Rica | 2025 | 4.16% |
| Cote d’Ivoire | 2025 | 7.29% |
| Croatia | 2025 | 2.54% |
| Cuba | 2024 | -0.05% |
| Cyprus | 2025 | 3.84% |
| Czechia | 2025 | 2.98% |
| Denmark | 2025 | 1.76% |
| Djibouti | 2025 | 4.64% |
| Dominica | 2025 | 3.46% |
| Dominican Republic | 2025 | 2.84% |
| Ecuador | 2025 | 3.58% |
| Egypt, Arab Rep. | 2025 | 4.57% |
| El Salvador | 2025 | 1.88% |
| Equatorial Guinea | 2025 | 2.11% |
| Estonia | 2025 | -0.11% |
| Eswatini | 2025 | 6.17% |
| Ethiopia | 2025 | 7.52% |
| Fiji | 2025 | 3.49% |
| Finland | 2025 | -0.13% |
| France | 2025 | 0.85% |
| Gabon | 2025 | 3.86% |
| Gambia, The | 2025 | 6.64% |
| Georgia | 2025 | 10.59% |
| Germany | 2025 | 0.49% |
| Ghana | 2025 | 8.12% |
| Greece | 2025 | 0.78% |
| Greenland | 2023 | 2.15% |
| Grenada | 2025 | 2.79% |
| Guatemala | 2025 | 4.63% |
| Guinea | 2025 | 5.40% |
| Guinea-Bissau | 2025 | 5.36% |
| Guyana | 2025 | 8.02% |
| Haiti | 2025 | -2.69% |
| Honduras | 2025 | 6.19% |
| Hong Kong SAR, China | 2025 | 3.21% |
| Hungary | 2025 | 1.36% |
| Iceland | 2025 | 2.16% |
| India | 2025 | 8.97% |
| Indonesia | 2025 | 6.35% |
| Iran, Islamic Rep. | 2025 | -0.48% |
| Iraq | 2025 | 7.86% |
| Ireland | 2025 | 3.54% |
| Isle of Man | 2023 | -2.02% |
| Israel | 2024 | 1.94% |
| Italy | 2025 | 0.29% |
| Jamaica | 2025 | -0.23% |
| Japan | 2024 | 0.88% |
| Jordan | 2025 | 1.96% |
| Kazakhstan | 2025 | 5.20% |
| Kenya | 2025 | 5.03% |
| Kiribati | 2024 | 6.22% |
| Korea, Rep. | 2025 | 1.74% |
| Kosovo | 2025 | 3.27% |
| Kuwait | 2025 | 3.04% |
| Kyrgyz Republic | 2025 | 10.94% |
| Lao PDR | 2025 | 4.62% |
| Latvia | 2025 | 1.64% |
| Lebanon | 2024 | -7.14% |
| Lesotho | 2025 | 4.01% |
| Liberia | 2025 | 4.44% |
| Libya | 2025 | 7.16% |
| Lithuania | 2025 | 3.21% |
| Luxembourg | 2025 | 1.25% |
| Macao SAR, China | 2024 | 9.04% |
| Madagascar | 2025 | 3.21% |
| Malawi | 2025 | 2.15% |
| Malaysia | 2025 | 5.70% |
| Maldives | 2025 | 4.69% |
| Mali | 2025 | 7.14% |
| Malta | 2025 | 4.36% |
| Marshall Islands | 2024 | -3.93% |
| Mauritania | 2025 | 4.56% |
| Mauritius | 2025 | 3.56% |
| Mexico | 2025 | 1.31% |
| Micronesia, Fed. Sts. | 2025 | -1.57% |
| Moldova | 2025 | 1.13% |
| Monaco | 2014 | 8.87% |
| Mongolia | 2025 | 2.02% |
| Montenegro | 2025 | 1.62% |
| Morocco | 2025 | 4.52% |
| Mozambique | 2025 | -1.96% |
| Myanmar | 2025 | -2.14% |
| Namibia | 2025 | 4.24% |
| Nepal | 2025 | 4.36% |
| Netherlands | 2025 | 1.67% |
| New Zealand | 2024 | -0.11% |
| Nicaragua | 2025 | 4.66% |
| Niger | 2025 | 8.86% |
| Nigeria | 2025 | 4.14% |
| North Macedonia | 2025 | 2.82% |
| Norway | 2025 | 1.33% |
| Oman | 2025 | 3.06% |
| Pakistan | 2025 | 3.03% |
| Palau | 2024 | 8.91% |
| Panama | 2025 | 5.43% |
| Papua New Guinea | 2024 | 5.24% |
| Paraguay | 2025 | 6.27% |
| Peru | 2025 | 3.21% |
| Philippines | 2025 | 5.82% |
| Poland | 2025 | 3.23% |
| Portugal | 2025 | 1.95% |
| Qatar | 2025 | 3.84% |
| Romania | 2025 | -0.17% |
| Russian Federation | 2025 | 0.82% |
| Rwanda | 2025 | 8.50% |
| Samoa | 2025 | 4.81% |
| San Marino | 2023 | 3.71% |
| Sao Tome and Principe | 2025 | 1.54% |
| Saudi Arabia | 2025 | 6.27% |
| Senegal | 2025 | 2.54% |
| Serbia | 2025 | 2.71% |
| Seychelles | 2025 | 4.37% |
| Sierra Leone | 2025 | 6.23% |
| Singapore | 2025 | 4.20% |
| Sint Maarten (Dutch part) | 2021 | 4.94% |
| Slovak Republic | 2025 | 0.09% |
| Slovenia | 2025 | 1.43% |
| Solomon Islands | 2024 | 1.86% |
| South Africa | 2025 | 0.00% |
| South Sudan | 2015 | 10.38% |
| Spain | 2025 | 3.19% |
| Sri Lanka | 2025 | 3.30% |
| St. Kitts and Nevis | 2025 | 2.77% |
| St. Lucia | 2025 | -0.69% |
| St. Vincent and the Grenadines | 2025 | 4.09% |
| Sudan | 2025 | 2.59% |
| Suriname | 2024 | 2.63% |
| Sweden | 2025 | 2.04% |
| Switzerland | 2025 | 1.96% |
| Syrian Arab Republic | 2022 | 4.61% |
| Tajikistan | 2024 | 17.23% |
| Tanzania | 2025 | 5.83% |
| Thailand | 2025 | 3.14% |
| Timor-Leste | 2024 | 3.41% |
| Togo | 2025 | 32.29% |
| Tonga | 2024 | 5.19% |
| Trinidad and Tobago | 2024 | 0.37% |
| Tunisia | 2025 | 1.44% |
| Turkiye | 2024 | 3.13% |
| Turkmenistan | 2025 | 30.24% |
| Turks and Caicos Islands | 2024 | 5.11% |
| Uganda | 2025 | 5.44% |
| Ukraine | 2025 | 3.53% |
| United Arab Emirates | 2024 | 4.92% |
| United Kingdom | 2025 | 1.61% |
| Uruguay | 2025 | 1.20% |
| Uzbekistan | 2025 | 8.53% |
| Vanuatu | 2024 | 2.59% |
| Venezuela, RB | 2014 | -0.36% |
| Viet Nam | 2025 | 8.62% |
| West Bank and Gaza | 2025 | 3.73% |
| Yemen, Rep. | 2018 | -2.29% |
| Zambia | 2025 | 0.84% |
| Zimbabwe | 2025 | 5.50% |
How to interpret the comparison
First, the 198 latest observations do not share one year. Second, this is a real value-added growth rate, not the services share of GDP. Third, a high or negative annual rate does not identify a single cause. Fourth, one-year growth can be volatile and should not automatically be treated as a long-run structural trend.
National-accounts figures can also be revised. A detailed country analysis should check the latest World Bank time series and national accounts, including service-industry detail where available.
Source and calculation
The source is World Bank World Development Indicators NV.SRV.TOTL.KD.ZG, Services, value added (annual % growth). The 2025 mean, median, quartiles, sign counts, and rankings are calculated from the 161 observations dated 2025.
Frequently Asked Questions
Is services value added growth the same as the services share of GDP?
No. Growth measures the real year-over-year change, while the GDP share measures the sector's relative size in the economy.
What is the 2025 median?
The median across the 161 observations dated 2025 is 3.49%, while the mean is 3.99%.
Does a negative rate mean every service industry contracted?
No. It means total real services value added declined; individual service industries can move differently.
Related Articles
Green Map creates custom-edited map images using open geographic data sources such as geoBoundaries, Natural Earth, OpenStreetMap, and government open data. These maps are edited visual materials, not raw data files, and are provided for education, documents, presentations, and graphic reference.