Reliable trade depends on more than the existence of a port or a highway. Goods move through a chain of seaports, airports, roads, railways, border facilities, warehouses and information systems, and weak links can raise cost or reduce predictability. The World Bank Logistics Performance Index (LPI) includes a component that asks logistics professionals to rate the quality of trade- and transport-related infrastructure on a scale from 1 to 5. A higher score represents a more favorable assessment of infrastructure quality.
The supplied extract contains the latest non-empty observation for 169 economies, but those observations do not all belong to the same year. Most are dated 2022, while others come from earlier LPI rounds going back to 2007. That makes the dataset useful for a broad latest-available map, but not for a single-year ranking of all 169 economies. To keep the comparison honest, this article uses the full 169-economy set for geographic coverage and a separate 138-economy 2022 subset for same-year rankings and distribution statistics.
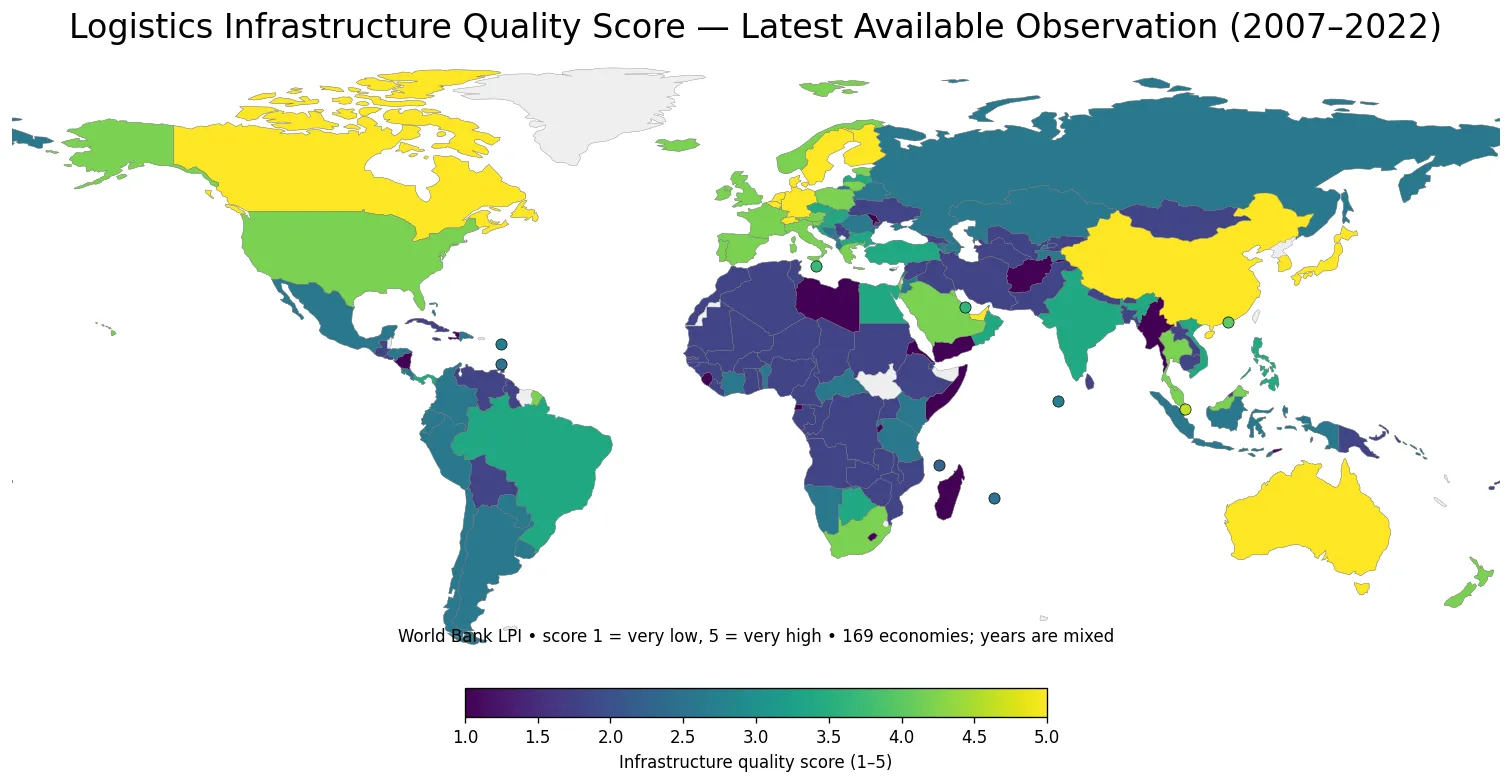
Table of Contents
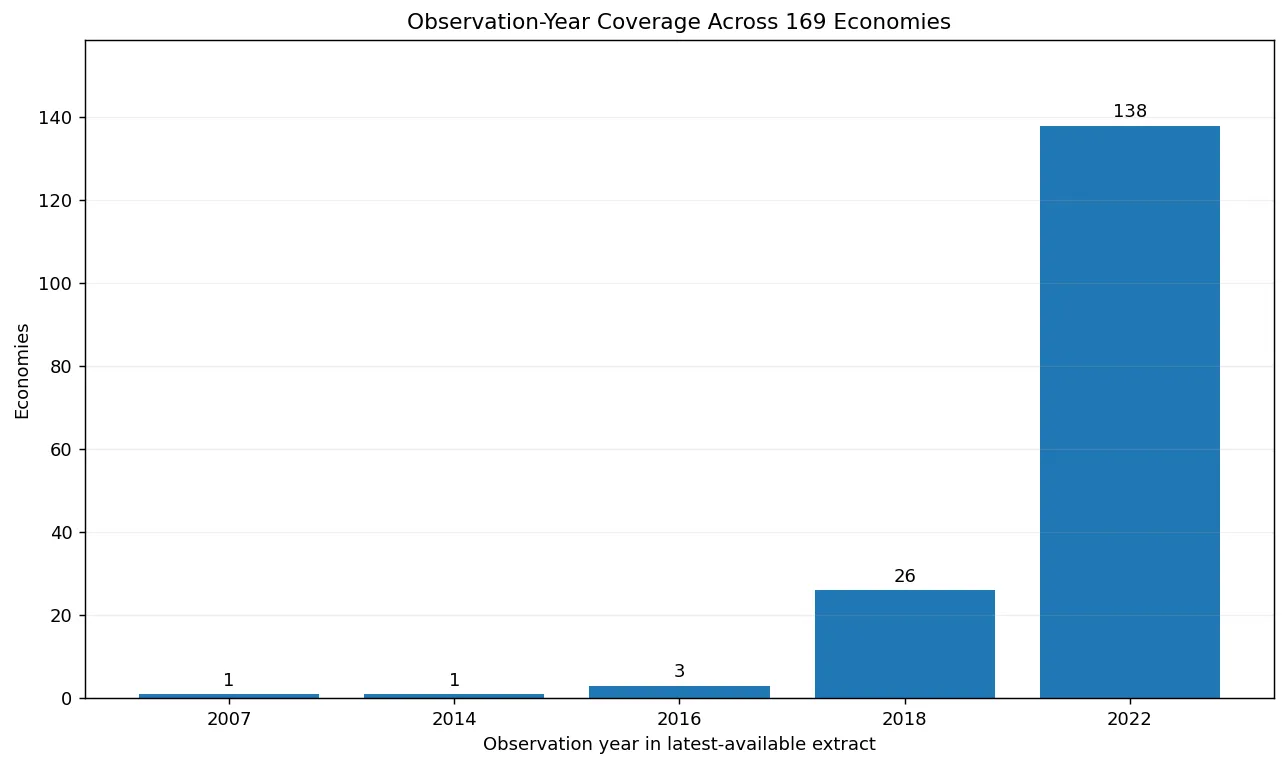
Only 138 of the 169 latest observations are dated 2022
The year distribution is unusually important for this indicator. Of the 169 latest non-empty rows, 138 are dated 2022. Another 26 are dated 2018, three are dated 2016, one is dated 2014 and one is dated 2007. In other words, about four fifths of the extract belongs to the newest observation year, but 31 economies retain an older value. A map that ignores those dates can look more current and more comparable than the underlying data really are.
Timor-Leste, for example, retains a 2007 observation in this extract. Azerbaijan is dated 2014, while Ethiopia, Mozambique and Tanzania are dated 2016. A further group, including Sierra Leone, Eritrea, Myanmar, Pakistan, Kenya and Morocco, has 2018 values. These are valid historical observations, not 2022 estimates. The mean of all 169 latest values is about 2.80 and the median is 2.60, but those figures summarize a mixed-year latest-available set and should not be described as 2022 global statistics.
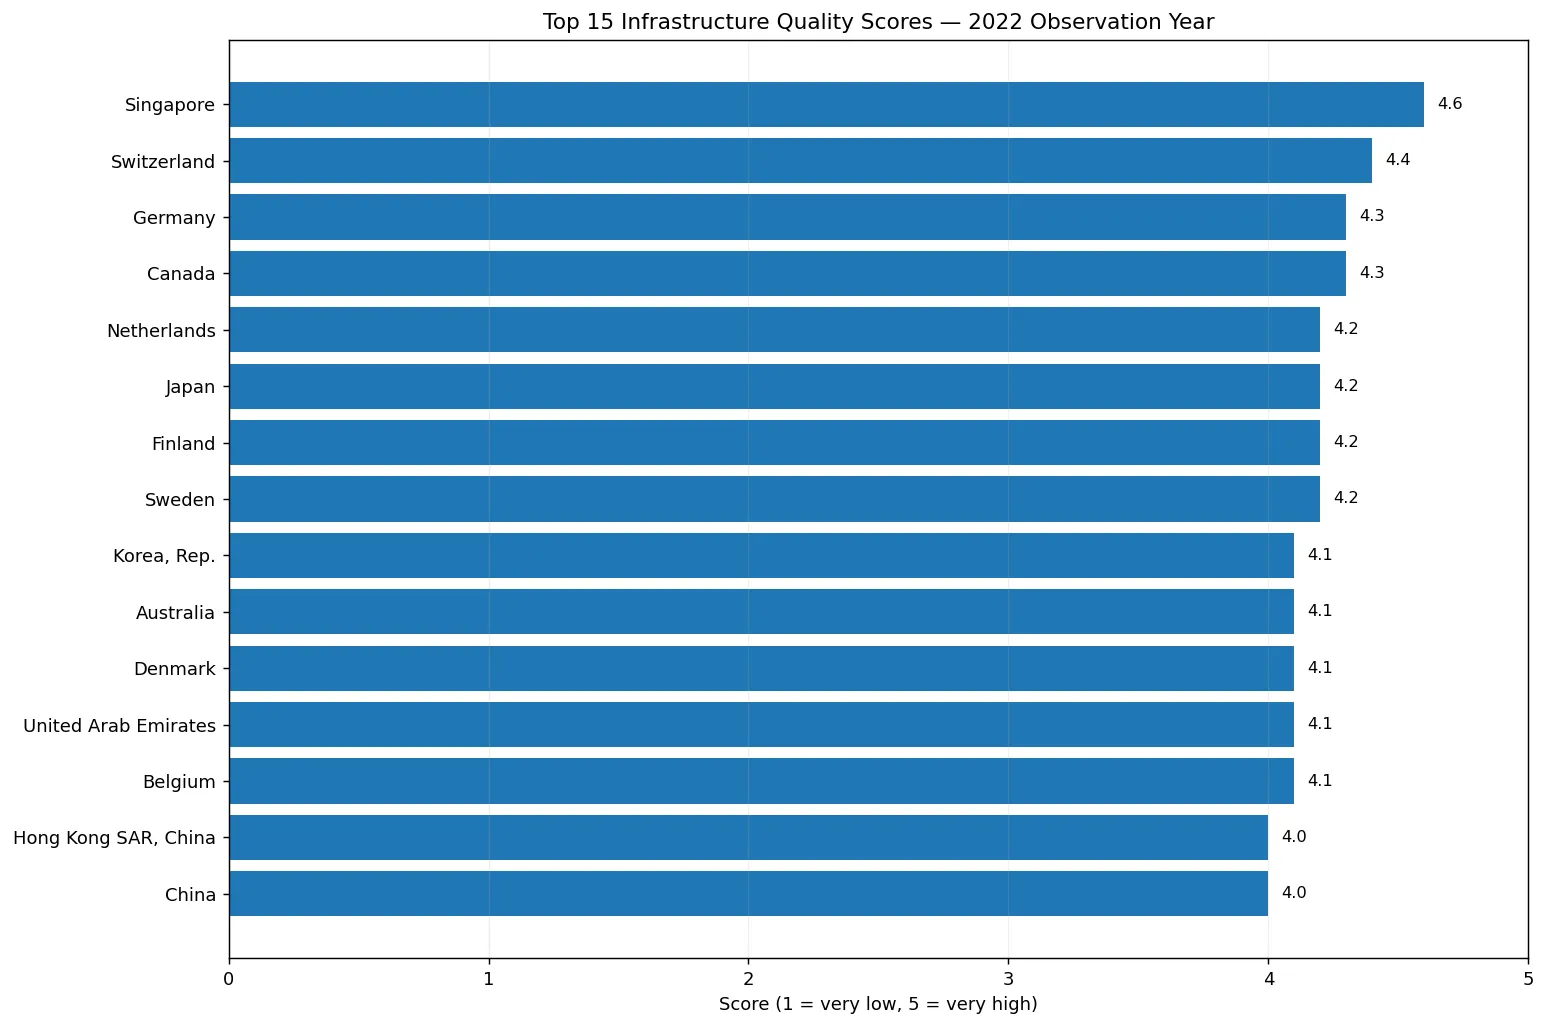
Singapore records the highest 2022 infrastructure-quality score at 4.6
Within the 138 observations that share the 2022 year field, Singapore records the highest score at 4.6. Switzerland follows at 4.4, while Canada and Germany each score 4.3. Finland, Japan, the Netherlands and Sweden are at 4.2. Several other highly connected trading economies are in the low 4s. These scores are assessments of the combined trade and transport infrastructure environment, not measurements of a single port, rail corridor or road network.
At the lower end of the 2022 subset, Afghanistan and Libya score 1.7, while Haiti and Madagascar score 1.8. Moldova, Nicaragua, Somalia and Yemen are at 1.9. The ranking tells us where respondents perceived infrastructure quality to be weaker or stronger, but it does not identify the reason for a low score. A country may face problems in road connectivity, port access, rail capacity, information systems or several areas at once. Explaining causes requires country-specific operational and investment data beyond this indicator.
| Economy | 2022 score |
|---|---|
| Singapore | 4.6 |
| Switzerland | 4.4 |
| Canada | 4.3 |
| Germany | 4.3 |
| Finland | 4.2 |
| Japan | 4.2 |
| Netherlands | 4.2 |
| Sweden | 4.2 |
| Australia | 4.1 |
| United Arab Emirates | 4.1 |
The 2022 median is 2.7, with only 15 economies scoring 4 or above
The distribution of the 138 same-year observations is centered well below the maximum of the scale. The median is 2.7 and the arithmetic mean is about 2.92. The first quartile is 2.4 and the third quartile is 3.6. The mean sits modestly above the median because a group of 4-point economies lifts the upper end, while many observations are concentrated in the 2s.
Using simple score bands, eight economies are below 2.0; 43 are from 2.0 to below 2.5; 30 are from 2.5 to below 3.0; 16 are from 3.0 to below 3.5; 26 are from 3.5 to below 4.0; and 15 score 4.0 or higher. That pattern is useful when reading the map because a difference between 2.3 and 2.4 is much smaller than the visual contrast between broad map classes may suggest. Exact country comparisons should use the underlying score rather than only the color category.
What the infrastructure component actually measures
The World Bank metadata defines this LPI component through a survey question asking respondents to evaluate the quality of trade- and transport-related infrastructure in a country. Examples explicitly include ports, railroads, roads and information technology. Scores range from 1, representing very low quality, to 5, representing very high quality. The result is therefore a perception-based index derived from professional assessments rather than a physical inventory of infrastructure assets.
That distinction is important. A 4.0 score does not mean that 80% of roads are good, that 80% of port capacity is modern or that shipments move 80% as fast as some benchmark. The numbers are index scores on an ordinal rating scale that is averaged across survey responses. They are designed to summarize how the logistics environment is experienced by participants in international freight and trade, not to replace direct metrics such as road density, container throughput, border dwell time or rail network capacity.
Why the data say 2022 while the publication is called the 2023 LPI
The World Bank data page for LP.LPI.INFR.XQ labels the newest observation year as 2022. At the same time, the World Bank released the corresponding report as the 2023 Logistics Performance Index. The official metadata explains the apparent mismatch: the 2023 LPI survey was conducted from September 6 to November 5, 2022. The report was released in 2023, while the WDI series stores the observation under 2022.
This article follows the year field in the supplied World Bank extract when presenting country scores, so the same-year comparison is called the 2022 subset. The phrase 2023 LPI is used only when referring to the official survey/report cycle. Keeping those two date conventions separate avoids turning a publication year into a measurement year. It also helps explain why users may encounter both labels when checking the same indicator across World Bank products.
A high score is not the same as high trade volume or low logistics cost
Infrastructure quality can support efficient trade, but the LPI infrastructure score does not directly measure exports, imports, freight volume, logistics cost or delivery time. A small trading hub can receive a high infrastructure score without having the largest absolute trade flows, while a very large economy can move enormous quantities of goods even with a lower score. Population, economic size, industrial structure, geography, resource endowments, trade agreements and market access all influence trade volumes.
The same caution applies to cost and speed. Better infrastructure may be associated with smoother logistics, but the score alone does not reveal the price of moving a container, the number of hours at a border or the reliability of a specific route. Those outcomes require separate operational indicators. The LPI component is best used as a high-level comparative signal about the perceived quality of the infrastructure environment supporting international logistics.
Country averages can hide major differences within large economies
A national score compresses a complex network into one number. In a compact city-state, a small number of gateways may dominate the logistics experience. In a geographically large country, conditions can differ sharply between major ports, inland corridors, remote regions and border crossings. A national average can therefore be useful for international comparison while still hiding meaningful subnational variation.
This matters for practical supply-chain decisions. A company choosing a specific port, industrial zone or cross-border corridor should not assume that the national LPI score describes every location equally well. Port performance, road condition, rail access, congestion, customs procedures and local warehousing can differ within the same country. The LPI is a starting point for identifying broad country-level patterns; route-level decisions need route-level evidence.
The map suggests geographic clustering, but it does not prove what causes it
Higher 2022 scores appear frequently in Northern and Western Europe, parts of East Asia and several major trade hubs. Lower scores are more common across a different set of countries. Those spatial patterns can be economically meaningful, but a map cannot establish causality. Income levels, urbanization, trade intensity, institutional capacity, geography, landlocked status and past infrastructure investment may all be related to the observed pattern.
It would therefore be misleading to look at a cluster of high scores and conclude that one policy produced it. Likewise, low scores should not be treated as a single diagnosis. The useful question is where the reported infrastructure environment is stronger or weaker, followed by a second stage of analysis using country-specific data to investigate why. The map is most valuable as a geographic screening tool, not as a causal model.
Latest-available coverage and same-year comparability serve different purposes
The 169-economy latest-available map maximizes geographic coverage. It is useful when the goal is to see the most recent score that the World Bank series provides for each place. Its limitation is that the dates are mixed. The 138-economy 2022 subset does the opposite: it improves time comparability but excludes 31 economies whose latest observations are older. Neither view is universally better; the appropriate choice depends on whether coverage or same-year comparison matters more.
This article deliberately keeps both views rather than filling older or missing observations with estimates. Imputing a 2022 value would make the map visually complete, but it would blur the line between measured and modeled data. The source years are therefore preserved exactly as supplied. For trend analysis, the safer approach would be to retrieve each historical LPI round and examine changes with the survey methodology in mind rather than pretending that the mixed latest-available extract forms a time series.
Sources and method
The indicator is World Bank World Development Indicators series LP.LPI.INFR.XQ. The official indicator page is Logistics performance index: Quality of trade and transport-related infrastructure. The detailed definition and survey description are available in the World Bank DataBank metadata glossary. The broader 2023 report context is described in the World Bank 2023 LPI release.
The calculations here use 169 latest non-empty country or economy observations collected from the World Bank series. The map retains each row’s original observation year, which ranges from 2007 to 2022. The ranking table, quartiles, mean, median and score-band counts use only the 138 rows whose year field equals 2022. No older observation was re-labeled as 2022 and no missing value was replaced with zero. That separation is the central methodological safeguard for interpreting this dataset.
Frequently Asked Questions
What does the LPI infrastructure-quality score measure?
It summarizes logistics professionals’ assessments of trade- and transport-related infrastructure such as ports, railroads, roads and information technology on a 1-to-5 scale. It is perception based rather than a direct physical infrastructure measure.
Can all 169 economies be ranked as if the scores were from 2022?
No. Of the 169 latest available observations, 138 are dated 2022 and 31 are from 2007–2018. Same-year ranking and distribution statistics should therefore use the 138 observations dated 2022.
Why is the observation year 2022 if the report is called LPI 2023?
The World Bank released the cycle as the 2023 LPI, but its metadata says the survey was conducted from September to November 2022. The WDI series stores these observations under 2022.
Related Articles
Green Map creates custom-edited map images using open geographic data sources such as geoBoundaries, Natural Earth, OpenStreetMap, and government open data. These maps are edited visual materials, not raw data files, and are provided for education, documents, presentations, and graphic reference.