Agricultural nitrous oxide (N₂O) emissions varied enormously across economies in 2024. The World Bank indicator EN.GHG.N2O.AG.MT.CE.AR5 reports N₂O from agriculture in million tonnes of carbon-dioxide equivalent (Mt CO₂e). This comparison uses only the 198 countries and economies with an actual 2024 value, so the ranking does not mix observations from different years.
The agriculture category covers N₂O associated with agricultural activities such as fertilizer and managed-soil emissions, manure management, and some agricultural biomass or residue burning. It does not represent every greenhouse-gas emission from agriculture. Agricultural methane, carbon dioxide from energy use, and emissions or removals assigned to land use, land-use change and forestry can appear in separate series. The map should therefore be read as a comparison of agricultural N₂O in absolute terms, not as a complete agricultural climate footprint.
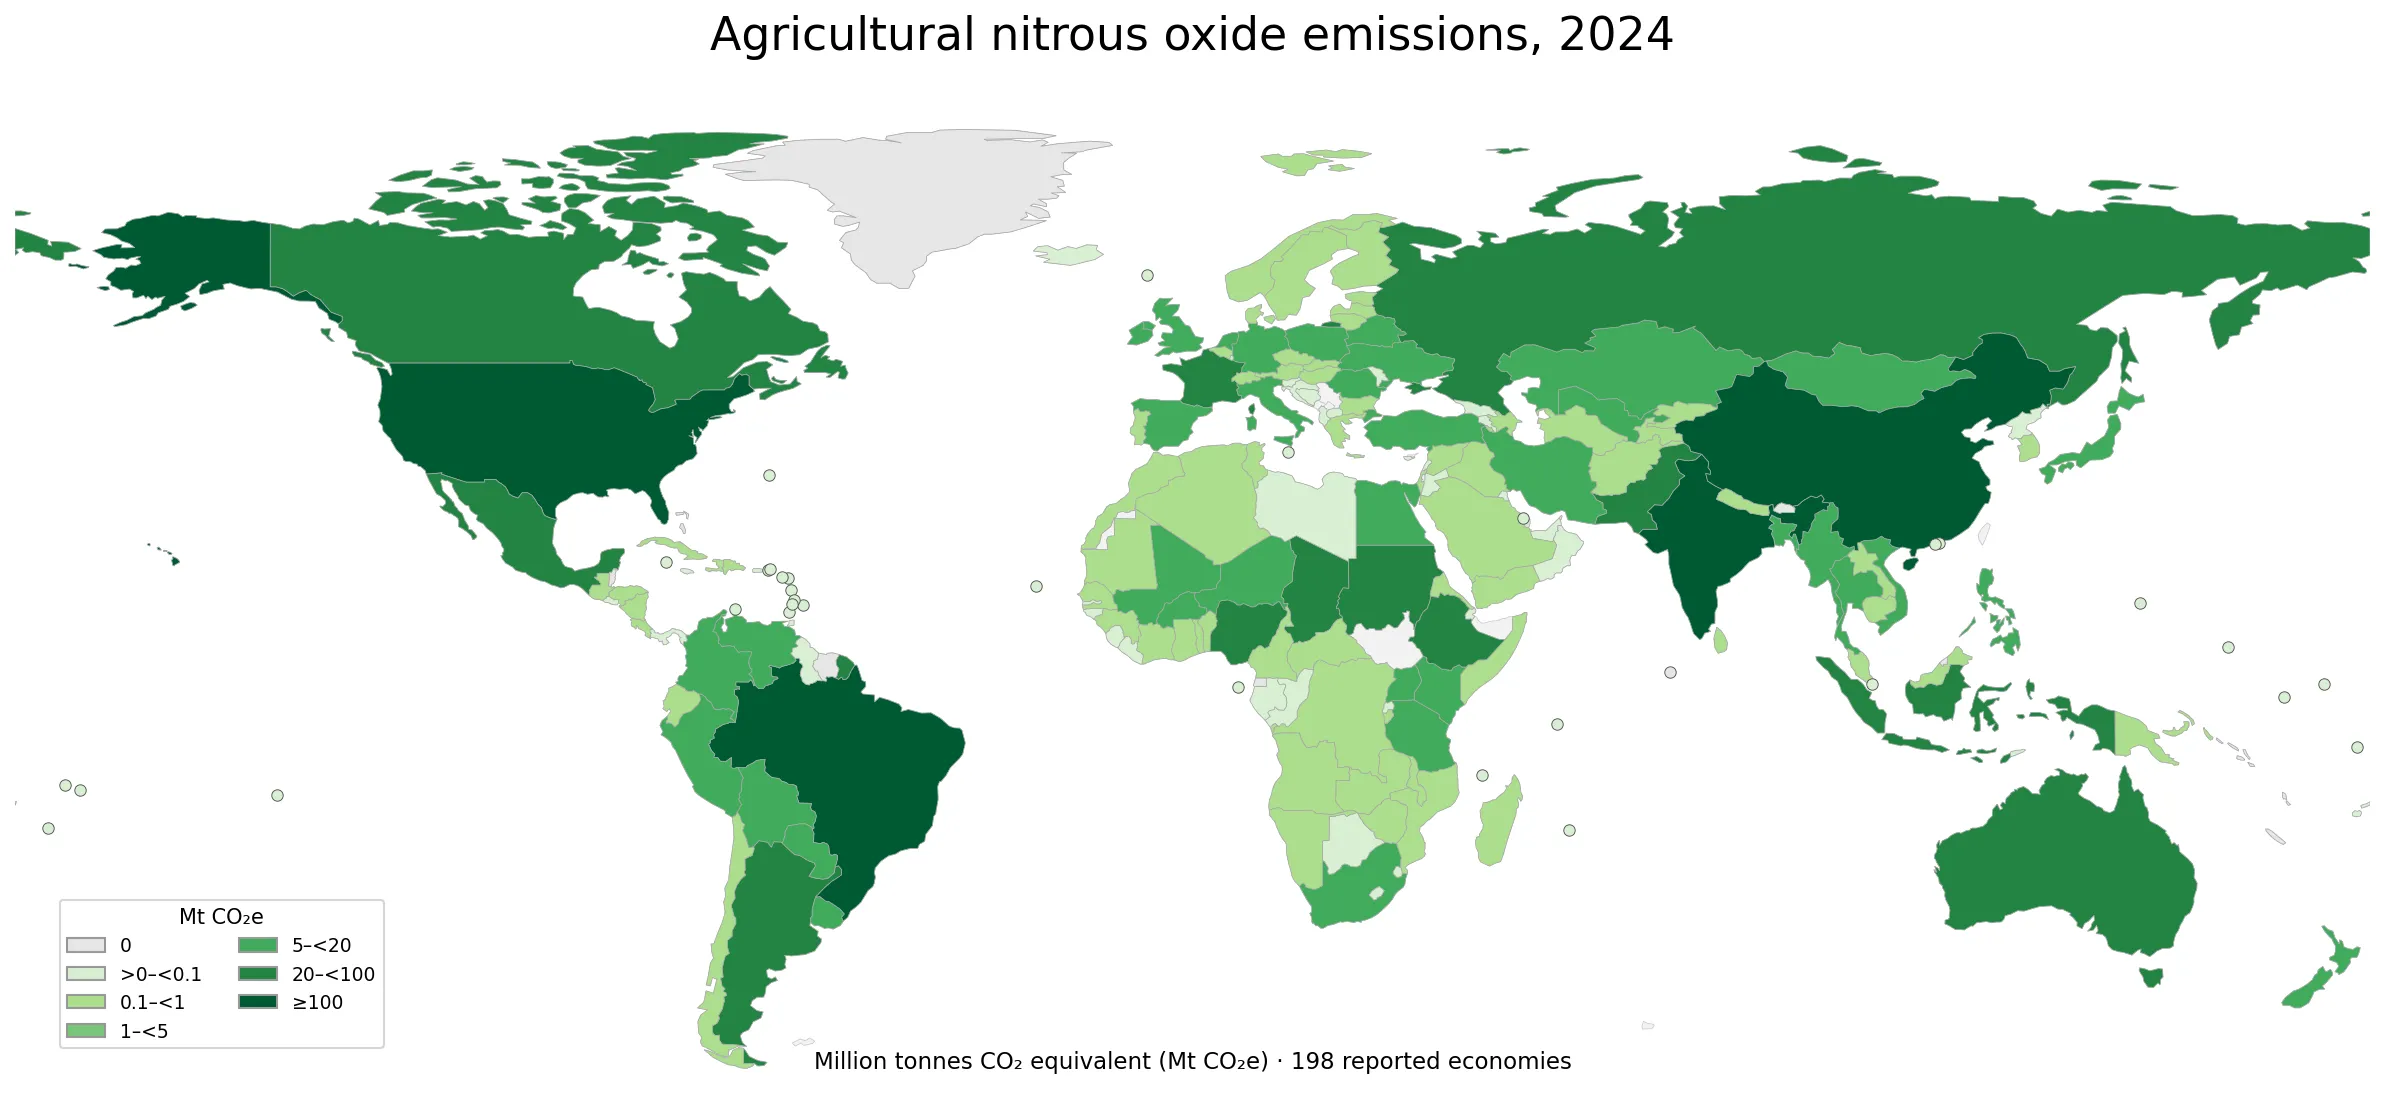
Table of Contents
All 198 reported observations refer to 2024
The World Bank non-aggregate economy universe used for the comparison contains 217 countries and economies. A numeric 2024 value is available for 198 of them, while 19 are source-missing for 2024. The missing group includes Andorra, the Channel Islands, Curaçao, Gibraltar, Liechtenstein, the Marshall Islands, Palau, Serbia, South Sudan and several other separately reported economies. These records remain missing; they are not converted to zero. A blank area therefore means “no 2024 value in the source,” not “no agricultural N₂O emissions.”
A companion World Bank view of the most recent non-empty observation for each economy shows a few older observations. In that file the Marshall Islands, Northern Mariana Islands and Palau have 2023 observations. Those values are useful for a latest-available view, but they are deliberately excluded from the ranking and summary statistics here because substituting them for missing 2024 values would break the same-year design. The count of 198 also should not be treated as a count of sovereign states: the World Bank economy list includes some territories and other separately reported jurisdictions.
China, India, Brazil and the United States account for 42.3% of the reported sum
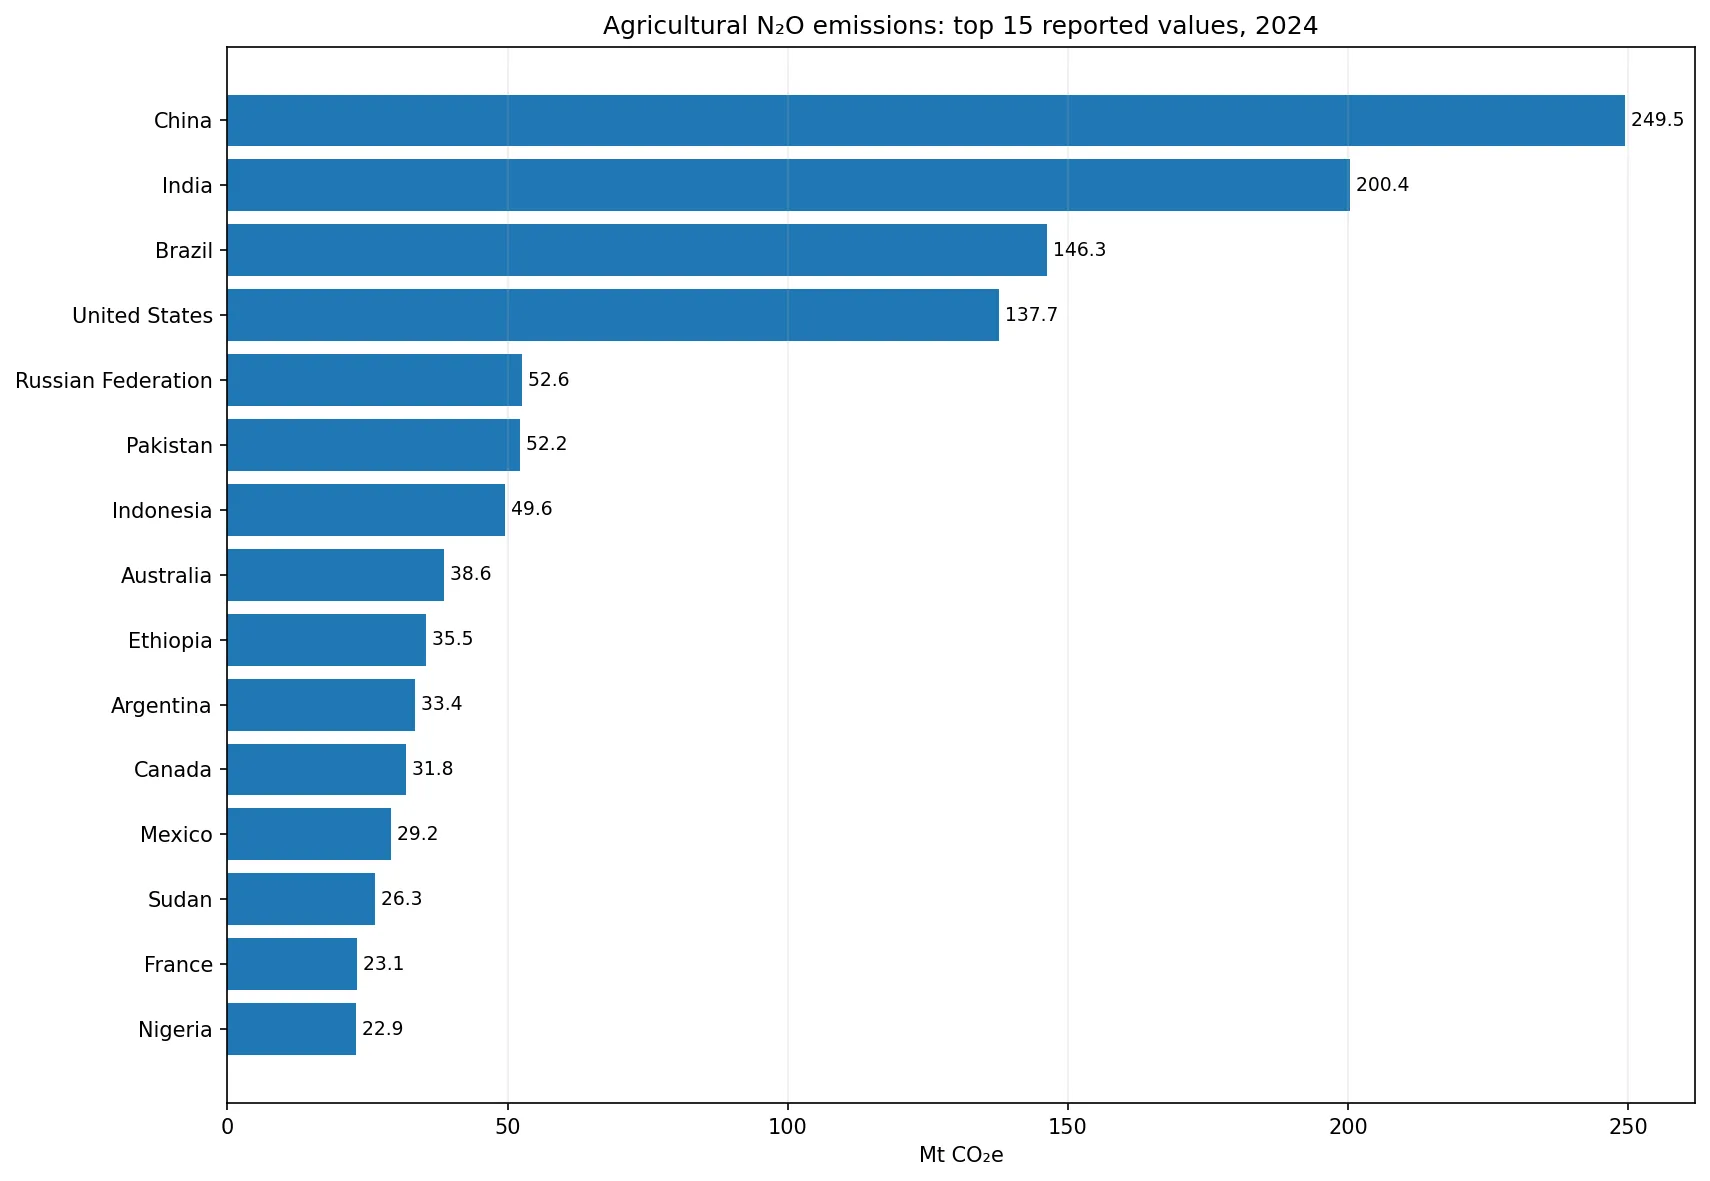
The largest 2024 agricultural N₂O value is China at 249.4922 Mt CO₂e. India follows at 200.3701, Brazil at 146.3134 and the United States at 137.6598 Mt CO₂e. The next values are much lower: the Russian Federation records 52.5747, Pakistan 52.2282 and Indonesia 49.5593 Mt CO₂e. This step down after the four largest values is one reason the global distribution is strongly right-skewed.
Adding the 198 reported values gives 1,733.7090 Mt CO₂e. China and India together represent about 26.0% of that reported sum. The top four account for about 42.3%, the top five for 45.4%, and the top ten for 57.4%. These percentages describe concentration within the observed data only. Because 19 economies are missing, the 1,733.7090 Mt figure is not presented as a complete world total.
| Country or economy | 2024 Mt CO₂e |
|---|---|
| China | 249.4922 |
| India | 200.3701 |
| Brazil | 146.3134 |
| United States | 137.6598 |
| Russian Federation | 52.5747 |
| Pakistan | 52.2282 |
| Indonesia | 49.5593 |
| Australia | 38.6181 |
| Ethiopia | 35.5181 |
| Argentina | 33.3887 |
The median is 1.8312 Mt CO₂e, far below the mean of 8.7561
The median is 1.8312 Mt CO₂e, while the arithmetic mean is 8.7561 Mt CO₂e. The first quartile is 0.1530 and the third quartile is 5.3262 Mt CO₂e. The mean is therefore almost five times the median. That gap is a useful warning: the “typical” economy is much closer to the lower end of the distribution than the average suggests, because a small number of very large agricultural emitters pull the mean upward.
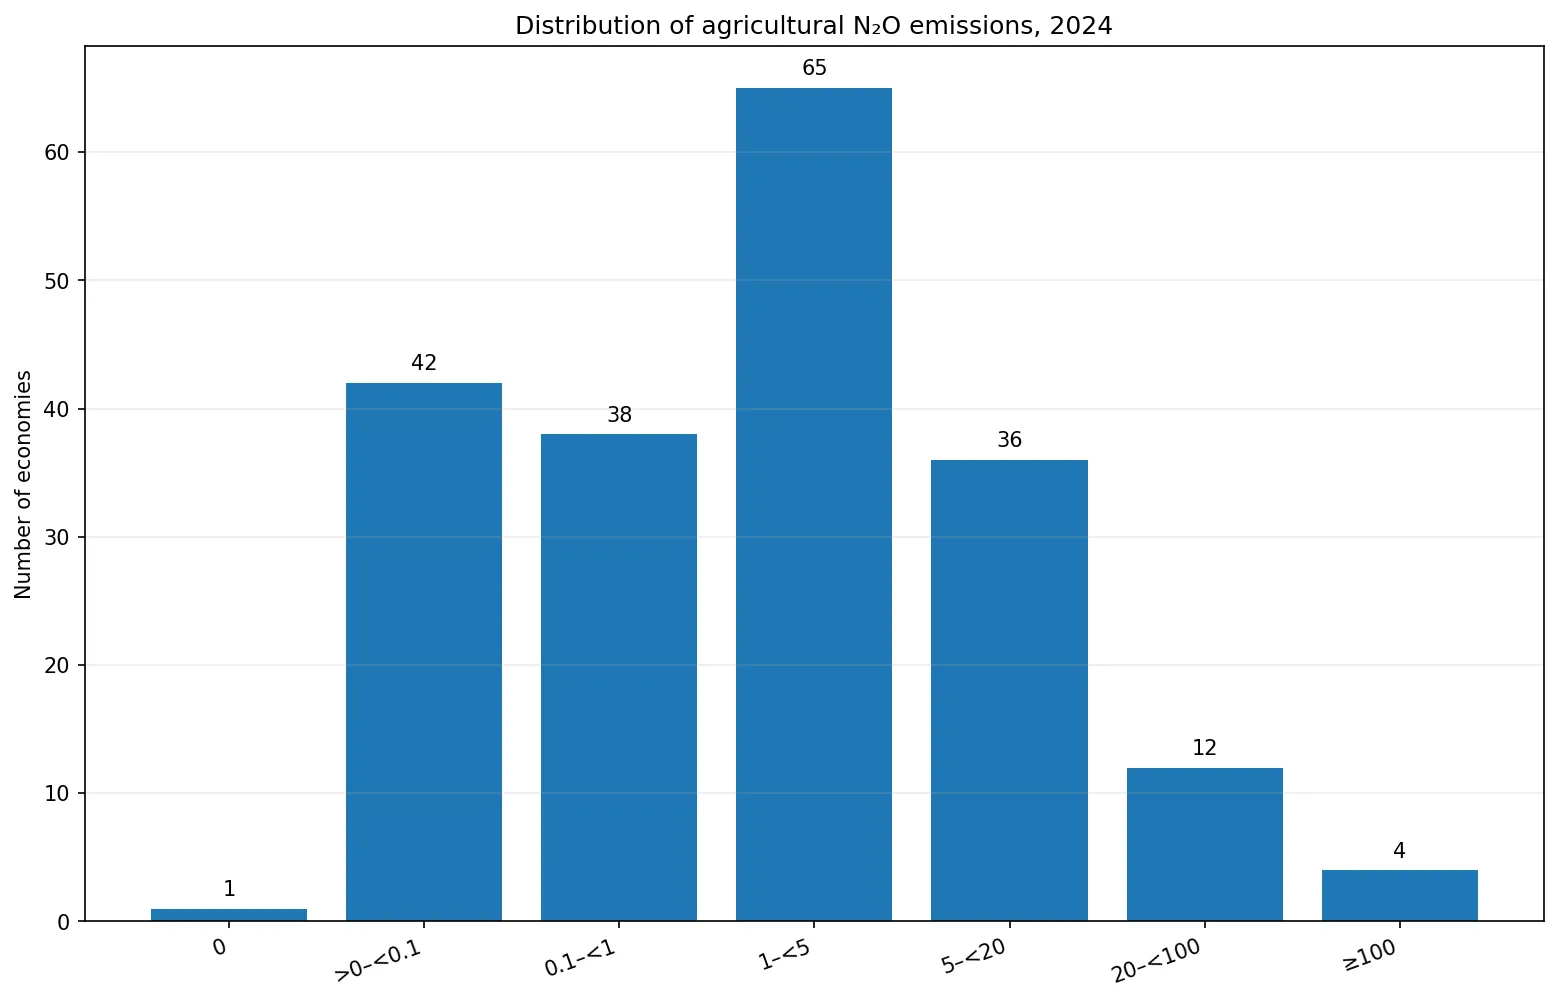
The bin counts reinforce that pattern. There are 43 economies, or 21.7% of the reported set, below 0.1 Mt CO₂e. Another 38 fall between 0.1 and 1, and 65 are between 1 and 5 Mt CO₂e. In total, 117 economies, or 59.1%, report at least 1 Mt CO₂e; 52 report at least 5; and only 16 are at or above 20. Four economies—China, India, Brazil and the United States—exceed 100 Mt CO₂e. The Maldives is the only record displayed as exactly 0.0000 in the 2024 source data, which is distinct from a missing observation.
Fertilizer, managed soils and manure help explain why agricultural N₂O is different from energy emissions
Nitrous oxide is closely connected to the nitrogen cycle. When synthetic fertilizer, manure or other nitrogen inputs are applied to soils, microbial processes can convert part of that nitrogen into N₂O. Emissions can also arise during manure storage and treatment and from certain forms of agricultural biomass or residue burning. For that reason, agricultural N₂O is shaped by a different set of activities than carbon dioxide from fuel combustion or methane from enteric fermentation.
The country total is influenced by the size of agriculture, the amount and type of nitrogen used, livestock numbers and manure systems, crop patterns, soil properties, moisture and climate, and management practices. A large agricultural land area can contribute to a high total, but land area alone is not enough to explain the ranking. Two economies with similar cropland can have different N₂O totals if their fertilizer rates, livestock structure, irrigation, soils or production systems differ. The map identifies where the totals are large; it does not establish the causal contribution of any one factor.
A low absolute total is not the same as high agricultural efficiency
Because the indicator is an absolute quantity, a large value is not automatically evidence that agriculture is inefficient. An economy with a very large crop and livestock sector can have a high total even if emissions per unit of output are comparatively modest. Likewise, a very small total may simply reflect a small agricultural sector, limited fertilizer use or little livestock production. It would be misleading to turn this map into a performance score without a denominator.
For efficiency analysis, agricultural N₂O can be paired with crop output, agricultural value added, hectares of cropland, livestock production, protein output or another activity measure suited to the question. Long-run change is also important. If an economy expands agricultural production while keeping N₂O flat, that tells a different story from a fall in emissions caused by shrinking production. The 2024 cross-section is a useful starting point, but it does not by itself separate scale, technology, management and structural change.
Mt CO₂e is a climate-equivalent unit, not the physical mass of N₂O
Mt CO₂e means million tonnes of carbon-dioxide equivalent. The N₂O is converted into a common climate-impact unit so that its warming effect can be expressed on the same scale as carbon dioxide. The AR5 suffix in the indicator code identifies the IPCC Fifth Assessment Report global-warming-potential framework used for the conversion. A value of 10 Mt CO₂e therefore does not mean that 10 million tonnes of N₂O gas were physically emitted.
The source values are already expressed in CO₂e, so no additional global-warming-potential multiplier should be applied. This matters when combining datasets: an AR5-based series should not be casually joined to an AR6-based series as though the conversion conventions were identical. Recording the full indicator code, unit and GWP basis helps prevent apparent changes that are actually caused by a different accounting convention.
How to read the map without overinterpreting color classes
The reported values range from zero to more than 249 Mt CO₂e, so a simple linear color scale would compress most economies into a narrow visual range. The map instead uses progressively wider classes: zero, above zero to below 0.1, 0.1 to below 1, 1 to below 5, 5 to below 20, 20 to below 100, and 100 or more Mt CO₂e. This makes broad differences visible without pretending that economies inside the same class have identical values.
For exact comparisons, the numeric table or source data should take priority over the map. A country at 1.1 and another at 4.9 Mt CO₂e can share a color even though the second value is more than four times larger. The map is most useful for seeing broad spatial patterns and the location of very large totals. It cannot establish why an economy is high or low, and it should not be used to infer trends because it contains only the 2024 cross-section.
Agricultural N₂O is not the same as total agricultural greenhouse-gas emissions
Agriculture emits several greenhouse gases. N₂O is strongly associated with nitrogen management, while methane is important in livestock digestion, manure and rice cultivation. Carbon dioxide can arise from energy use and from land-use processes accounted for elsewhere. The relative importance of these gases differs by economy. As a result, the ranking for agricultural N₂O does not have to match a ranking for total agricultural greenhouse-gas emissions.
The distinction also matters for mitigation. Measures that improve nitrogen-use efficiency, timing and placement of fertilizer, soil management or manure handling can target N₂O. Methane mitigation may involve different technologies and practices. Looking at source-specific indicators prevents one gas from being used as a proxy for every environmental pressure associated with agriculture.
Source, coverage and interpretation limits
The data come from the World Bank World Development Indicators series EN.GHG.N2O.AG.MT.CE.AR5. The World Bank data page attributes this greenhouse-gas series to the EDGAR Community GHG Database of the European Commission Joint Research Centre and the International Energy Agency, and the public series spans 1970–2024. The agriculture concept covers N₂O associated with agricultural activities such as fertilizer and manure management and agricultural burning.
Every ranking, percentile, concentration share and bin count in this article is calculated from the 198 economies with a numeric 2024 value. The 19 source-missing records are preserved as missing rather than imputed, zero-filled or replaced with another year. For that reason, the sum is explicitly described as the sum of reported values, not as a complete global inventory total. Within those limits, the dataset provides a clean same-year view of how strongly agricultural N₂O emissions are concentrated and how wide the spread is across economies.
Frequently Asked Questions
What does this indicator measure?
It reports nitrous oxide (N₂O) emissions from agriculture in million tonnes of CO₂ equivalent. Agricultural sources include nitrogen and soil management, manure management and certain agricultural burning sources; it is not a measure of all agricultural greenhouse gases.
Are all 198 observations from 2024?
Yes. The comparison uses only economies with an actual 2024 value. Nineteen other economies in the World Bank comparison universe have no 2024 value and remain missing rather than being filled with zero or another year.
Does a high total mean agriculture is inefficient?
No. This is an absolute-emissions indicator and is strongly affected by the scale and structure of agriculture. Efficiency analysis needs a suitable denominator such as output, land area or another activity measure, plus trend information.
Related Articles
Green Map creates custom-edited map images using open geographic data sources such as geoBoundaries, Natural Earth, OpenStreetMap, and government open data. These maps are edited visual materials, not raw data files, and are provided for education, documents, presentations, and graphic reference.