UNESCO UIS indicator OE.5T8.40530.GPIA shows gender parity in the number of outbound internationally mobile tertiary students from each reported origin who study in Central and Eastern Europe. All 198 observations refer to 2023. The measure is an adjusted gender parity index, not an enrollment total: 1 is the equality reference, values below 1 place the female count value on the lower side, and values above 1 place it on the higher side. The 2023 distribution is unusually concentrated, with more than half of all reported origins at the lower bound of the adjusted scale.
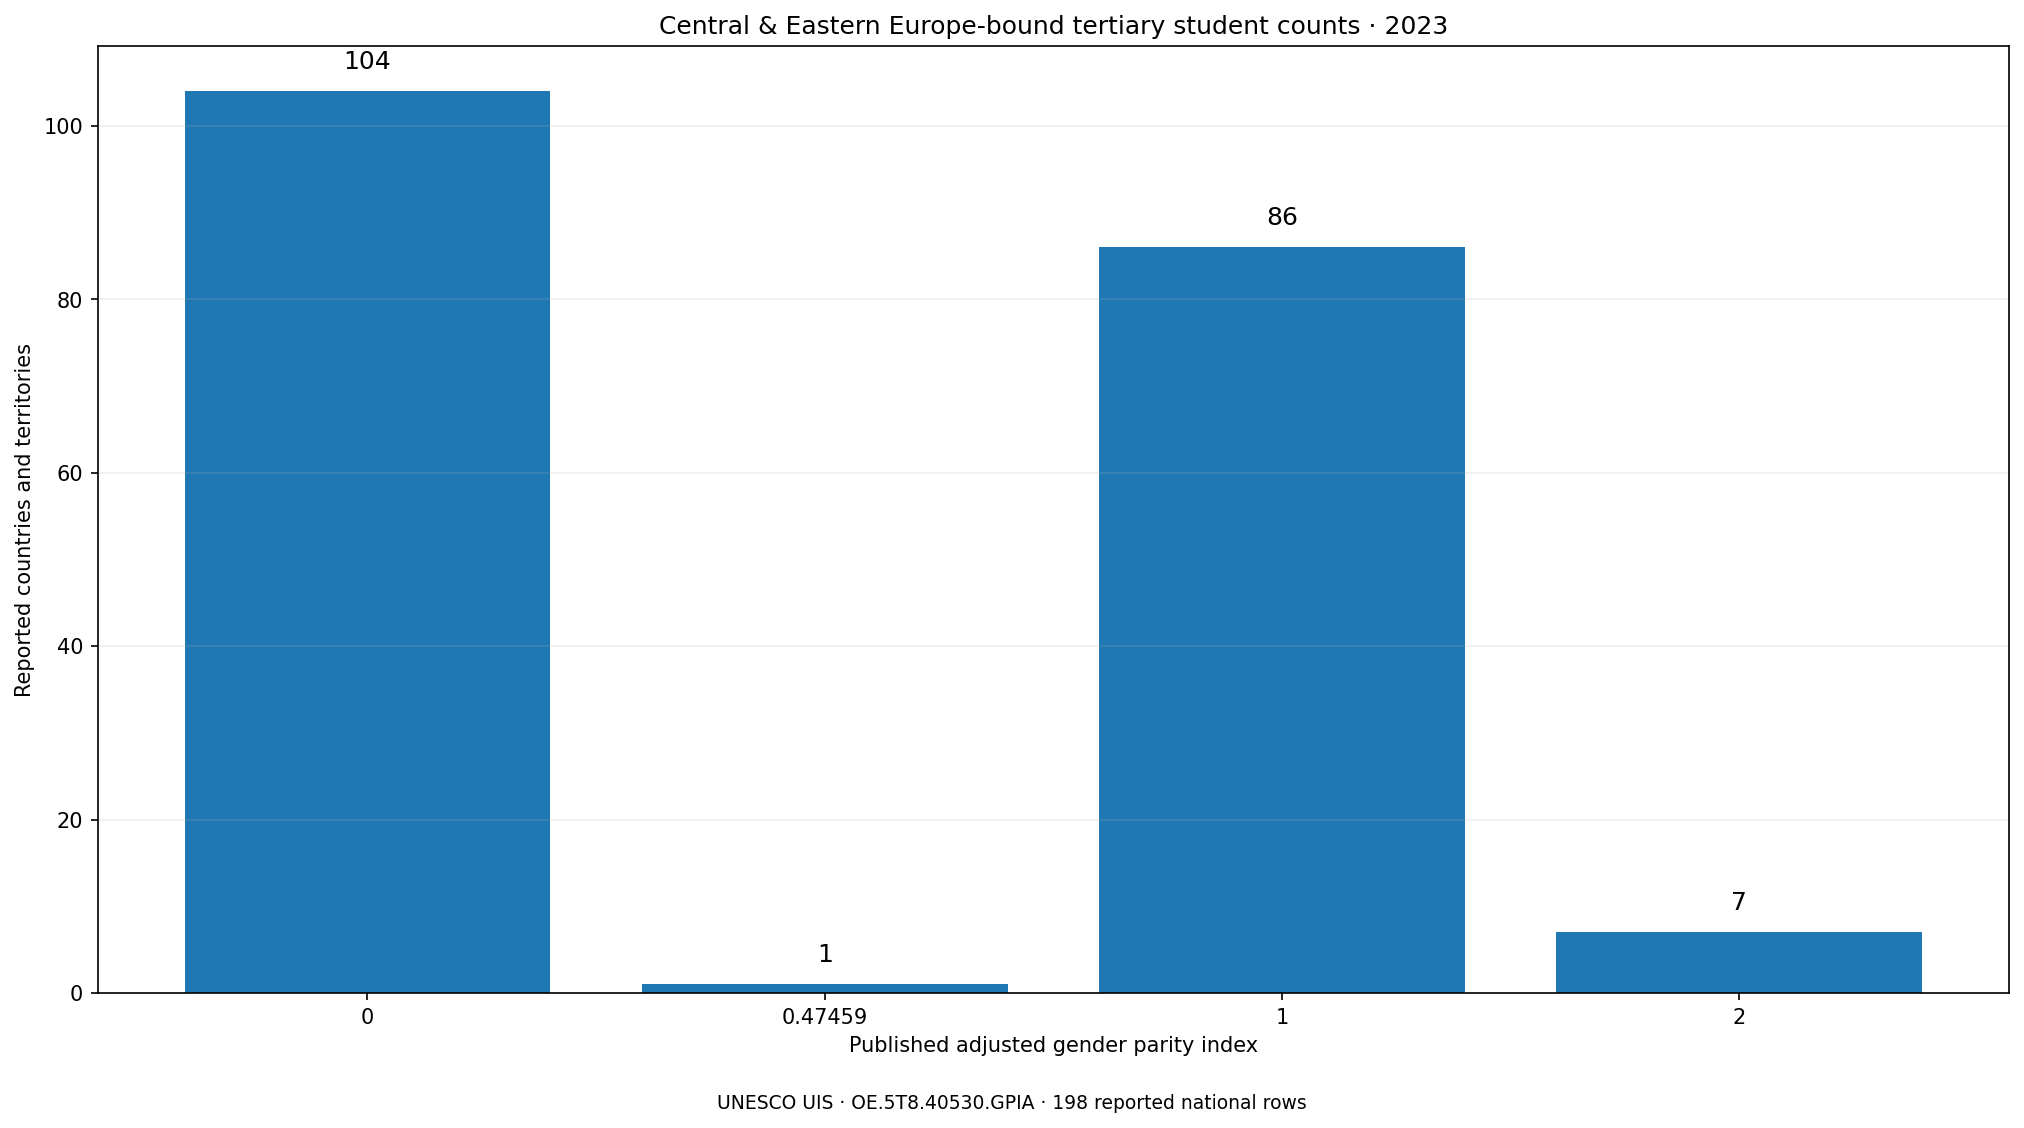
Table of Contents
The median is zero because 104 observations are at the lower bound
Exactly 104 of 198 reported rows, or 52.5%, have a published value of 0. Another 86 rows (43.4%) are exactly 1, and 7 rows (3.5%) are exactly 2. Saudi Arabia is the sole non-boundary intermediate observation at 0.47459. With more than half of the rows at zero, the median is 0.0. The simple mean is 0.507, but the mean is not a very intuitive summary because the data occupy only four published values.
| 2023 GPIA band | Reported origins | Share | Direction |
|---|---|---|---|
| Below 0.97 | 105 | 53.0% | Female count value lower |
| 0.97–1.03 | 86 | 43.4% | Parity band |
| Above 1.03 | 7 | 3.5% | Female count value higher |
Using 0.97–1.03 as the practical parity band, 86 reported origins fall in parity, 105 are below it and seven are above it. Counting rows this way describes how many origin observations lie on each side of the scale. It does not calculate the gender ratio of all students going to Central and Eastern Europe, because every origin contributes one index regardless of whether its student flow is small or large. An enrollment-weighted result would require the underlying female and male counts.
A published zero is not a statement that there are zero students
The adjusted gender parity index is bounded at 0 and 2, with 1 as the central reference. A value of 0 is therefore a boundary of the index. It must not be translated into ‘no students from this country.’ Likewise, 2 is not a statement that the female count is simply twice the male count. The adjusted formula is designed to make disparities on opposite sides of 1 more symmetric, so values above 1 are transformed rather than left as an ordinary female-to-male ratio.
| Published GPIA | Rows | Share of 198 |
|---|---|---|
| 0 | 104 | 52.5% |
| 0.47459 | 1 | 0.5% |
| 1 | 86 | 43.4% |
| 2 | 7 | 3.5% |
The source does not include the separate female and male student counts alongside the GPIA values used here. That prevents reverse-engineering exact headcounts from a value of 0 or 2. Extreme ratios can also arise in small student populations, where a difference of only a few students may have a large effect on parity. For that reason, the boundary-heavy distribution should be treated as a signal about balance, not as a substitute for student volumes.
Saudi Arabia is the only observation between the three dominant values
Of the 198 rows, 197 are exactly 0, 1 or 2. Saudi Arabia at 0.47459 is the sole exception. Its value is below 1, so the female student-count indicator is on the lower side of the male value, but it does not reach the lower boundary. There are no observations between 1 and 2. This makes a conventional fine-grained ranking much less informative than a distribution view: the central fact is clustering at three points, plus one intermediate case.
It is also misleading to call the seven observations at 2 the ‘top’ countries. GPIA is not a score in which higher is automatically better. The reference value is 1. Values at 0 and 2 are opposite boundary positions, and distance from 1 indicates the direction and size of the adjusted imbalance. A parity-oriented reading therefore asks how close a value is to 1, not how high it ranks numerically.
Count parity and mobility-rate parity answer different questions
Several UNESCO student-mobility indicators have almost identical labels, so the code matters. OE.5T8.40530.GPIA compares female and male values for the number of internationally mobile tertiary students studying in Central and Eastern Europe. A mobility-ratio series such as MOR.5T8.40530.GPIA instead compares sex-specific outbound mobility ratios, which use tertiary enrolment in the origin as a denominator. The destination region can be identical while the statistical question is different.
An origin could have similar female and male student counts going to Central and Eastern Europe yet different mobility rates if female and male tertiary enrolment at home differ substantially. The reverse can also happen: comparable mobility rates may coexist with different absolute flows because the two tertiary-enrolment populations are not the same size. Count GPIA is closer to the sex balance within the observed flow, whereas mobility-rate GPIA normalizes that flow by each sex’s tertiary-enrolment base.
Reversing origin and destination creates another distinct series
A second source of confusion is direction. Here each row is an origin country or territory and Central and Eastern Europe is the fixed destination region. A different UNESCO indicator can start with students whose origin is Central and Eastern Europe and then compare their gender balance across destination countries. The regional phrase looks similar in a headline, but the statistical direction is reversed. Mixing the two would turn origins into destinations and answer a different geographic question.
This distinction is especially important when building maps. A map of OE.5T8.40530.GPIA colors origin countries according to the gender balance of their students studying in Central and Eastern Europe. A destination-level series for students originating in Central and Eastern Europe would color host countries instead. The same place name in the indicator title does not make those maps interchangeable.
The reference year is consistent, but reported coverage is not universal
All 198 observations use 2023, so cross-origin comparisons do not mix years. That improves temporal consistency. Still, the UIS catalogue contains units that are not reported in this series. The source metadata list 43 catalogue units without a value in this observation set. Those absences are not zeros. They are kept separate from the 104 rows where UIS explicitly publishes 0.
This distinction matters because zero filling would manufacture lower-bound observations. A country with no reported value cannot be placed at 0 without evidence. Conversely, dropping the explicit zeros would erase the dominant feature of the dataset. The chart and summary statistics therefore use only the 198 reported rows and preserve official zeros exactly as published.
The index does not explain why so many origins are at the boundary
A distribution with 104 lower-bound values is analytically interesting, but the GPIA alone cannot identify the cause. Scholarships, tuition, language networks, fields of study, institutional partnerships, household resources, visa arrangements, distance, migration links and destination preferences may affect student mobility, but none of those explanatory variables is contained in this indicator. Interpreting individual boundary cases responsibly requires the underlying sex-specific counts and, for causal claims, additional evidence.
Nor does parity reveal the size of the flow. An origin with a GPIA of 1 may send many students or very few. If the research question is which origins send the most students to Central and Eastern Europe, the appropriate measure is the underlying student-count series, not the adjusted parity index. GPIA answers a narrower but useful question: how balanced are the female and male values within each reported origin’s flow to this destination region?
Four checks keep the interpretation aligned with the data
- Treat Central and Eastern Europe as the fixed destination and each row as an origin.
- Keep OE.5T8.40530.GPIA separate from mobility-rate GPIA series that use tertiary enrolment as a denominator.
- Read 0 and 2 as adjusted-index boundaries, not as student totals or simple multiples.
- Leave unreported catalogue units missing and calculate only from the 198 published observations.
The numerical source is the UNESCO Institute for Statistics OE.5T8.40530.GPIA API series. Because every published row here is dated 2023, the main analytical safeguards are preserving the indicator identity, the origin-to-destination direction, and the difference between official zeros and unreported geographies.
Frequently Asked Questions
Does GPIA 0 mean no students went to Central and Eastern Europe?
No. Zero is the lower bound of the adjusted gender parity index. Separate female and male student counts are needed to determine actual volumes.
Why is a GPIA of 1 important?
One is the equality reference where the female and male indicator values are equal. In the 2023 data, 86 of 198 observations are exactly 1.
Is OE.5T8.40530.GPIA the same as a mobility-rate GPIA?
No. OE compares student-count values by sex, while mobility-rate indicators compare sex-specific rates that use tertiary enrolment in the origin as a denominator.
Related Articles
Green Map creates custom-edited map images using open geographic data sources such as geoBoundaries, Natural Earth, OpenStreetMap, and government open data. These maps are edited visual materials, not raw data files, and are provided for education, documents, presentations, and graphic reference.