U.S. Energy Information Administration data for 2024 measure the heat content of petroleum liquids consumed for electricity generation in the non-CHP Electric Power sector across all 50 states. Summing the reported state values gives 108.32707 million MMBtu. This is the consumption-for-eg-btu series, so the numbers represent fuel energy input rather than physical barrels, total petroleum consumption or electricity generated.
The distribution is highly concentrated. Hawaii reports 60.05122 million MMBtu, equal to 55.44% of the 50-state sum. Alaska contributes another 7.58%, bringing the top-two share to 63.02%. The median state is only 0.56594 million MMBtu, compared with a mean of 2.16654. The large mean-median gap shows how strongly the upper tail shapes the national state-level distribution.
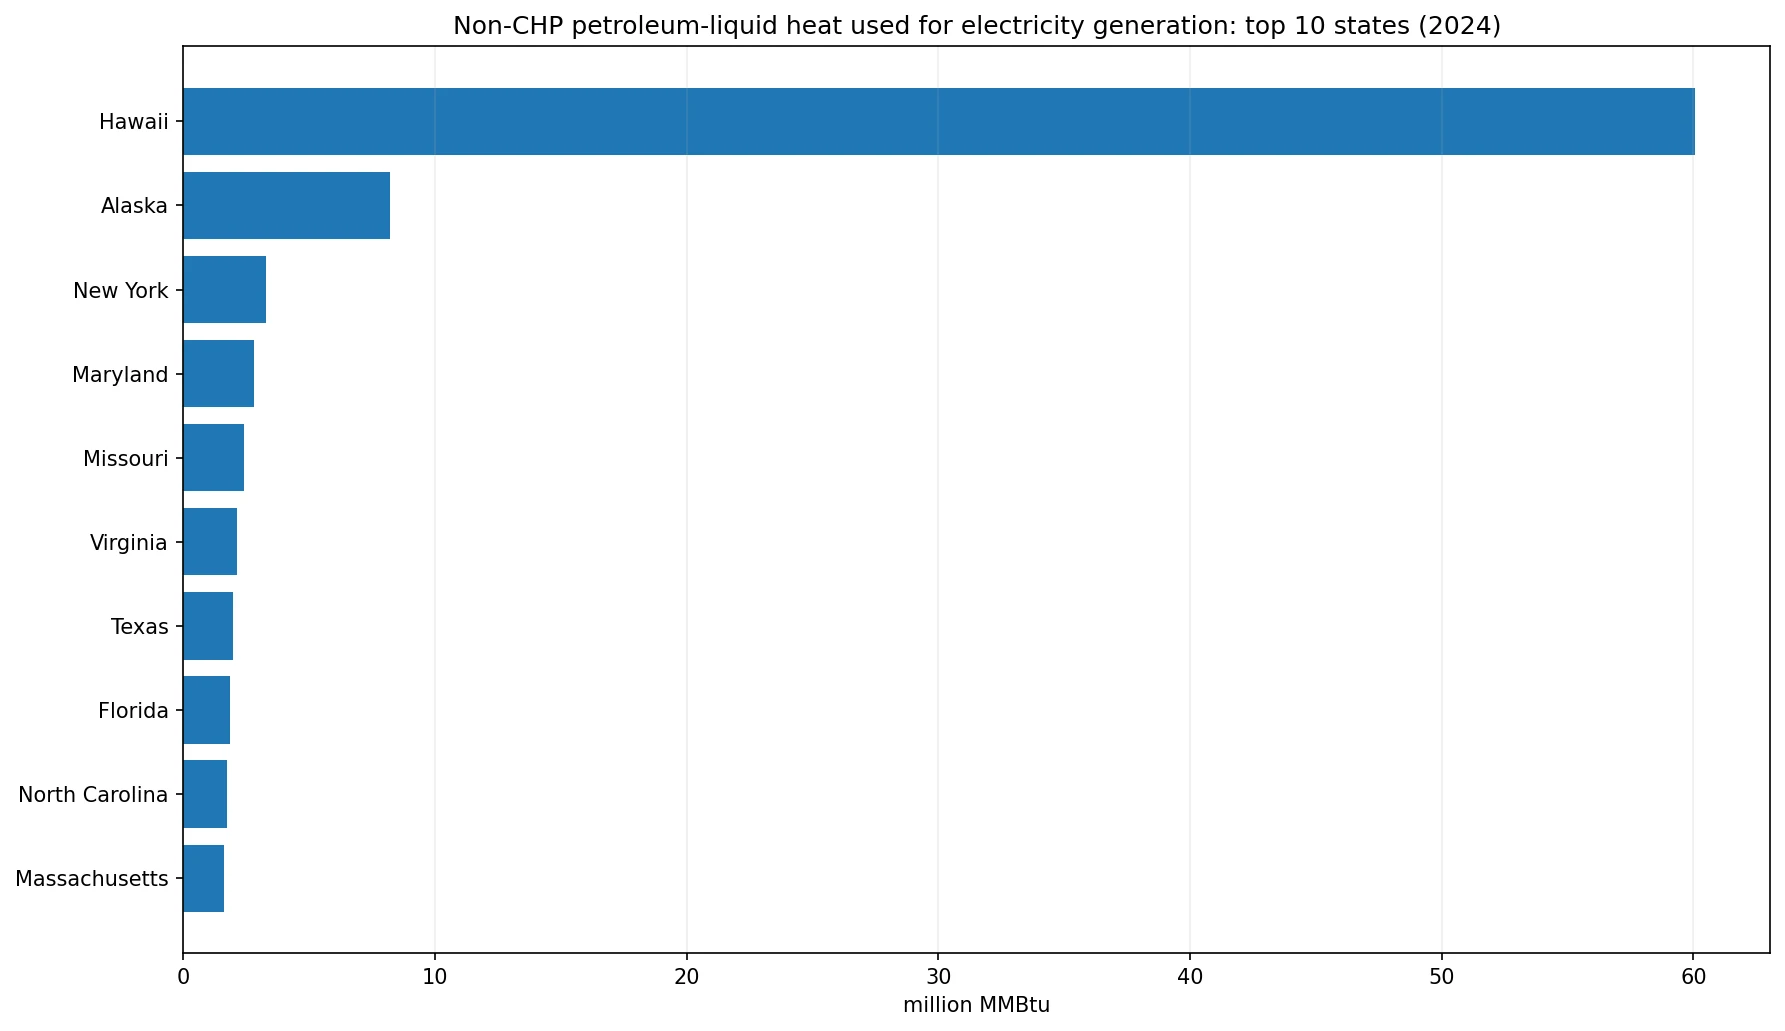
Table of Contents
This measure is fuel heat content, not physical volume
A barrel is a unit of volume, while MMBtu is a unit of energy. The two are related, but they are not interchangeable. Petroleum liquids include products with different average heat content per barrel, so two states using the same physical volume can record different heat input. The Btu-based series is therefore closer to the amount of fuel energy delivered to generation equipment.
Heat input is still not electricity output. Generating units convert fuel energy into electricity with different efficiencies, so equal heat input can produce different amounts of net generation. To study efficiency, the heat-input series must be paired with electricity generation. This article stays with the state distribution of petroleum-liquid energy consumed for generation.
The scope is the non-CHP Electric Power sector
The source uses sectorid 90, Electric Power Sector Non-CHP. It covers generating facilities in the electric power sector that are not combined heat and power plants. CHP facilities produce electricity and useful thermal output together and are outside this sector slice. That distinction can matter in states where CHP accounts for a meaningful share of fuel use.
A total Electric Power series and a non-CHP series should therefore not be assumed to match. The same is true for total consumption and generation-only consumption. The identity of the measure depends on the sector, fuel facet, field and unit. Here those dimensions are fixed at non-CHP, petroleum liquids, consumption for electricity generation and million MMBtu.
Hawaii alone represents 55.44% of the observed heat input
Hawaii has the largest 2024 value at 60.05122 million MMBtu, accounting for 55.44% of the 50-state total. Alaska is second at 8.21263 million MMBtu, or 7.58%. Together the two states account for 63.02% of the heat content of petroleum liquids consumed for generation in this non-CHP sector.
The data establish the concentration but do not identify its cause. Grid isolation, generating technology, fuel logistics and the availability of other resources may matter, but those explanations require separate evidence. The direct finding is narrower: Hawaii and Alaska use much more petroleum-liquid energy for non-CHP electricity generation than the typical state.
There is a steep drop after the top two states
New York ranks third at 3.30020 million MMBtu, followed by Maryland at 2.80820, Missouri at 2.39333 and Virginia at 2.13218. Texas records 1.99208, Florida 1.84300, North Carolina 1.75284 and Massachusetts 1.62621. The third-ranked value is already below 4 million MMBtu, showing how far Hawaii and Alaska sit above the rest.
The top five states account for 70.86% of the 50-state sum, while the top ten account for 79.49%. One fifth of the states therefore represents nearly four fifths of the observed energy input. Concentration statistics convey the structure more clearly than an exact ranking of all 50 states.
| State | Year | million MMBtu | Share of 50-state sum |
|---|---|---|---|
| Hawaii | 2024 | 60.05122 | 55.44% |
| Alaska | 2024 | 8.21263 | 7.58% |
| New York | 2024 | 3.30020 | 3.05% |
| Maryland | 2024 | 2.80820 | 2.59% |
| Missouri | 2024 | 2.39333 | 2.21% |
| Virginia | 2024 | 2.13218 | 1.97% |
| Texas | 2024 | 1.99208 | 1.84% |
| Florida | 2024 | 1.84300 | 1.70% |
| North Carolina | 2024 | 1.75284 | 1.62% |
| Massachusetts | 2024 | 1.62621 | 1.50% |
Most states sit far below the upper tail
The median is 0.56594 million MMBtu. The first quartile is 0.29439 and the third quartile 1.36864, so half of the states lie inside that interval. 21 states are below 0.5 million MMBtu, while 19 are at or above 1 million MMBtu. The central distribution is therefore much more compact than the extreme values suggest.
Idaho has the smallest reported value at 0.00049 million MMBtu, followed by New Mexico at 0.01135, Mississippi at 0.05589, Rhode Island at 0.05803, Vermont at 0.06735 and Nevada at 0.07323. These values indicate very little petroleum-liquid heat input for non-CHP electricity generation. They do not indicate low total electricity generation or low total energy consumption.
| State | Year | million MMBtu | Share of 50-state sum |
|---|---|---|---|
| Idaho | 2024 | 0.00049 | 0.00% |
| New Mexico | 2024 | 0.01135 | 0.01% |
| Mississippi | 2024 | 0.05589 | 0.05% |
| Rhode Island | 2024 | 0.05803 | 0.05% |
| Vermont | 2024 | 0.06735 | 0.06% |
| Nevada | 2024 | 0.07323 | 0.07% |
| Louisiana | 2024 | 0.10674 | 0.10% |
| Alabama | 2024 | 0.11143 | 0.10% |
The mean of 2.17 million MMBtu is not a typical-state value
The arithmetic mean is 2.16654 million MMBtu, almost four times the median of 0.56594. Hawaii alone is more than twenty-seven times the mean. In a distribution this skewed, the mean is valid mathematically but not especially representative of what most states look like.
A better summary combines a median near 0.566 million MMBtu with Hawaii’s 55.4% share, the top two’s 63.0% and the top ten’s 79.5%. Those statistics show both the normal scale for the middle of the distribution and the degree to which the total is dominated by a small number of states.
Heat content and barrel volume answer related but different questions
Physical-volume data show how many barrels were consumed. Heat-content data show how much energy those petroleum liquids contained. Differences in product mix can make the state shares in the two measures slightly different. A state using heavier or higher-heat-content products can have more Btu per barrel than a state using a different mix.
The heat-to-volume relationship should not be mistaken for generating efficiency. Efficiency concerns how much electricity is produced from a given amount of fuel energy. That requires net generation or another electricity-output measure. Heat content and volume together describe the fuel itself; heat input and electricity output describe conversion performance.
A high heat-input value is not the same as petroleum dependence
A state can use a large absolute amount of petroleum-liquid energy and still obtain only a small share of its electricity from petroleum if its total power system is very large. Conversely, a smaller system can be relatively petroleum-dependent with a much lower absolute heat input. Absolute energy input and fuel share answer separate questions.
Petroleum dependence would require a denominator such as total state generation, total non-CHP heat input or total energy input across fuels. This series does not provide that denominator by itself, so no dependence ratio is inferred here.
The 50-state sum is 108.32707 million MMBtu
Adding the 50 state observations gives 108.32707 million MMBtu. This is a calculated sum for the exact state universe in the data: petroleum liquids, non-CHP Electric Power, consumption for electricity generation and 2024. It should not be presented as a broader national total that includes other jurisdictions or CHP activity.
Using this state sum as the denominator allows consistent concentration shares. Hawaii contributes 55.44%, Alaska 7.58%, and most other states contribute low single-digit percentages or less. These shares describe where the observed petroleum-liquid heat input is located, not petroleum’s share of each state’s electricity supply.
The clearest finding from the 2024 state distribution
The dominant feature is concentration. Hawaii accounts for 55.4%, Hawaii plus Alaska for 63.0%, and the top ten states for 79.5% of the 50-state sum. At the same time, the median is only 0.566 million MMBtu. Petroleum-liquid energy used for non-CHP electricity generation was therefore distributed very unevenly across states.
Four distinctions keep the interpretation precise: the unit is million MMBtu rather than barrels; the sector is non-CHP Electric Power rather than the entire power sector; the field measures fuel energy consumed for generation rather than electricity output; and absolute heat input is different from petroleum dependence. Those boundaries separate this series from several nearby EIA measures.
Source and interpretation limits
The source is the U.S. Energy Information Administration Electricity API v2, electric-power-operational-data, for annual 2024 observations. The fuel facet is petroleum liquids (PEL), the sector is Electric Power Sector Non-CHP (sectorid 90), the field is consumption-for-eg-btu and the unit is million MMBtu. All 50 states have a reported observation.
A useful follow-up would combine this series with physical petroleum-liquid consumption, net generation and total heat input by fuel. That would separate fuel volume, fuel energy, electricity output and fuel dependence and provide a fuller picture of why a small number of states dominate the observed heat-input distribution.
Frequently Asked Questions
Does this series measure barrels of petroleum liquids?
No. It is EIA's consumption-for-eg-btu series, measuring the heat content of petroleum liquids used for electricity generation in million MMBtu.
What does Non-CHP mean?
It refers to Electric Power facilities that are not combined heat and power plants producing electricity and useful thermal output together.
Does a high heat-input value mean high petroleum dependence?
Not necessarily. Dependence requires comparison with total generation or total fuel heat input.
Related Articles
Green Map creates custom-edited map images using open geographic data sources such as geoBoundaries, Natural Earth, OpenStreetMap, and government open data. These maps are edited visual materials, not raw data files, and are provided for education, documents, presentations, and graphic reference.