Red Lake County in northwestern Minnesota stretches from Red Lake Falls in the west toward Oklee in the east, with Plummer and Brooks between them. The maps on this page make that long east–west shape easy to follow while also showing how roads, rivers, and elevation change from one side of the county to the other.
You can use the page to compare the county boundary and principal roads, the four mapped communities, the main waterways and tributaries, and the broad elevation pattern. The same four maps are also available as high-resolution JPG files in a downloadable ZIP, which is useful when you need a larger image for print, lessons, reports, or presentation slides.
Table of Contents
Roads place Red Lake Falls, Plummer, Brooks, and Oklee in a clear county-wide frame
On the county map, Red Lake Falls sits in the western part of the county, Plummer lies farther northeast, Brooks is south of the center, and Oklee is near the eastern side. The boundary is not a simple rectangle, so the four places do not line up along one latitude. Following the road network from west to east gives a more useful sense of how the communities relate to one another.
Several numbered roads stand out, including routes marked 3, 11, 92, 12, 59, and 222. Around Red Lake Falls, roads pass close to the river system; near Plummer, east–west and north–south routes come together; and the eastern half shows many straighter rural roads around Oklee. These lines are useful for orientation, but the map is not intended to replace current navigation or road-condition information.
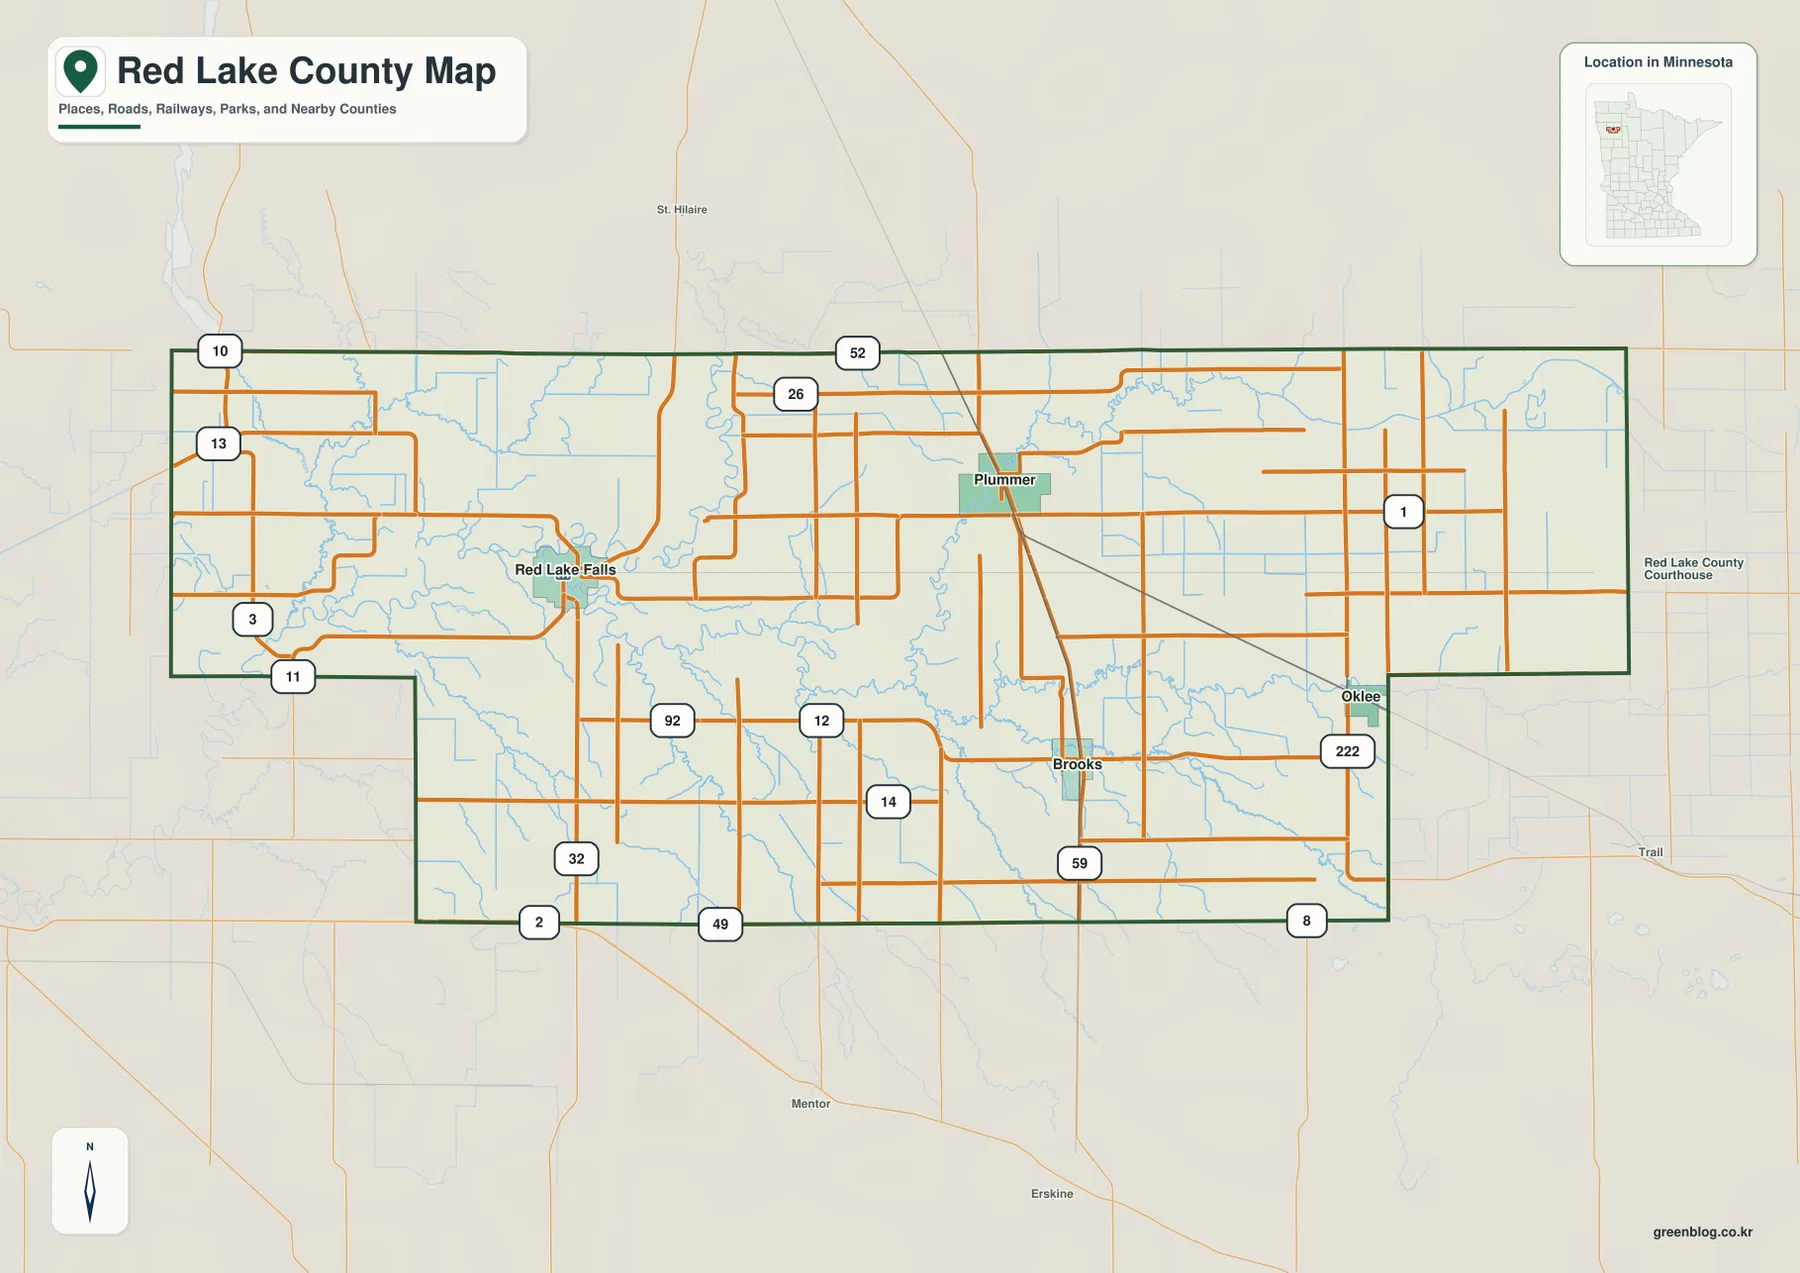
The western side has more visibly curving river lines mixed with the road network, while much of the eastern rural area is organized by straighter roads. That contrast makes the map helpful when explaining why Red Lake Falls feels closely tied to the rivers and why Oklee appears in a more open inland setting. It is best used as an overview rather than as a legal boundary or navigation document.
A simplified community map separates the western center from smaller eastern and central places
The community layer removes much of the background detail and keeps Red Lake Falls, Oklee, Plummer, and Brooks in focus. The displayed index values are 1,348 for Red Lake Falls, 383 for Oklee, 369 for Plummer, and 133 for Brooks, with ranks shown alongside them. Those numbers should be treated as the comparison values used by this map, not as a claim that they are the latest official population totals.
Red Lake Falls has the largest value and is clearly the leading western place on the layer. Oklee and Plummer have similar middle-range values even though they occupy very different parts of the county: Plummer is north of center, while Oklee is much farther east. Brooks, south of the center, carries the smallest displayed value.
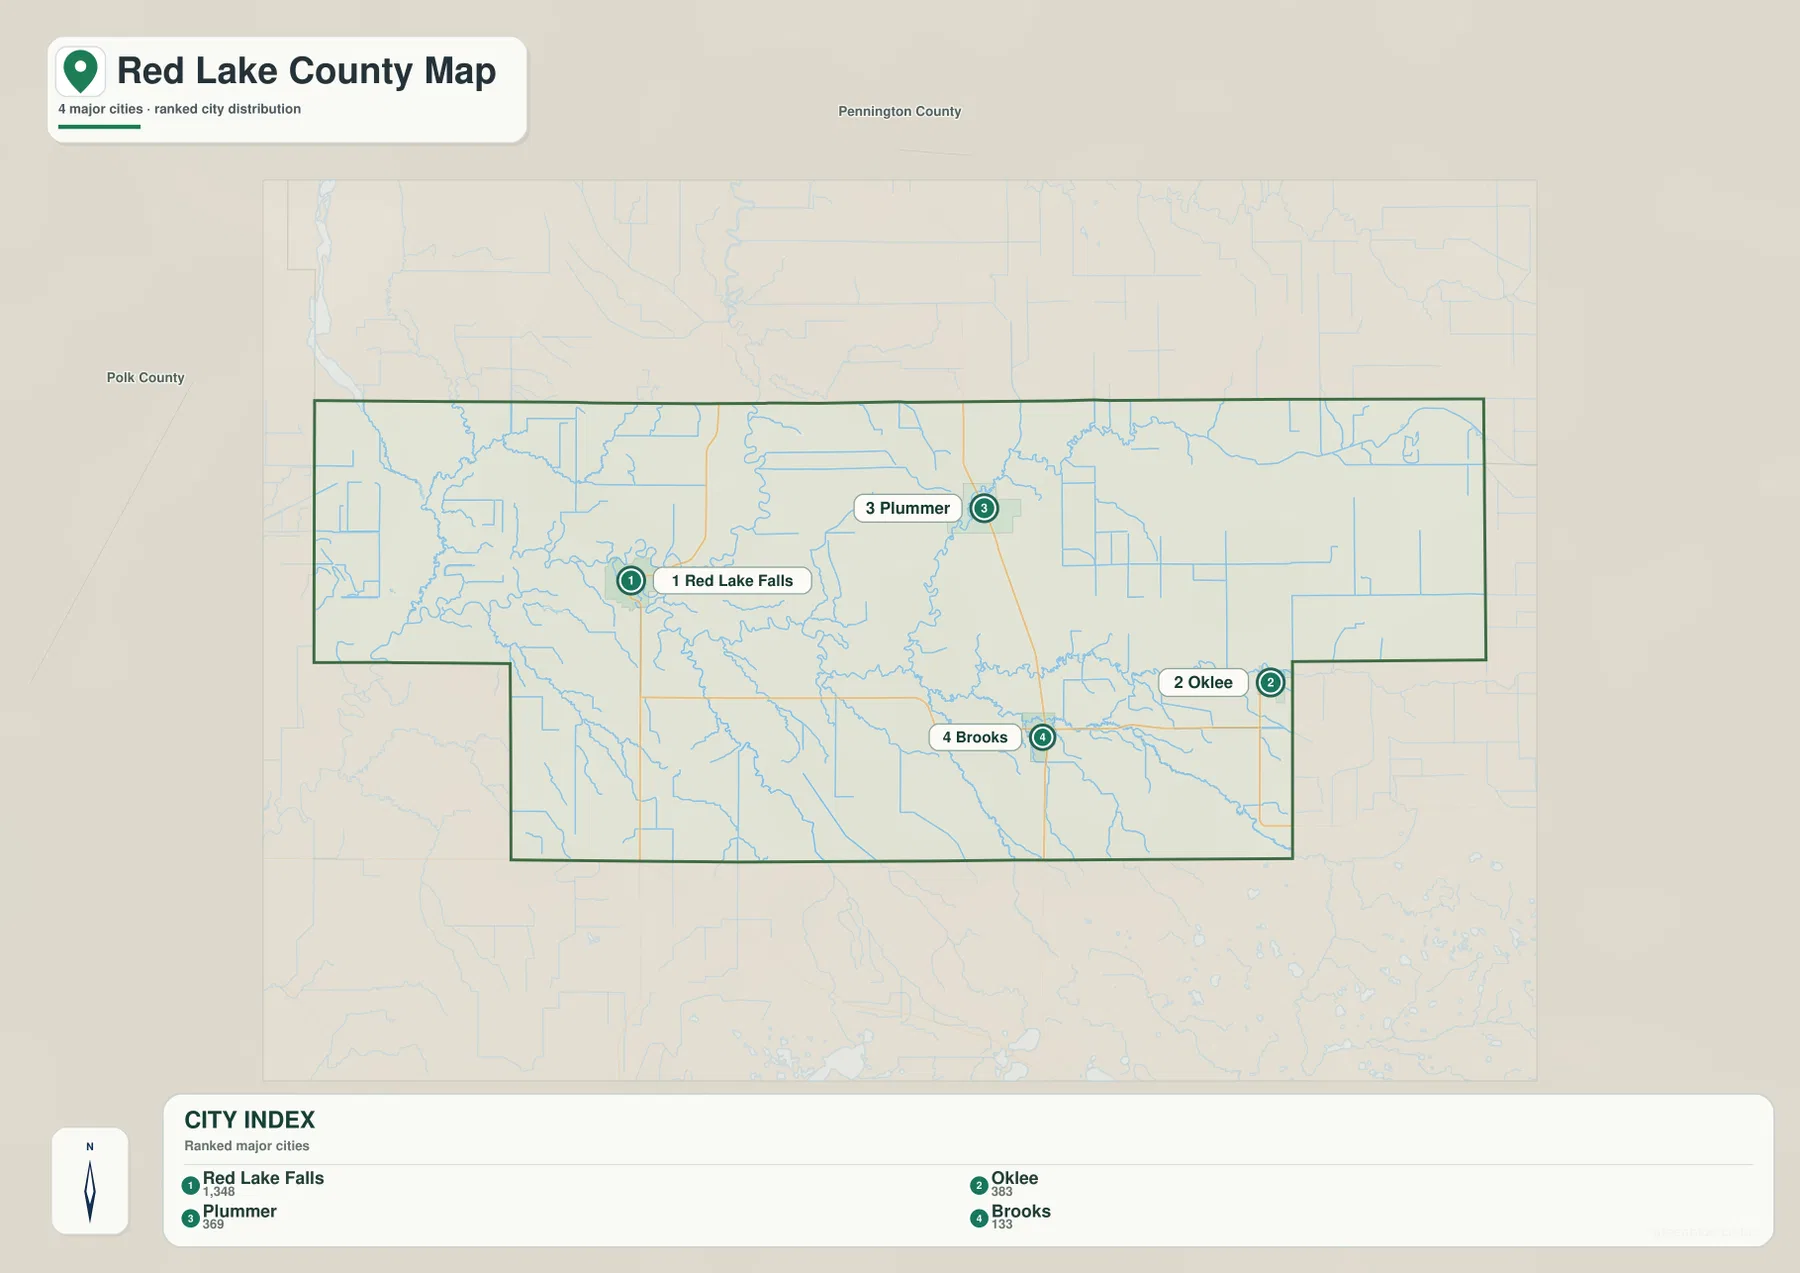
This stripped-down view works well when a presentation or lesson needs to show only where the four communities are and how their displayed values differ. It intentionally leaves out much of the road and water detail. For travel routes, nearby rivers, or terrain differences, the other maps add context that the community layer does not try to provide.
Two major rivers give Red Lake Falls its strongest geographic reference point
The water map is dominated in the west by the Red Lake River and the Clearwater River. The Red Lake River comes down from the north while the Clearwater River approaches from the east, and they meet close to Red Lake Falls before continuing westward. That meeting of the rivers is one of the clearest landmarks for understanding the location of the county seat area.
Other named waterways add detail across the county. Black River and Browns Creek appear toward the west and northwest, smaller creeks run through central and southern areas, and Lost River and Hill River are prominent in the east. Numbered county ditches also appear in places. Those ditch lines help show drainage features on the map, but they do not indicate current drainage performance or flood risk.
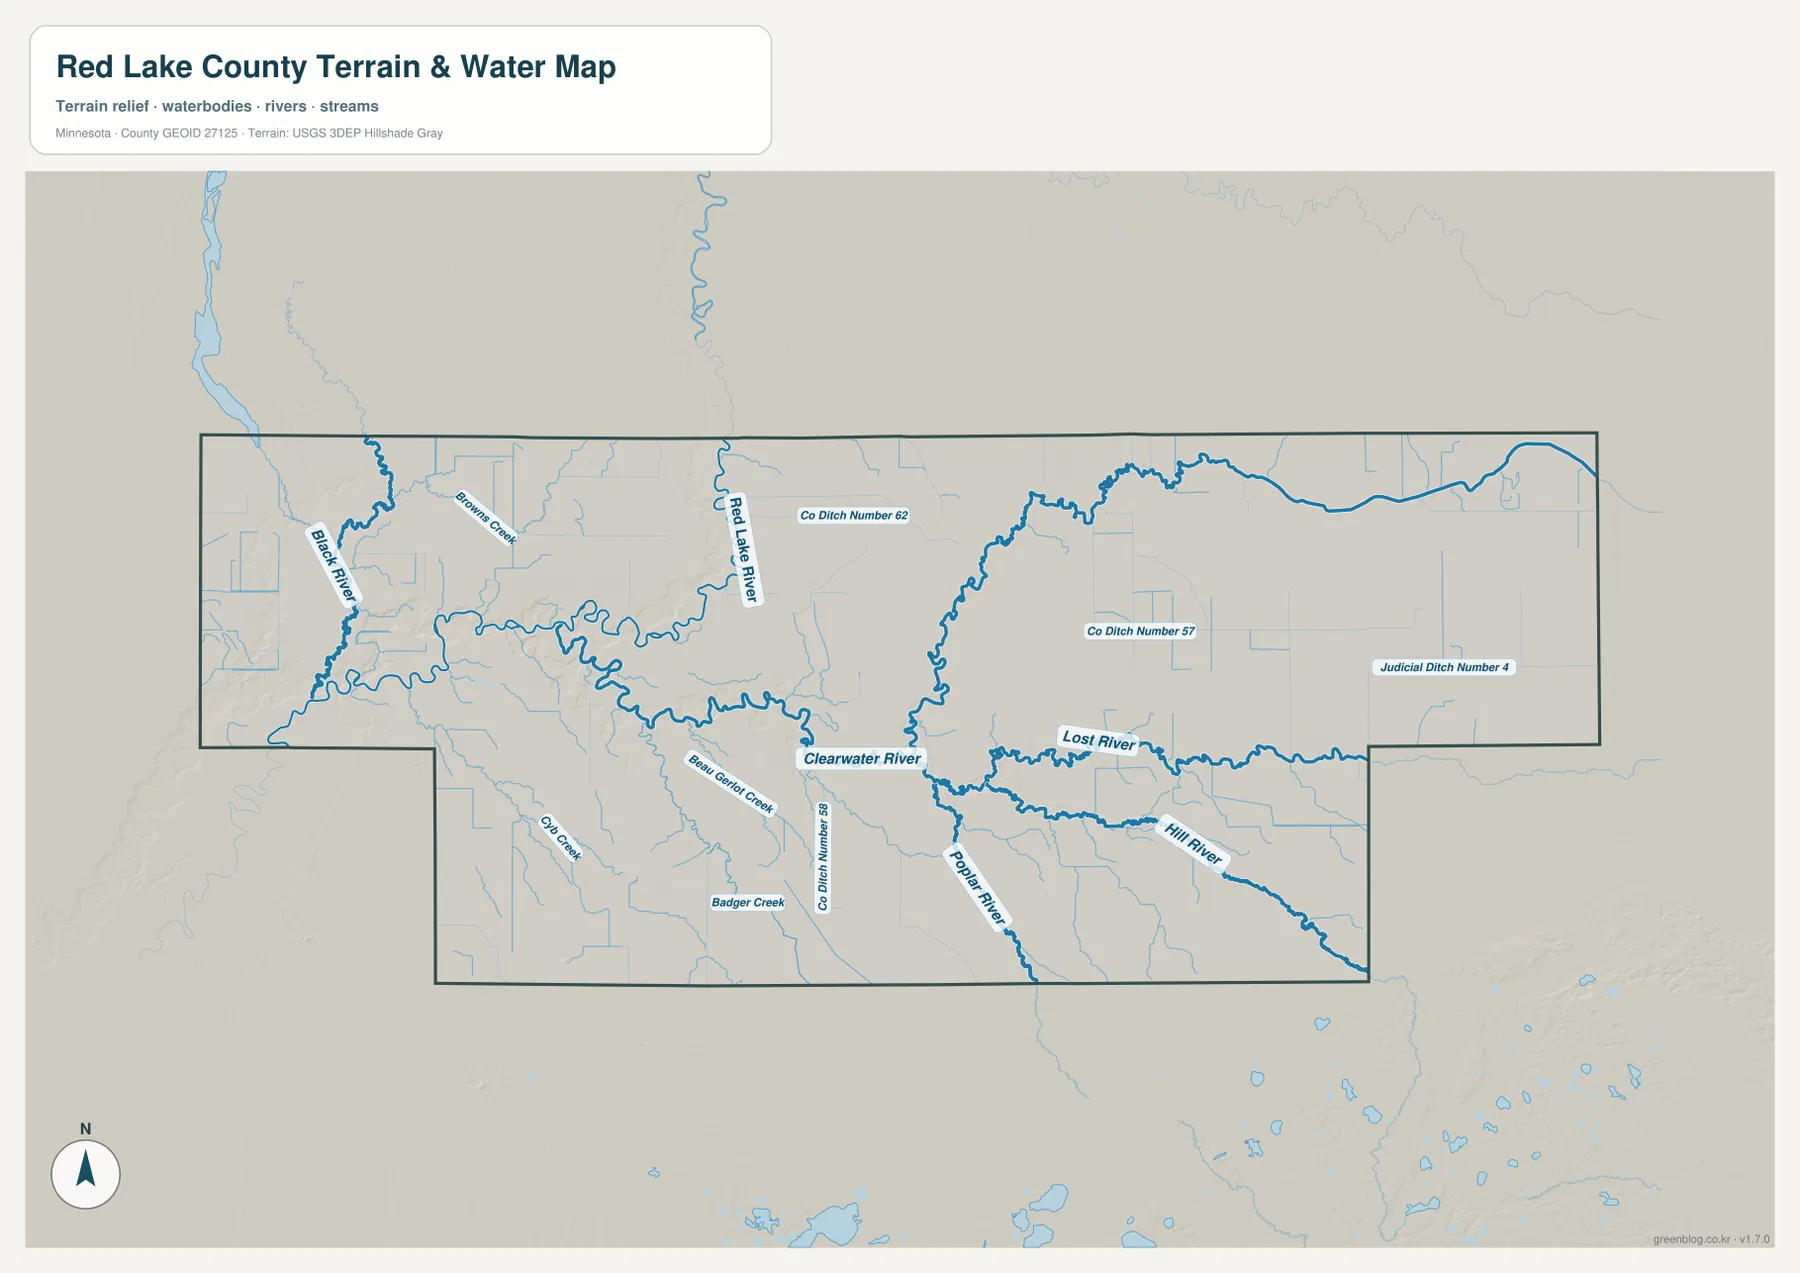
Brooks can be placed more easily once the Clearwater River is visible, while the eastern map helps relate Oklee to the Lost River and Hill River area. Looking back to the county map then connects those waterways with roads and settlements. This map is a geographic reference for rivers and channels; it is not a flood-zone, navigation, parcel, or legal-water-boundary map.
Elevation rises broadly from the western river country toward the east
The elevation map spans roughly 269 to 367 meters, with an average near 334 meters. The area around Red Lake Falls and the river meeting is shown in lower colors, while higher colors become more common through the center and especially toward the east. The broadest high ground appears around the Oklee side and parts of the southeast.
The rise is not a perfectly smooth west-to-east ramp. Lower corridors follow rivers and tributaries into otherwise higher terrain, and smaller valleys create local breaks in the pattern. A good way to interpret the map is to see the east as generally higher while recognizing that stream valleys cut lower paths through it.
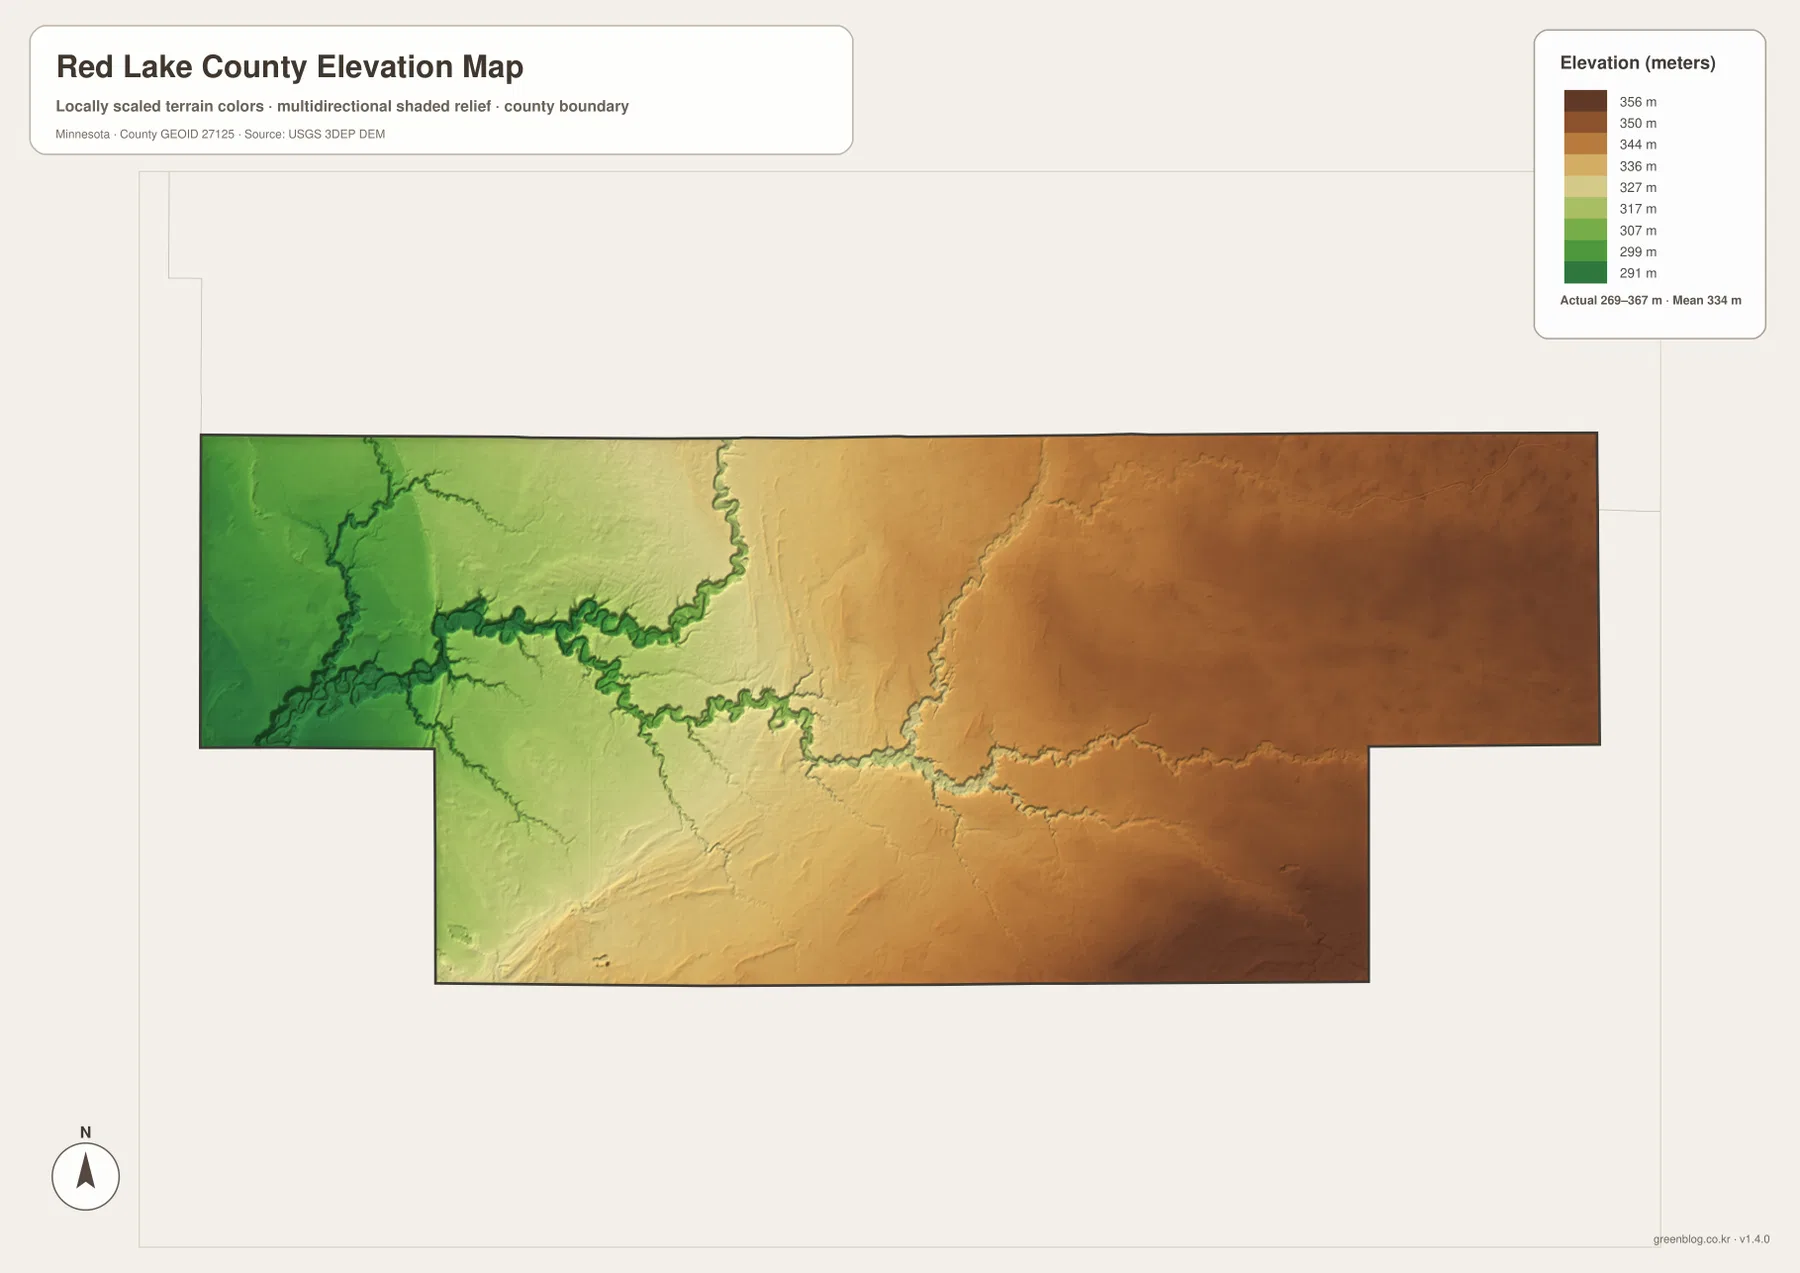
Plummer sits between the lower west and higher east, which makes it a useful midpoint when comparing the terrain. Brooks occupies south-central ground near the Clearwater River, while Oklee is surrounded by noticeably higher colors than Red Lake Falls. The surface is generalized for county-scale comparison and should not be used as a survey-grade elevation source for a building, road, or parcel.
Following the same place across the maps connects roads, rivers, and terrain
Red Lake Falls shows why the maps work best together. The county map places it in the western road network, the community layer gives it the largest displayed value, the water map shows the Red Lake and Clearwater rivers meeting nearby, and the elevation map places the surrounding land in the lower part of the county. Each view adds a different piece without needing to repeat the same information.
Oklee provides the opposite comparison. It is far to the east on the community layer, close to the Lost River and Hill River area on the water map, and surrounded by higher terrain on the elevation map. Plummer lies between the two sides of the county and helps show the transition from the river-focused west toward the higher east.
Brooks is also useful despite having the smallest displayed community value. Its south-central position becomes more meaningful when the Clearwater River and nearby roads are added. This is a good reminder that a small mapped place can still be an important reference point when explaining how settlement, water, and terrain fit together.
Choose the map according to the question you need to answer
For a general view of boundaries, roads, and communities, start with the county map. Use the simplified community layer when you need only the four mapped places and their displayed index values. The water map is the clearest choice for the Red Lake River, Clearwater River, Lost River, Hill River, and smaller channels, while the elevation map is best for explaining the low western river area and higher eastern ground.
The downloadable ZIP contains high-resolution JPG originals for all four maps shown on the page. They are larger than the WebP previews and are better suited to printing or placing on a large slide. These maps are designed for general geographic reference; legal boundaries, flood risk, engineering elevations, and current road conditions should always be checked against the appropriate official source.
Frequently Asked Questions
Where do the Red Lake River and Clearwater River meet on the map?
They come together near Red Lake Falls in the western part of the county. The water map shows the two river lines most clearly, while the county map helps place the meeting point beside roads and the community.
Which map best shows the difference between Red Lake Falls and Oklee?
The elevation map gives the clearest comparison. Red Lake Falls sits in lower western terrain around the river system, while the Oklee side is shown with higher colors. The water map adds useful context because stream valleys create lower corridors within the higher eastern area.
Are the numbers on the community map current population totals?
No. This page treats 1,348 for Red Lake Falls, 383 for Oklee, 369 for Plummer, and 133 for Brooks as the comparison values displayed on the supplied map. For current official population figures, use a current U.S. Census Bureau or Minnesota data source.
Map File Information
The ZIP contains high-resolution JPG originals of the Red Lake County map, community map, water map, and elevation map shown on this page.
- Included Files: Use only the versions confirmed in the article and supplied images
- File Type: Use the confirmed download contents
- Intended Use: Printing, education, presentations, and map-based projects
Related Maps
Sources and References
The article is based on the supplied county map package. The following official sources can be used for additional county information and more detailed boundary, water, and elevation data.
- Red Lake County official website — county government and local administrative information
- City of Red Lake Falls official website — local information for Red Lake Falls and the river setting
- U.S. Census Bureau TIGER/Line Shapefiles — official geographic data for county boundaries and roads
- USGS National Hydrography — national river, stream, and water-feature data
- USGS 3D Elevation Program — national elevation data and 3DEP information
Green Map creates custom-edited map images using open geographic data sources such as geoBoundaries, Natural Earth, OpenStreetMap, and government open data. These maps are edited visual materials, not raw data files, and are provided for education, documents, presentations, and graphic reference.