Gross capital formation is a broad measure of additions to produced assets. It includes fixed capital formation, changes in inventories, and acquisitions of valuables. The World Bank indicator NE.GDI.TOTL.KD.ZG reports the annual percentage change in this aggregate after it is expressed at constant 2015 prices. The number is therefore a real year-over-year growth rate, not an investment level and not investment as a share of GDP.
The source table contains the latest non-missing observation for 172 economies, but those observations do not all refer to 2025. There are 126 observations for 2025, 33 for 2024, four for 2023, and one each for 2020, 2018, 2016, 2015, 2014, 2011, 2006, 2004, and 2003. That mixed-year structure matters because several older observations are extreme. For a cleaner cross-country comparison, the analysis below treats the 126 economies observed in 2025 as the main synchronized group and keeps the older latest-available values separate.
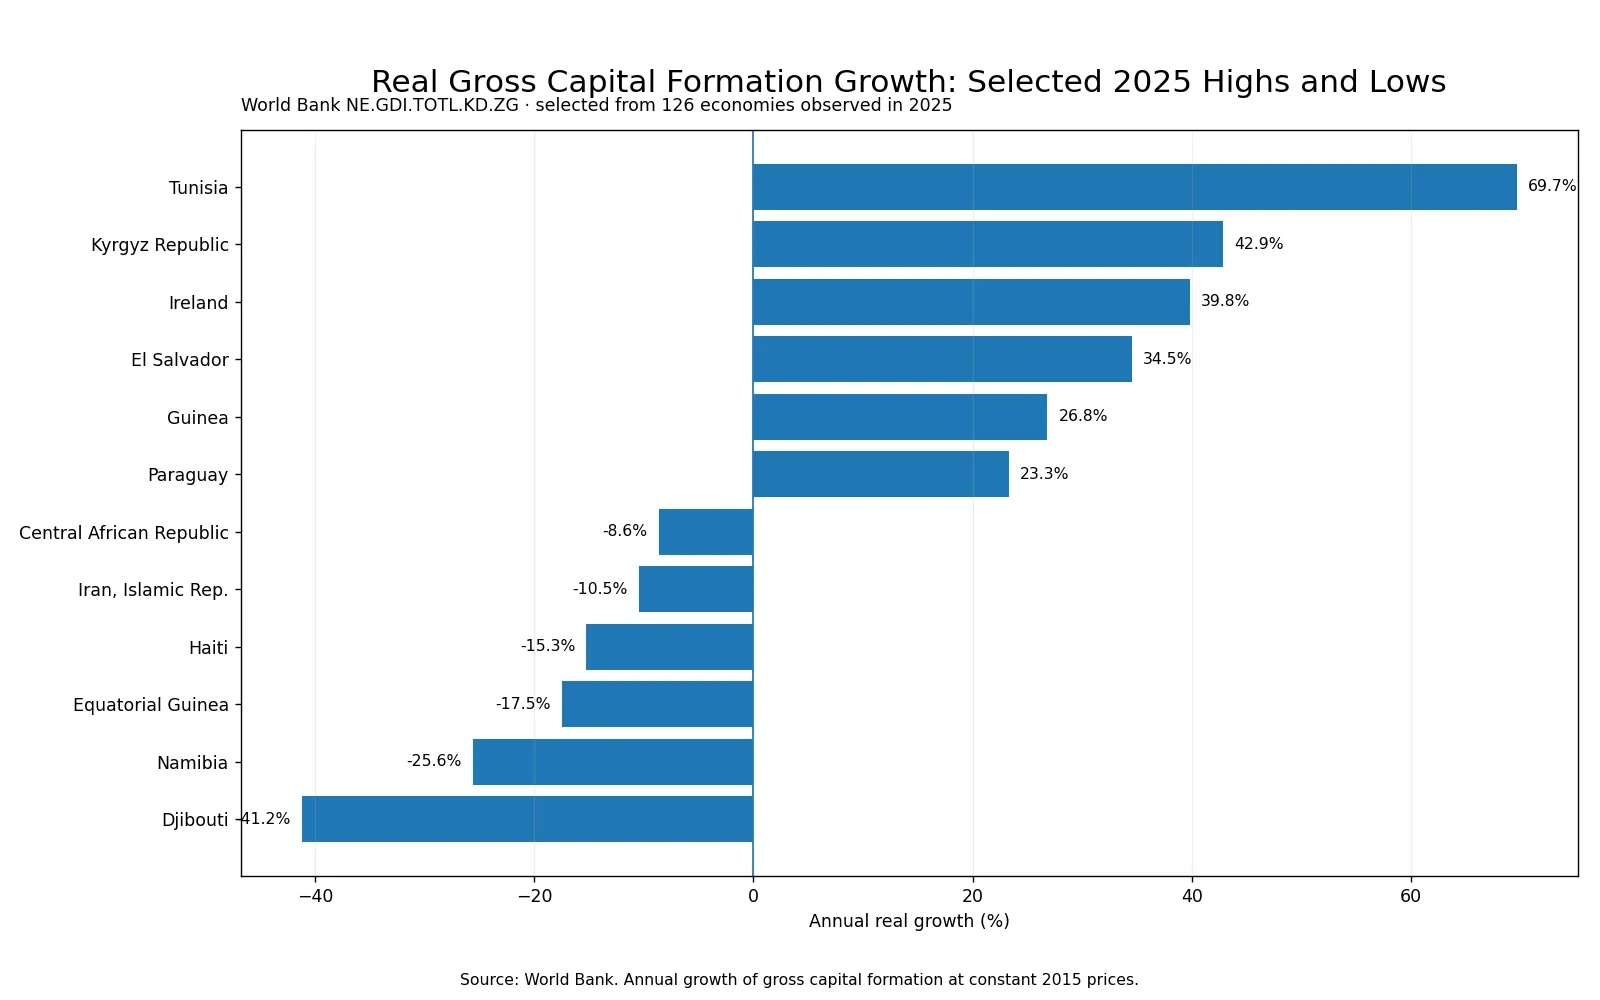
Table of Contents
What annual gross capital formation growth measures
Gross capital formation combines several components. Fixed investment in structures, machinery, equipment and other produced assets is central, but inventory accumulation and valuables are also included. The World Bank growth indicator is calculated from the constant-price series, using 2015 as the reference price base. Working in constant prices is intended to separate changes in real activity from changes caused only by inflation.
A reading of 10% means that real gross capital formation was 10% higher than in the previous year. It does not tell us which component generated that change. A large infrastructure program, stronger private equipment spending, a swing in inventories, or several changes at once could all affect the aggregate. The indicator by itself cannot establish which sector or policy caused the movement, so causal explanations require additional national accounts or investment data.
The typical 2025 economy was close to 5% growth
Among the 126 economies with a 2025 observation, the median annual growth rate was 4.86% and the simple mean was 5.80%. The first quartile was 0.55% and the third quartile was 9.71%, so the middle half of the observations fell between those two rates. The mean is only moderately above the median, although the upper tail includes several very large increases.
The direction of change was mostly positive. 96 of 126 economies (76.2%) recorded positive growth, 29 recorded a decline, and one was exactly unchanged at 0%. This tells us that positive year-over-year real capital-formation growth was more common in the 2025 sample. It does not mean that world investment rose by the same percentage, because these statistics give a small economy and a very large economy the same weight.
The largest increases and declines in the 2025 group
Tunisia had the highest 2025 observation at 69.69%. It was followed by the Kyrgyz Republic at 42.90%, Ireland at 39.84%, El Salvador at 34.55%, Guinea at 26.83%, and Paraguay at 23.34%. These are growth rates relative to each economy’s own previous year. They are not a ranking of the absolute amount of investment. An economy can post a very high growth rate after a weak base year even when its total capital formation remains much smaller than that of a large economy growing more slowly.
At the other end, Djibouti recorded -41.22%, Namibia -25.63%, Equatorial Guinea -17.48%, Haiti -15.27%, Iran -10.46%, and the Central African Republic -8.65%. A negative rate means real gross capital formation was lower than in the preceding year. It does not mean that the existing capital stock fell by that percentage, nor does a single annual decline by itself establish a long-term deterioration in investment conditions.
| Economy | Observation year | Real gross capital formation growth |
|---|---|---|
| Tunisia | 2025 | 69.69% |
| Kyrgyz Republic | 2025 | 42.90% |
| Ireland | 2025 | 39.84% |
| El Salvador | 2025 | 34.55% |
| Guinea | 2025 | 26.83% |
| Paraguay | 2025 | 23.34% |
| Djibouti | 2025 | -41.22% |
| Namibia | 2025 | -25.63% |
| Equatorial Guinea | 2025 | -17.48% |
| Haiti | 2025 | -15.27% |
| Iran, Islamic Rep. | 2025 | -10.46% |
| Central African Republic | 2025 | -8.65% |
Why a high growth rate is not the same as a high investment level
Growth rates answer a different question from levels. If capital formation rises from 10 to 15, the growth rate is 50%. If another economy rises from 1,000 to 1,050, its growth rate is only 5% even though the absolute increase is much larger. This base effect is why annual growth tables should not be described as rankings of the “largest investors.” To study scale, use a level measure. To study the role of investment in the economy, use a GDP-share measure.
The distinction also prevents a common data error: mixing annual growth with gross capital formation as a percentage of GDP. Both are expressed in percent, but their denominators and meanings are different. NE.GDI.TOTL.KD.ZG measures the rate of change in the real series. A GDP-share indicator measures the size of capital formation relative to total economic output. The two can move in different directions and should never be merged into one ranking.
Older latest-available observations need a separate label
If all 172 latest-available observations are sorted without regard to year, Eritrea appears at 466.89% for 2011 and Yemen at 181.78% for 2018. Those values are legitimate observations in the source extract, but they are not comparable to 2025 conditions as if they occurred at the same time. The simple mean across all 172 rows is 8.37%, compared with 5.80% for the synchronized 2025 group. The older extreme values are one reason the mixed-year mean is higher.
For maps and tables built from latest-available data, the observation year should therefore travel with every value. Missing 2025 observations must not be filled with zero. Zero is a valid economic observation meaning no year-over-year change, whereas missing data means no observation was available for that year. In the 2025 group, one economy is genuinely recorded at exactly 0%; the economies whose latest values are older are kept as older observations instead of being converted to zero.
What this indicator can and cannot tell us
The indicator is useful for identifying the speed and direction of annual change in real capital formation. It can show whether most economies in a common year were expanding or contracting, reveal the width of the cross-country distribution, and flag unusually large movements for further research. With a synchronized year such as 2025, it offers a straightforward cross-sectional comparison of momentum.
It cannot, by itself, measure the quality of investment, the future return on capital, productivity effects, investor confidence, or the success of a particular policy. A surge may include temporary inventory accumulation or a one-off project. A decline may follow an unusually strong previous year. Those explanations are possibilities, not conclusions from this series. Country-specific interpretation should combine this indicator with fixed investment, sector data, fiscal information, and multi-year history.
A time series is more informative than a one-year rank
Annual capital-formation growth can be volatile. Large projects can begin or end, inventories can reverse, and the previous year’s base can change the percentage sharply. For that reason, a three- to five-year series usually tells more about persistent investment momentum than a single ranking. Pairing the growth rate with the real level of gross capital formation and its share of GDP also helps distinguish rapid rebounds from sustained high investment.
The first check in any country comparison should be the observation year. The 126-economy 2025 subset is highlighted here precisely because it holds the calendar year constant. As more countries report newer data, some of the 2024 or older latest observations will be replaced. Future updates should therefore be read as changing evidence rather than as a fixed league table.
What the 2025 comparison shows
The central message is simple: real gross capital formation increased in roughly three quarters of the economies with a 2025 observation, and the median increase was 4.86%. At the same time, the spread was wide, from Tunisia’s 69.69% increase to Djibouti’s 41.22% decline. That gap describes differences in year-over-year momentum, not differences in the total amount of investment or an overall ranking of investment attractiveness.
The broader 172-row extract remains useful as a latest-available coverage file, but its mixed observation years need to stay visible. Separating the synchronized 2025 group from the older values avoids letting stale outliers dominate the interpretation and keeps the article aligned with what the World Bank indicator actually measures: annual real change in gross capital formation.
Frequently Asked Questions
What does annual gross capital formation growth measure?
It measures the percentage change from the previous year in gross capital formation at constant prices. It is different from the level of investment or investment as a share of GDP.
Why focus on 126 economies instead of all 172 rows?
The 172 rows are latest non-missing observations with years ranging from 2003 to 2025. The 126-economy subset holds the observation year constant at 2025 for a cleaner comparison.
Does a high growth rate mean an economy has a high investment level?
Not necessarily. Growth measures the rate of change from the previous year, while the level measures the amount. A low base can produce a high percentage increase.
Related Articles
Green Map creates custom-edited map images using open geographic data sources such as geoBoundaries, Natural Earth, OpenStreetMap, and government open data. These maps are edited visual materials, not raw data files, and are provided for education, documents, presentations, and graphic reference.