World Bank indicator IC.FRM.EXS.ZS measures the percentage of firms whose direct exports account for at least 10% of total annual sales. The 10% figure is the firm-level threshold used to classify a firm; the country value is the percentage of surveyed firms that meet that threshold. A country value of 20% therefore means that about one in five surveyed firms generated at least a tenth of annual sales through direct exports, not that exports accounted for 20% of the country’s total sales.
The available data contain the most recent non-missing observation for 179 economies, but those observations are not all from 2025. There are 62 observations for 2025, 48 for 2024, 45 for 2023 and 24 from 2022 or earlier, with the oldest values reaching back to 2009. A single ranking of all 179 as if they described the same year would mix time effects with cross-country differences. The main comparison below therefore uses the 62 economies observed in 2025.
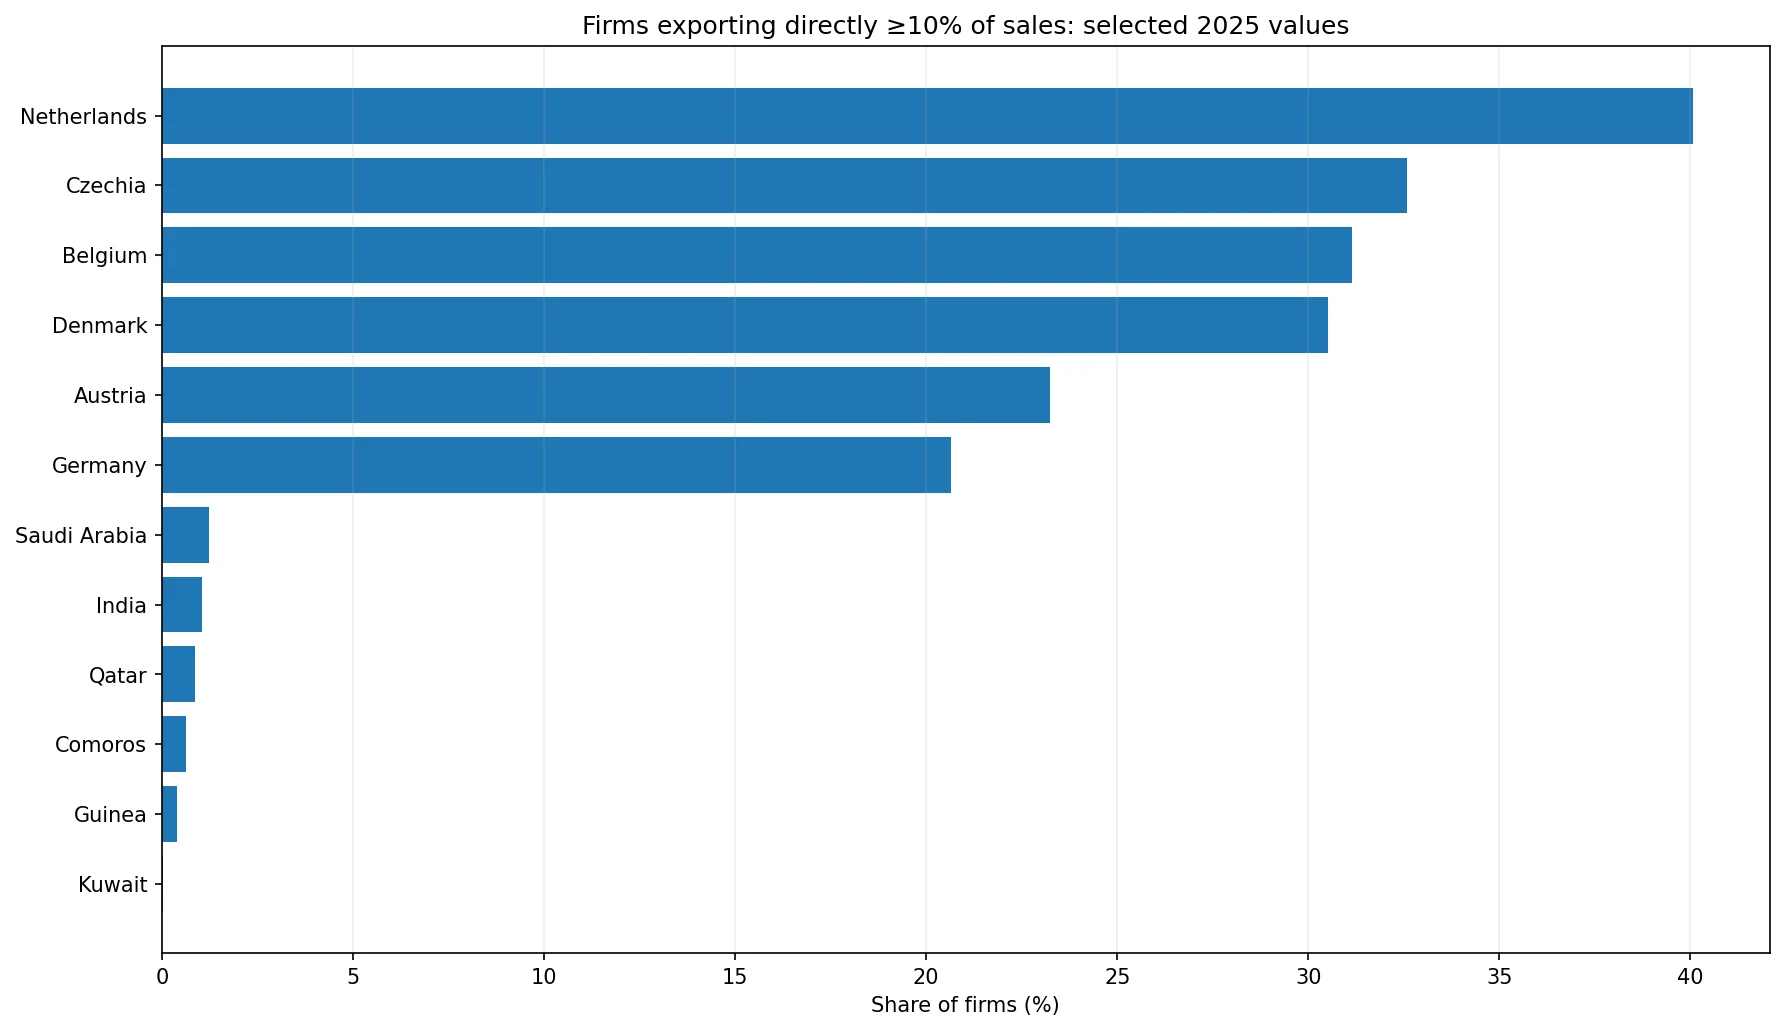
Table of Contents
The 10% threshold and the country percentage answer different questions
The phrase “at least 10% of sales” describes the export intensity required for an individual firm to count in the indicator. The percentage reported for an economy describes how common those firms are in the survey. This distinction is easy to lose when the indicator name and the country value both contain percentages. For the Netherlands, 40.07% does not mean direct exports equal 40.07% of all business sales. It means 40.07% of surveyed firms passed the 10%-of-sales direct-export threshold.
The indicator also captures only direct exporting above that threshold. Firms can reach foreign customers indirectly through intermediaries, wholesalers or other domestic firms. A company can also export directly but still fall below the 10% sales threshold. The measure is therefore narrower than total export participation and very different from national exports as a share of GDP, the trade balance or the value of merchandise exports.
The 2025 median is 6.80% across 62 observed economies
Among the 62 economies with a 2025 observation, the median is 6.80% and the simple mean is 9.56%. The middle half of the distribution runs from 3.95% to 12.83%. The mean is noticeably higher than the median because a small group of economies has shares in the 20% to 40% range, creating a long upper tail.
19 of the 62 economies reach at least 10%, while 7 reach at least 20%. At the other end, 20 are below 5%. The distribution therefore shows substantial differences in how widely direct exporting is spread across surveyed firms. It does not by itself explain those differences, because industry structure, firm size, geography, market access and survey composition can all matter.
The Netherlands, Czechia, Belgium and Denmark lead the 2025 group
The Netherlands has the highest 2025 value at 40.07%. Czechia follows at 32.57%, Belgium at 31.14% and Denmark at 30.52%. Austria records 23.25% and Germany 20.65%, while Guatemala is also above 20% at 20.58%. These values indicate that firms with substantial direct-export sales are relatively common within the surveyed business populations of those economies.
Several European economies appear near the top, but the indicator alone cannot identify a cause. Proximity to foreign markets, participation in cross-border supply chains, manufacturing structure, the prevalence of small open economies and the composition of surveyed firms can all contribute. The data support a description of where the shares are high; they do not support attributing the pattern to one policy or institutional feature without additional evidence.
Kuwait, Guinea, Comoros and Qatar are below 1%
At the lower end, Kuwait records 0.03%, Guinea 0.40%, Comoros 0.62% and Qatar 0.88%. India is at 1.04%, Saudi Arabia at 1.23%, Burundi at 1.73% and Brazil at 2.11%. These figures mean firms meeting the direct-export threshold are uncommon in the surveyed business populations for those 2025 observations.
A low value does not mean the economy exports little. National exports can be dominated by a small number of very large firms or sectors even when most surveyed firms do not export directly at the required intensity. Firms may also participate indirectly in export supply chains. This is why firm-count indicators and export-value indicators can tell very different stories about the same economy.
| Economy | Year | Share of firms |
|---|---|---|
| Netherlands | 2025 | 40.07% |
| Czechia | 2025 | 32.57% |
| Belgium | 2025 | 31.14% |
| Denmark | 2025 | 30.52% |
| Austria | 2025 | 23.25% |
| Germany | 2025 | 20.65% |
| Kuwait | 2025 | 0.03% |
| Guinea | 2025 | 0.40% |
| Comoros | 2025 | 0.62% |
| Qatar | 2025 | 0.88% |
| India | 2025 | 1.04% |
| Saudi Arabia | 2025 | 1.23% |
Why the 179 latest observations should not become one current ranking
Across all 179 latest observations, the median is 7.73% and the mean is 10.47%, but those summaries combine survey years from 2009 through 2025. Some economies were measured during very different trade, exchange-rate and business-cycle conditions. Treating all values as a current cross-section would risk interpreting a difference in survey timing as a difference in national business structure.
| Reference year | Economies | How it is used here |
|---|---|---|
| 2025 | 62 | Used for the same-year comparison |
| 2024 | 48 | Latest-value coverage only |
| 2023 | 45 | Latest-value coverage only |
| 2022 or earlier | 24 | Kept separate from current comparison |
The 2025 subset is therefore the cleanest basis for a same-year comparison. The 2024 and 2023 values remain useful for showing recent coverage, while older observations can still be valuable as country-specific historical evidence. They simply should not be placed in an undifferentiated 2025 league table. Any global map based on the latest available observation should display the observation year alongside the value.
A firm-count indicator is not the same as export value
National export statistics are often concentrated in a relatively small number of firms or industries. IC.FRM.EXS.ZS asks a different question: how broadly substantial direct exporting is distributed across firms. Two economies can have similar export values but very different shares of firms crossing the 10% direct-export threshold. One may rely heavily on a few large exporters; another may have export activity spread across a larger business population.
That makes the indicator useful for studying the breadth of business internationalization, but it does not measure export quality, value added, profitability, destination diversity or technological sophistication. A high percentage should not automatically be labelled better, and a low percentage should not automatically be labelled weak. Domestic market size and sector composition can make different export structures economically rational.
The 2025 distribution has a pronounced upper tail
The gap between the 2025 median of 6.80% and mean of 9.56% is a sign of skewness. Only 7 economies exceed 20%, yet the Netherlands is above 40%. A handful of high observations pull the arithmetic average upward, so the average alone overstates what a typical economy in the 2025 group looks like.
The lower half is also broad. 20 economies are below 5%, and several are near or below 1%. For interpretation, broad bands such as under 5%, 5–10%, 10–20% and 20% or more are often more useful than a precise rank. Small differences within a narrow range can reflect sampling variation and should not be treated as meaningful competitive gaps without more evidence.
What the indicator can and cannot show
The measure can show how common firms with substantial direct-export sales are in the surveyed population. When the year is aligned, it can support cross-country comparisons of the breadth of direct export participation. With repeated observations for the same economy, it can also show whether this form of exporting is becoming more or less widespread over time.
It cannot show total export value, trade balance, average exports per firm, indirect exporting, destination markets or the value added embodied in exports. It should also not be assumed that the survey universe is identical to a complete census of every business. More detailed causal analysis would require the underlying Enterprise Surveys information and complementary national trade statistics.
Latest-value maps need an observation-year label
A map of all 179 latest observations can be useful for geographic coverage, but every tooltip or table should pair the percentage with its reference year. Otherwise a 2010 value can appear visually equivalent to a 2025 observation even though the business environment may have changed substantially. The age of the observation is part of the information, not a technical detail to hide.
Missing economies should also remain missing rather than being assigned 0%. A true 0% would mean no surveyed firm met the indicator threshold, while missing data mean no usable observation is available in the set being displayed. Replacing missing values with zeros would artificially enlarge the low end of the distribution and distort any average or map classification.
The clearest 2025 takeaway
The 62-economy 2025 comparison shows a wide spread in the prevalence of firms that derive at least 10% of sales from direct exports. The median is 6.80%, while the Netherlands, Czechia, Belgium and Denmark are above 30% or close to it. Kuwait, Guinea, Comoros and Qatar are below 1%. The size of that range suggests that firm-level direct export participation differs markedly across the observed economies.
The two most important interpretation rules are to keep the denominator and the year straight. The country percentage is the share of surveyed firms meeting a firm-level export threshold, not the share of national sales that are exported. And the 179 latest observations do not all describe 2025. Respecting those two limits produces a much more accurate picture than a simple global ranking.
Source and interpretation limits
The source is World Bank indicator IC.FRM.EXS.ZS, reported as the percentage of firms exporting directly at least 10% of total annual sales. The supplied country file contains the most recent non-missing observation for each economy. This article uses the 62 observations dated 2025 for the main same-year comparison and treats earlier observations as coverage information rather than current values.
A stronger follow-up analysis would connect repeated observations for the same economies and compare the indicator with exports of goods and services, firm size, manufacturing share and foreign investment. That would help separate broad participation in direct exporting from the overall value of trade and show whether changes are structural or tied to particular survey years.
Frequently Asked Questions
What does the 10% threshold mean?
It classifies a firm whose direct exports account for at least 10% of total annual sales. The country value is the share of surveyed firms meeting that condition.
Can all 179 economies be ranked as 2025 observations?
No. The 179 values are the latest non-missing observations and their reference years range from 2009 to 2025.
Does a higher firm share necessarily mean higher national exports?
No. The indicator counts firms meeting an export-intensity threshold; it does not measure the total value of national exports.
Related Articles
Green Map creates custom-edited map images using open geographic data sources such as geoBoundaries, Natural Earth, OpenStreetMap, and government open data. These maps are edited visual materials, not raw data files, and are provided for education, documents, presentations, and graphic reference.