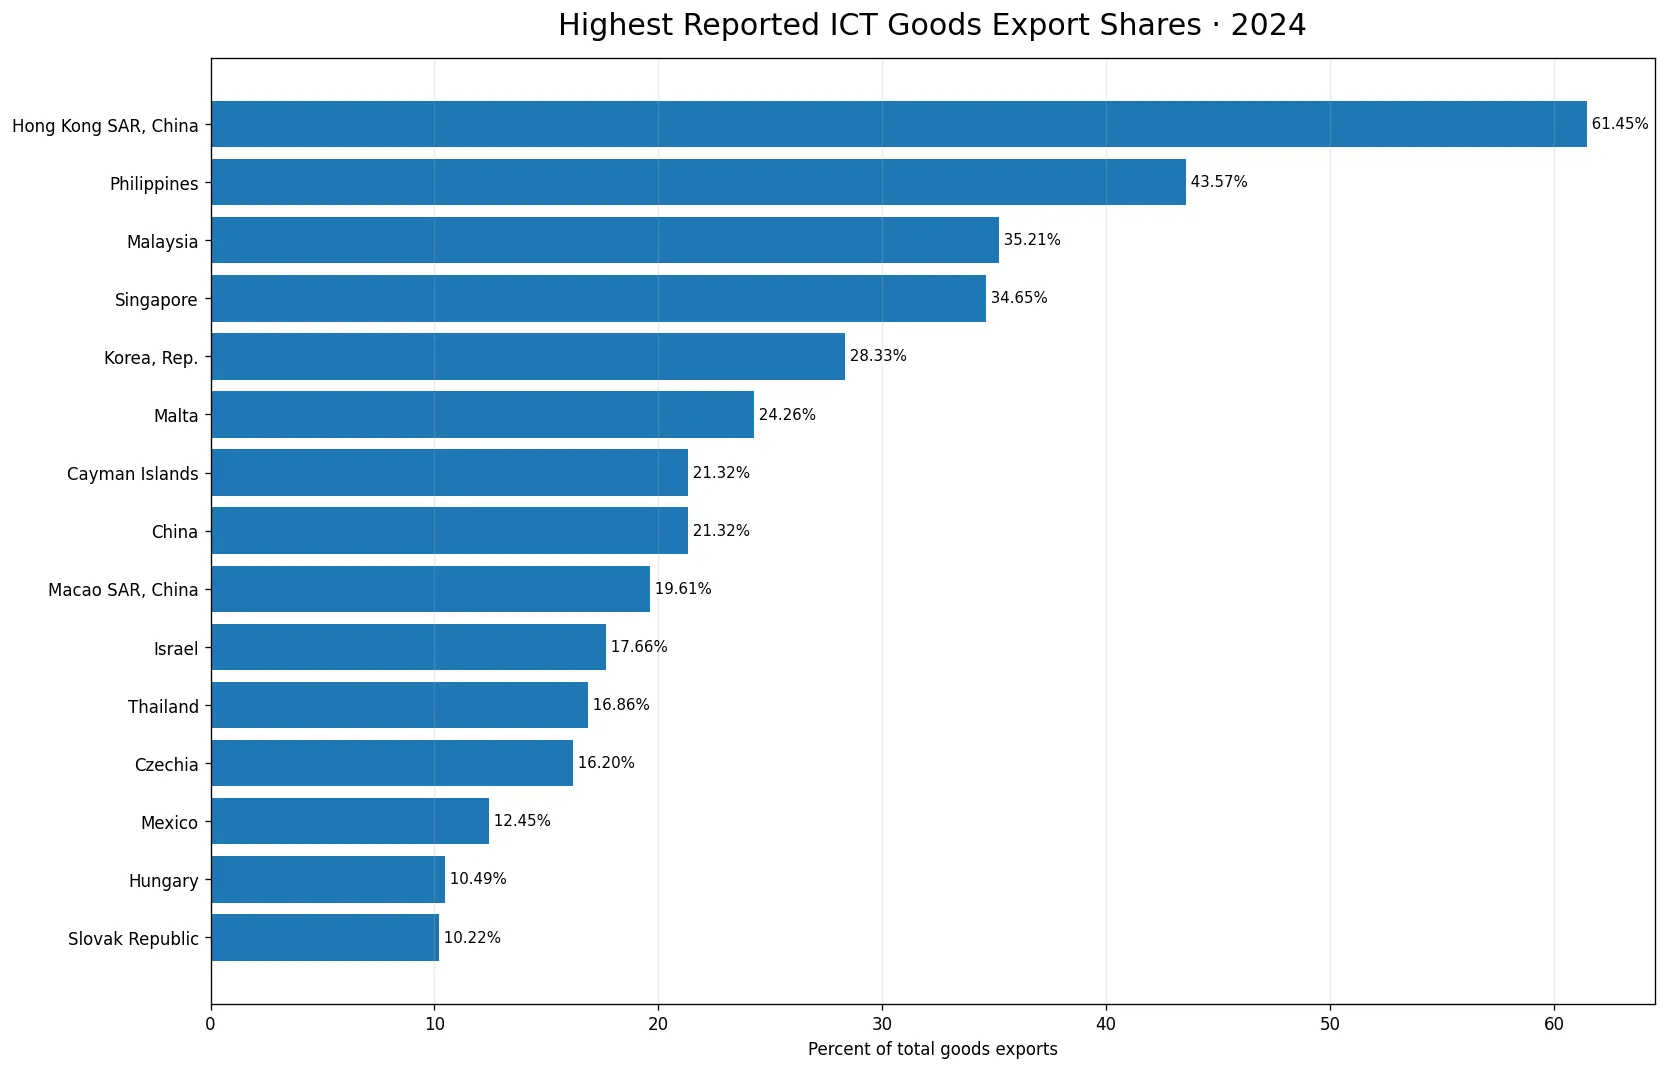
ICT goods accounted for very different shares of merchandise exports across reporting countries and economies in 2024. In the World Bank series TX.VAL.ICTG.ZS.UN, Hong Kong SAR, China reports the highest share at 61.45%. The Philippines follows at 43.57%, Malaysia at 35.21%, and Singapore at 34.65%. These percentages do not measure the absolute dollar value of ICT exports and they are not shares of the global ICT market. The denominator is each economy’s own total goods exports, so the indicator is best read as a measure of export composition: how much of a reporting economy’s merchandise export basket consists of ICT goods.
That distinction matters because an economy with a lower percentage can still export a larger absolute amount of ICT goods if its total merchandise exports are much larger. Conversely, a smaller economy with a concentrated electronics or re-export sector can record a high percentage even when its export value is modest in global terms. The 2024 comparison contains 120 reported values out of 217 World Bank countries and economies. The remaining 97 observations are source-missing and remain no data rather than being converted to zero. This preserves the difference between missing reporting and an actual reported value of 0%.
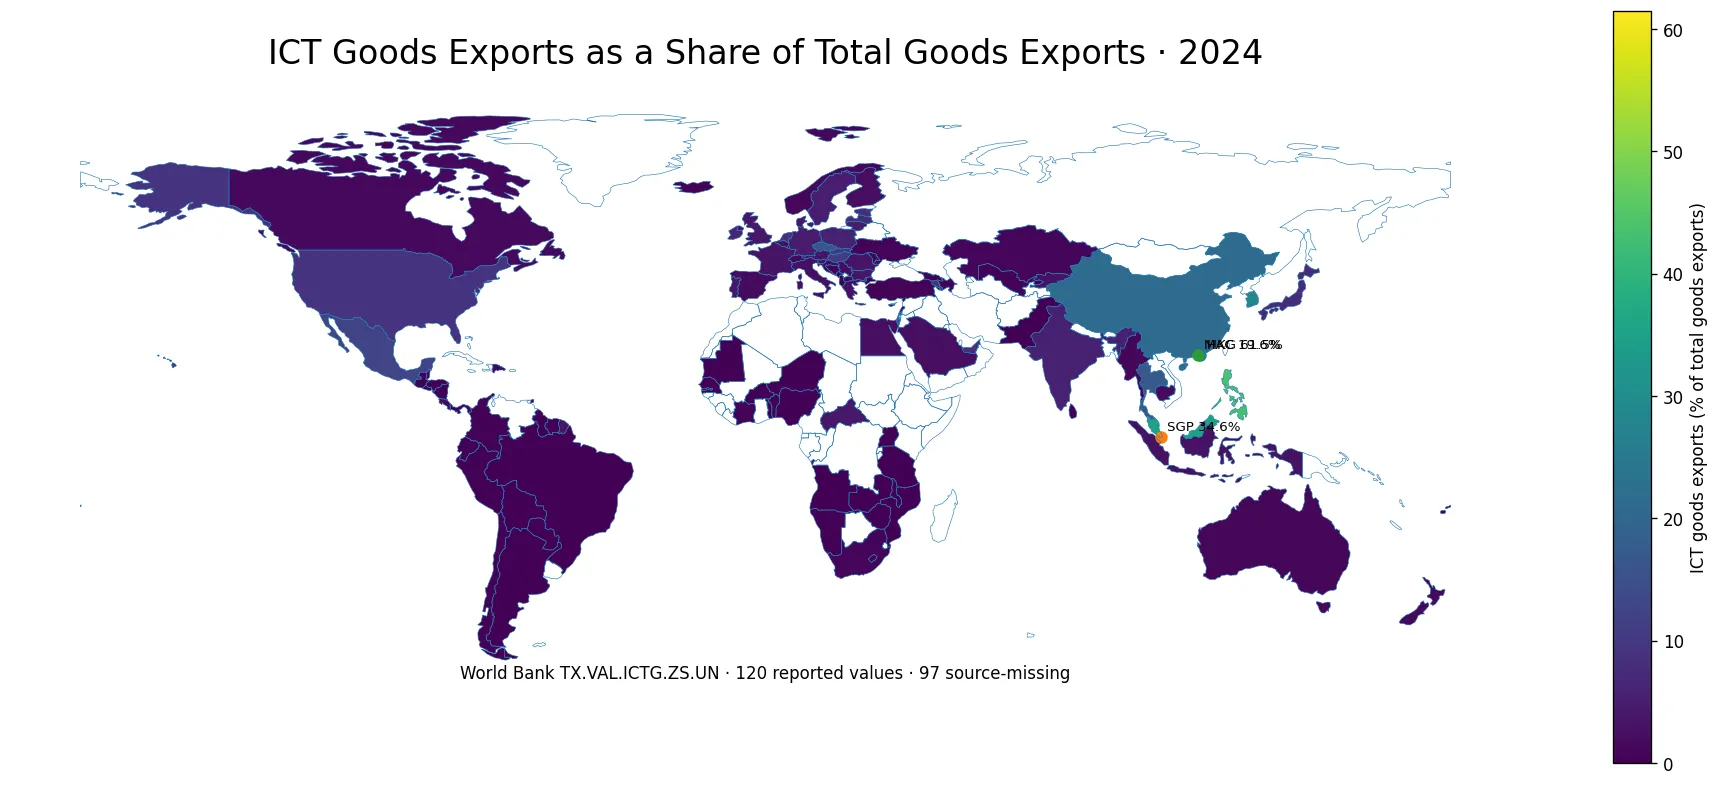
Table of Contents
Only four reported economies are above 30%
The upper end of the distribution is narrow. Only four of the 120 reported economies are at or above 30%: Hong Kong SAR, China at 61.45%, the Philippines at 43.57%, Malaysia at 35.21%, and Singapore at 34.65%. Their positions indicate that ICT products occupy a particularly large part of their merchandise export baskets. The indicator itself, however, does not explain why. Electronics manufacturing, component trade, assembly, logistics, and re-exports can all affect the numerator, while the size of other export sectors changes the denominator. A high share is therefore evidence of export concentration in ICT goods, not a complete ranking of technological capability or industrial performance.
Only eight reported values reach 20%
The group above 20% is also small: eight reporting economies reach that threshold. Beyond the four leaders, Malta records 24.26%, China 21.32%, and the Cayman Islands 21.32%, with another reported economy also above the threshold. A 20% share means that at least one fifth of the economy’s merchandise export value falls within the ICT-goods classification. This can be economically important, but the same percentage can describe very different trade structures. A large manufacturing economy and a small trade hub may arrive at similar ratios through very different combinations of production, assembly, imported components, and re-export activity.
The median is just 0.975%
The median across the 120 reported values is 0.975%, far below the maximum of 61.45%. The mean is 4.65%, which is much higher than the median because a relatively small number of large percentages pull the average upward. The first quartile is 0.17% and the third quartile is 3.92%, so the middle half of reported observations lies roughly between those two values. This strongly right-skewed distribution is one of the most important findings. The very high percentages visible at the top should not be treated as typical. For most reporting economies, ICT goods make up a much smaller part of total merchandise exports.
More than half of reported economies are below 1%
Sixty-one of the 120 reported economies have an ICT-goods export share below 1%. A low percentage does not mean that ICT products are absent or economically unimportant. The ratio can be small because other merchandise categories dominate exports: fuels, minerals, agricultural goods, apparel, vehicles, machinery, chemicals, or other manufactured products. An economy can export meaningful quantities of ICT goods and still have a low share if its overall merchandise export base is much larger. This is why the denominator must remain visible in any interpretation. The indicator describes composition, not the absolute scale of ICT trade.
Fifteen reported economies are in double digits
Fifteen reported economies have values of at least 10%. Below the leaders, Macao SAR, China records 19.61%, Israel 17.66%, Thailand 16.86%, Czechia 16.20%, Mexico 12.45%, Hungary 10.49%, and the Slovak Republic 10.22%. The group spans East and Southeast Asia, Europe, and North America. That geographic spread suggests there is no single regional story that explains every high value. Different economies can reach double-digit shares through semiconductor supply chains, electronics manufacturing, assembly operations, specialized components, or trade-hub functions. The percentage identifies the outcome in export composition; explaining the mechanism requires additional production and trade data.
The map highlights clusters but also exceptions
The geographic pattern shows several high-share economies in East and Southeast Asia, yet neighboring countries do not all have similar values. Europe also contains a mix of relatively high and low shares, with Czechia, Hungary, and the Slovak Republic standing out among the double-digit observations. Mexico records 12.45% and the United States 9.05%, showing that sizable ICT shares are not confined to one region. A map is useful for spotting spatial patterns, but it can also encourage overgeneralization. The correct reading is at the level of individual reported economies, with regional similarities treated as questions for further investigation rather than proof of a common cause.
A high share is not the same as a high export value
Because this is a percentage-of-exports indicator, rank by share can differ sharply from rank by export value. Imagine one economy whose merchandise exports total 100 units and whose ICT share is 30%; its ICT exports would be 30 units. Another economy could have exports of 1,000 units and an ICT share of 10%, which would imply 100 units of ICT exports. The example is only arithmetic, but it shows why the ratio cannot identify the world’s largest ICT exporters. A value-based trade series is needed for that question. The present indicator instead answers how strongly ICT products are represented within each reporting economy’s own export basket.
Re-exports and global supply chains can shape the ratio
ICT goods often move through complex international supply chains. Components can cross borders before final assembly, finished devices can be routed through trade hubs, and re-export activity can be significant in some economies. A high export share therefore does not reveal how much domestic value was created locally. It also does not distinguish manufacturing from logistics or re-export functions by itself. These are important analytical limits rather than flaws in the indicator. The ratio remains useful for identifying economies where ICT goods are prominent in merchandise exports, but measures of value added, domestic production, firm activity, and supply-chain position answer different questions.
Missing observations are not zero exports
Ninety-seven of the 217 countries and economies have no 2024 value in this comparison. Those observations must remain missing. They do not mean that ICT goods represented 0% of exports. By contrast, The Gambia and Nigeria have actual reported values of 0% in the source series. Treating all missing observations as zero would materially distort the distribution, lower the mean and median, and create false geographic patterns on the map. Keeping source-missing observations separate also makes the coverage limitation transparent: the ranking and summary statistics apply to the 120 reported observations, not to every economy in the World Bank country master.
Small economies can show large denominator effects
Several small economies or trade hubs appear high in the ranking. That pattern is consistent with the mathematics of a share measure: if a narrow set of products dominates a relatively small merchandise export base, the percentage can become large. This does not make the observation unimportant. Concentration is itself economically meaningful because it indicates how strongly the export basket depends on a product group. The caution is about what follows from the percentage. A high share should not automatically be interpreted as a larger manufacturing base, more research and development, greater domestic technological content, or a larger contribution to global ICT supply.
The 2024 value is a snapshot, not a long-term trend
The comparison uses a single year, 2024. ICT export shares can change when semiconductor cycles shift, electronics demand rises or falls, exchange rates move, factories open or close, supply chains are reorganized, or other export categories experience large price changes. The denominator can change even if ICT exports themselves are relatively stable. For that reason, a one-year share is best read as a snapshot of trade structure. A trend analysis would require the same indicator across multiple years, with attention to changes in reporting coverage as well as changes in the underlying trade flows.
The indicator cannot rank overall technological strength
TX.VAL.ICTG.ZS.UN can show the prominence of ICT goods in merchandise exports, but it cannot directly measure innovation, research intensity, digital-service exports, software activity, productivity, employment quality, domestic ownership, or technological independence. It also says nothing by itself about whether a high or low share is economically desirable. Countries specialize in different sectors and can prosper with very different export structures. The indicator is most informative when used as one descriptive layer in a broader trade analysis rather than as a score of national technology performance.
Use complementary measures for a fuller trade picture
A deeper comparison would place this share beside the absolute value of ICT-goods exports, total merchandise exports, the share of ICT goods in imports, and detailed product categories such as electronic components or communication equipment. Those measures can help distinguish large-scale manufacturing from specialized trade or re-export roles. They may also reveal whether a high export share is accompanied by similarly high ICT imports, which can be relevant for supply-chain analysis. Those conclusions require separate evidence, however. The 2024 share should first be read on its own terms before adding other indicators.
Coverage is broad but not complete
The 120 reported observations provide substantial global coverage, but 97 source-missing economies mean the results are not a complete ranking of every country and territory. Some missing economies could have high or low shares that are simply unavailable for 2024. The World Bank country master also includes separately reported territories and economies, so the total of 217 should not be interpreted as a count of sovereign states. Precise language matters: the figures describe countries and economies with reported values in this series, not a universal census of all national export structures.
The central message is about composition, not size
The strongest contrast in 2024 is between a small group of very high-share economies and a much lower central tendency. The maximum is 61.45%, while the median is only 0.975%. That gap shows how concentrated ICT goods are in the merchandise export baskets of a limited number of economies, while the product group represents a small share for many others. Keeping “share of exports” separate from “amount exported” prevents the most common misreading. The indicator is therefore a useful map of export specialization, provided its denominator, missing data, and limits are kept in view.
Frequently Asked Questions
What does ICT goods exports as a share of total goods exports measure?
It measures the percentage of an economy’s merchandise exports classified as ICT goods, including computers, communication equipment, electronic components, and related products.
Does a higher share mean a larger absolute value of ICT exports?
No. The denominator is each economy’s total merchandise exports, so the ranking by share can differ from the ranking by export value.
Are source-missing economies treated as 0%?
No. The 97 missing 2024 observations remain no data and are kept separate from the two actual reported 0% values.
Can this percentage be used as a technology-competitiveness ranking?
Not by itself. It describes export composition, while innovation, value added, productivity, and digital services require other indicators.
Related Articles
Green Map creates custom-edited map images using open geographic data sources such as geoBoundaries, Natural Earth, OpenStreetMap, and government open data. These maps are edited visual materials, not raw data files, and are provided for education, documents, presentations, and graphic reference.