Chisago County lies northeast of the Twin Cities, stretching from the I-35 corridor east to the St. Croix River on the Wisconsin border. North Branch, Wyoming, Chisago City, Lindstrom, Rush City, and Stacy occupy different parts of a landscape filled with lakes, streams, rolling uplands, and broad river lowlands. The contrast between the higher western terrain and the lower Sunrise and St. Croix corridors becomes especially clear when the road, water, and elevation maps are compared. High-resolution map files are available for download in the section below.
This page combines a general county map, a six-city ranking index, a water map, and an elevation map with an actual range of roughly 209 to 342 meters. High-resolution A3 JPG originals for all four maps are available together in one ZIP for printing, classroom use, trip preparation, and county-scale comparison.
Table of Contents
I-35 links Rush City, North Branch, Stacy, and Wyoming
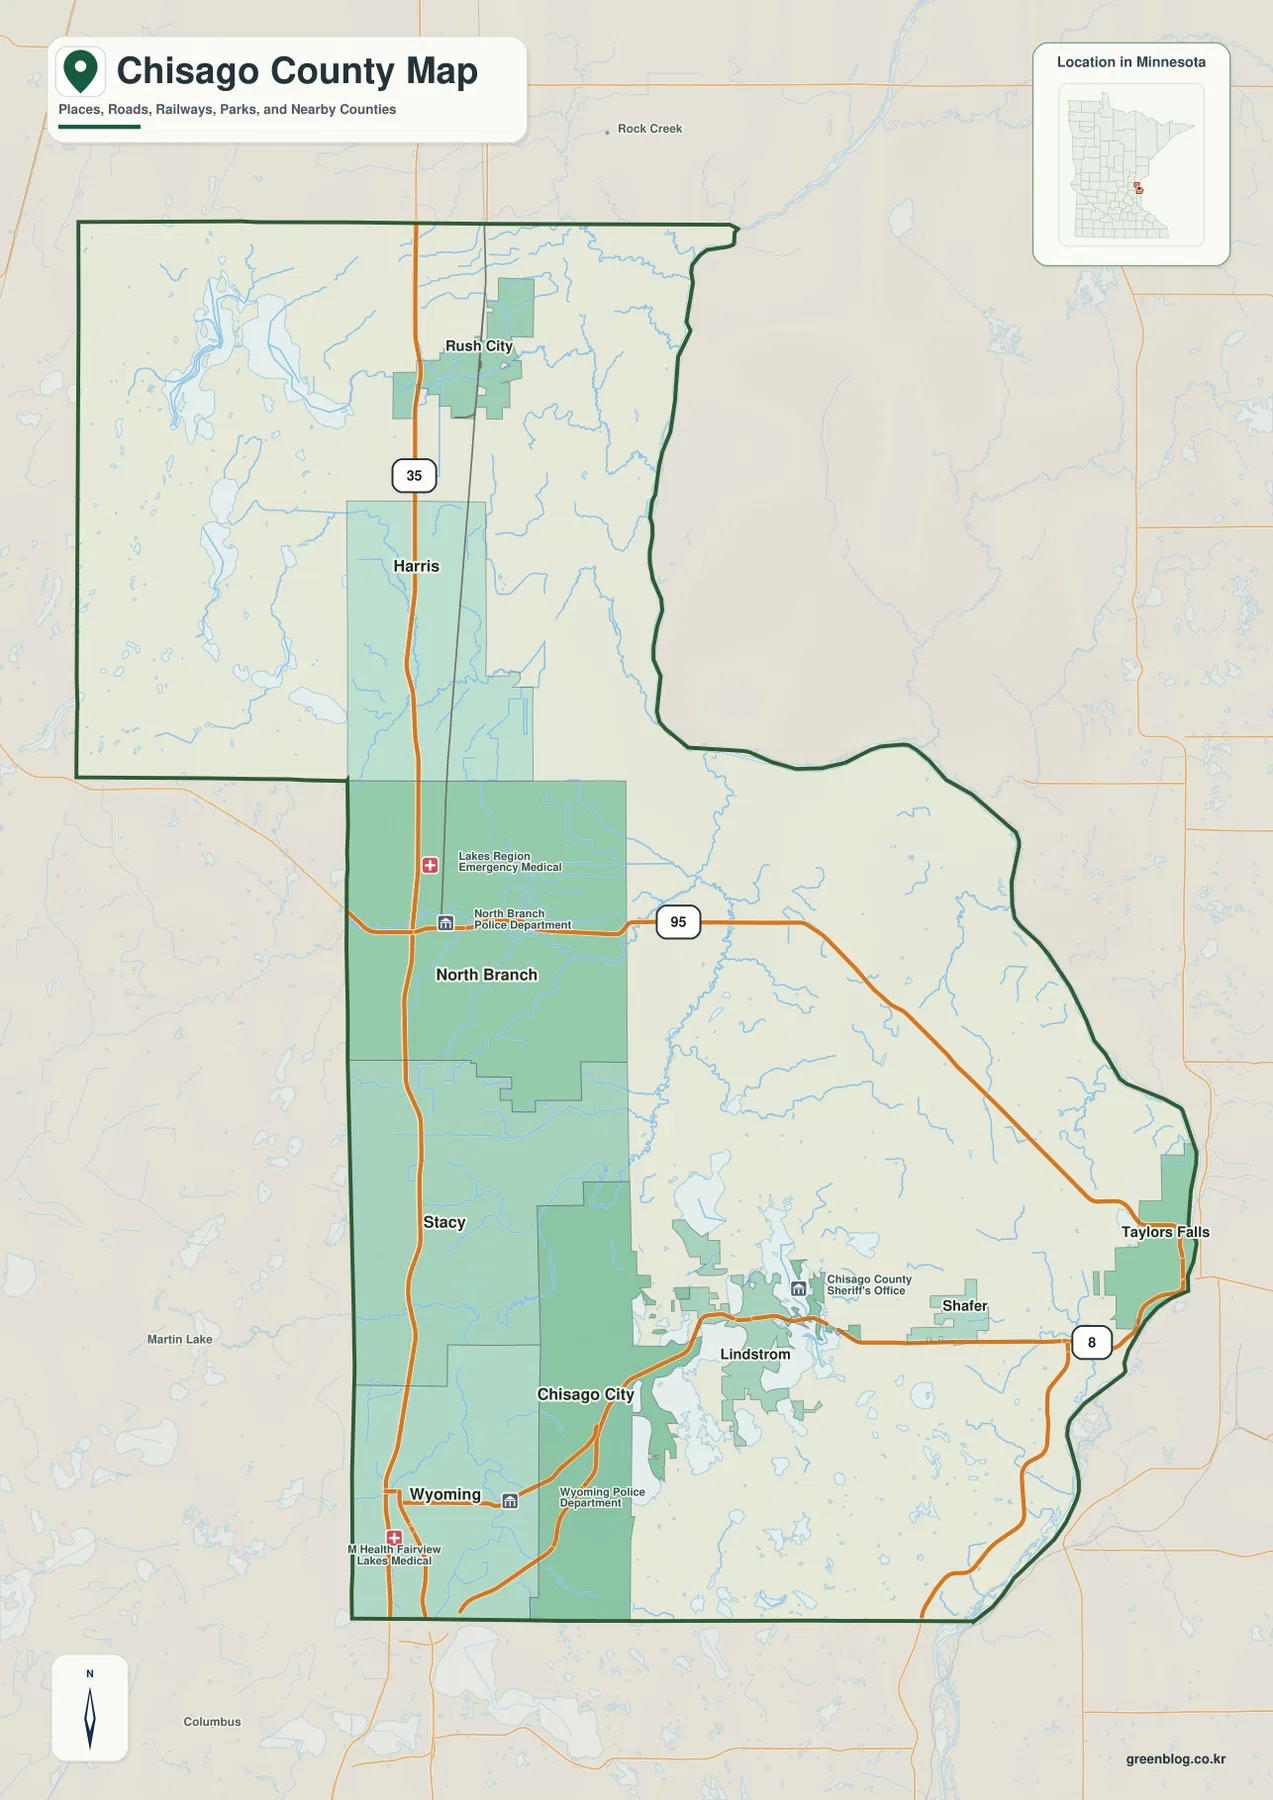
I-35 is the clearest transportation reference on the general county map. It runs south from Rush City through Harris, North Branch, Stacy, and Wyoming, tying several of the county’s larger communities to the Twin Cities corridor. Development becomes more continuous toward the south, while the Rush City end remains closely connected to lake and rural landscapes.
At North Branch, MN-95 crosses the interstate corridor and continues east toward Taylors Falls. That makes North Branch a useful central reference between the western freeway communities and the St. Croix side of the county. Harris sits to the north and Stacy to the south, so the city sequence along I-35 is easy to follow.
US-8 defines a different travel corridor in the southeast. It passes through the Chisago City–Lindstrom–Shafer area before reaching Taylors Falls. Lakes break the land into narrow passages, and the road threads between water bodies and developed areas rather than crossing an open grid.
Wyoming sits in the southwest near the I-35 corridor and local routes leading toward North Branch and Stacy. Selected public facilities are shown for orientation, but the map is not intended to replace live navigation or a detailed street atlas. I-35, MN-95, and US-8 provide the simplest framework for understanding the county’s western towns, southeastern lake communities, and eastern river edge.
Six ranked cities led by North Branch
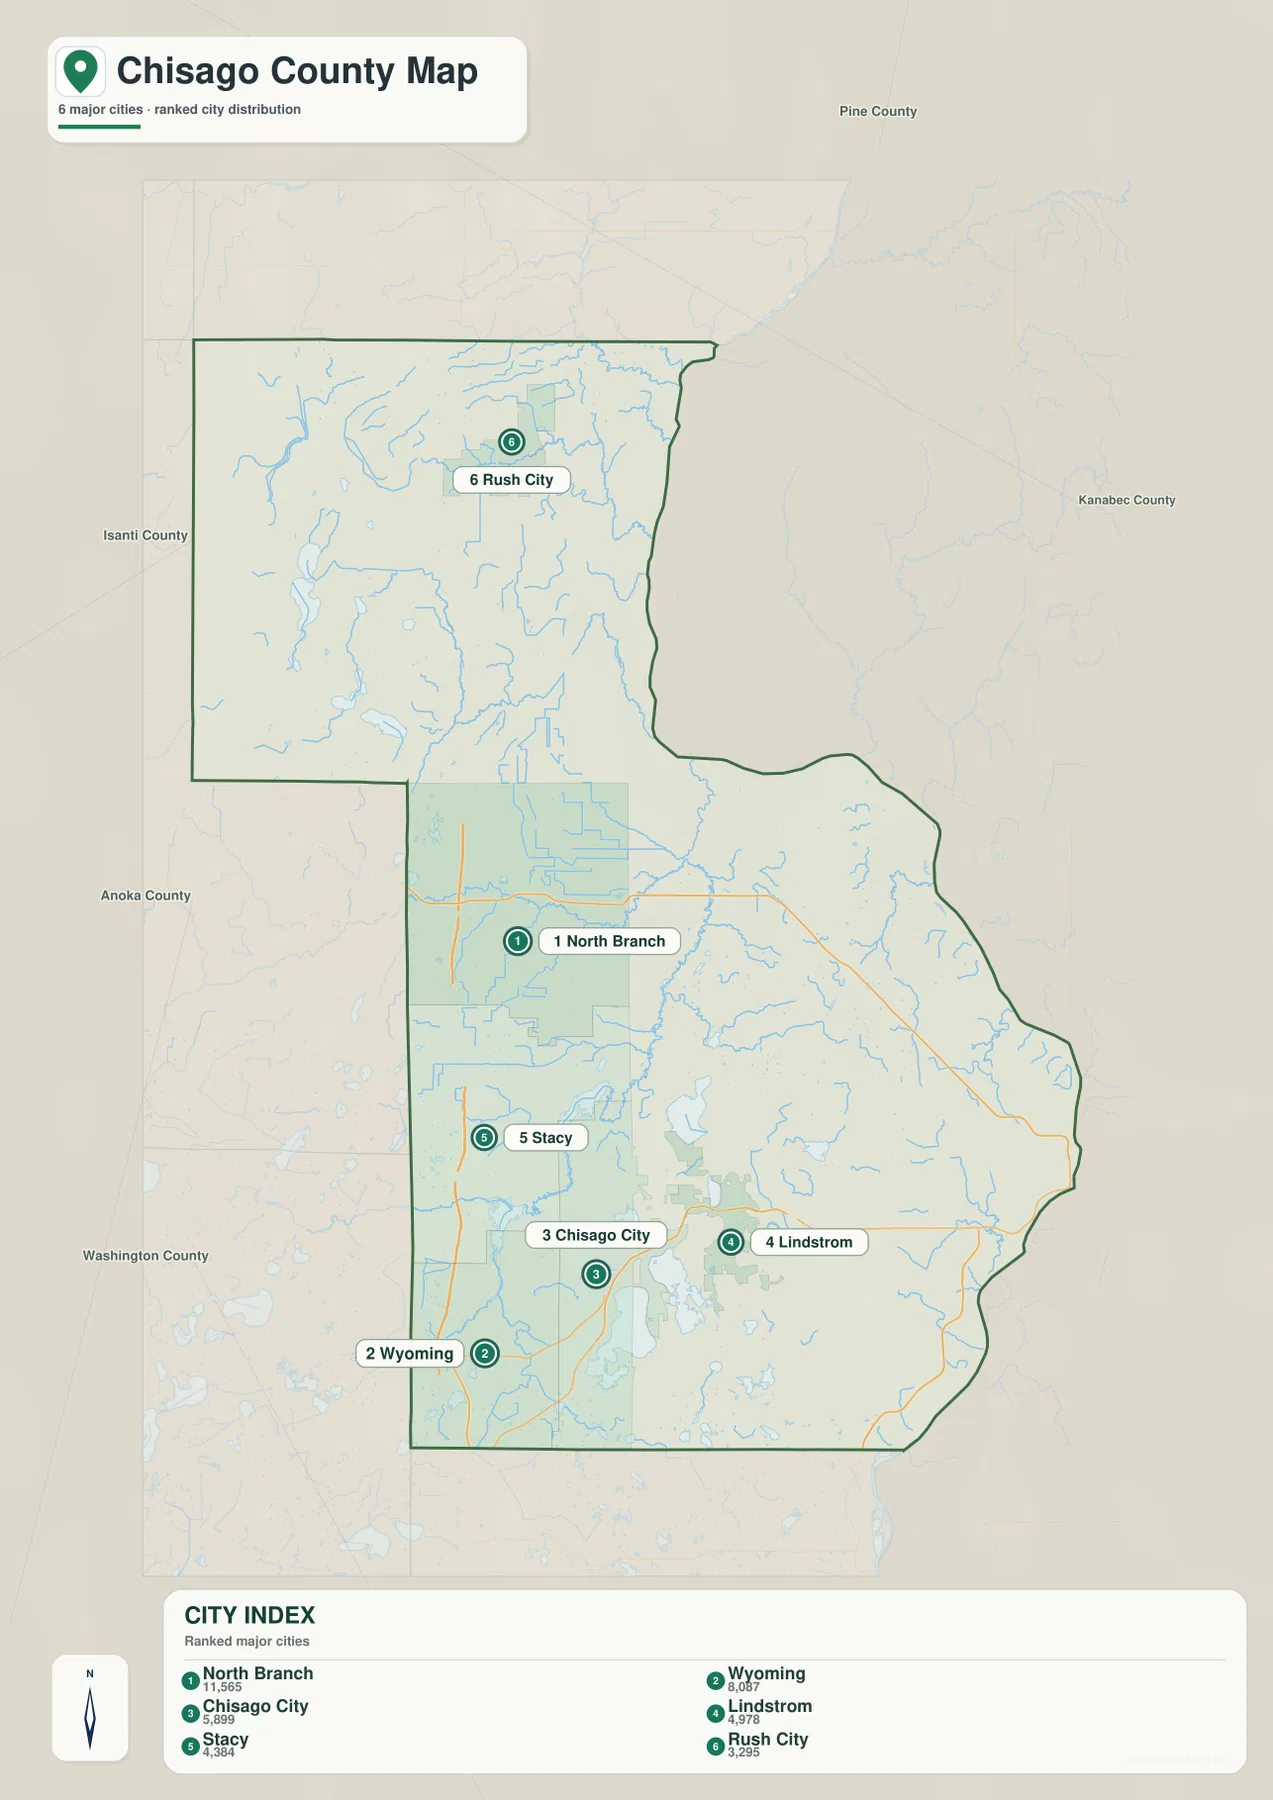
The city index ranks six selected communities. North Branch is number 1 with a printed value of 11,565, followed by Wyoming at 8,087, Chisago City at 5,899, Lindstrom at 4,978, Stacy at 4,384, and Rush City at 3,295. These values are reproduced from the supplied city-index graphic and are not presented here as newly calculated population estimates.
Their positions divide the county into two major settlement areas. Rush City, North Branch, Stacy, and Wyoming align broadly with the western I-35 corridor, while Chisago City and Lindstrom sit in the southeastern lake district. The ranking therefore adds population scale to a pattern that is already visible on the general road map.
There are no connector lines or mileage labels on this city map. It is a ranking and location graphic rather than a distance chart. Use it to compare where the six selected cities sit within the county, then refer to the general road map or a current routing service when actual driving mileage or travel time is needed.
St. Croix River, Sunrise River, and the Chisago lake chains
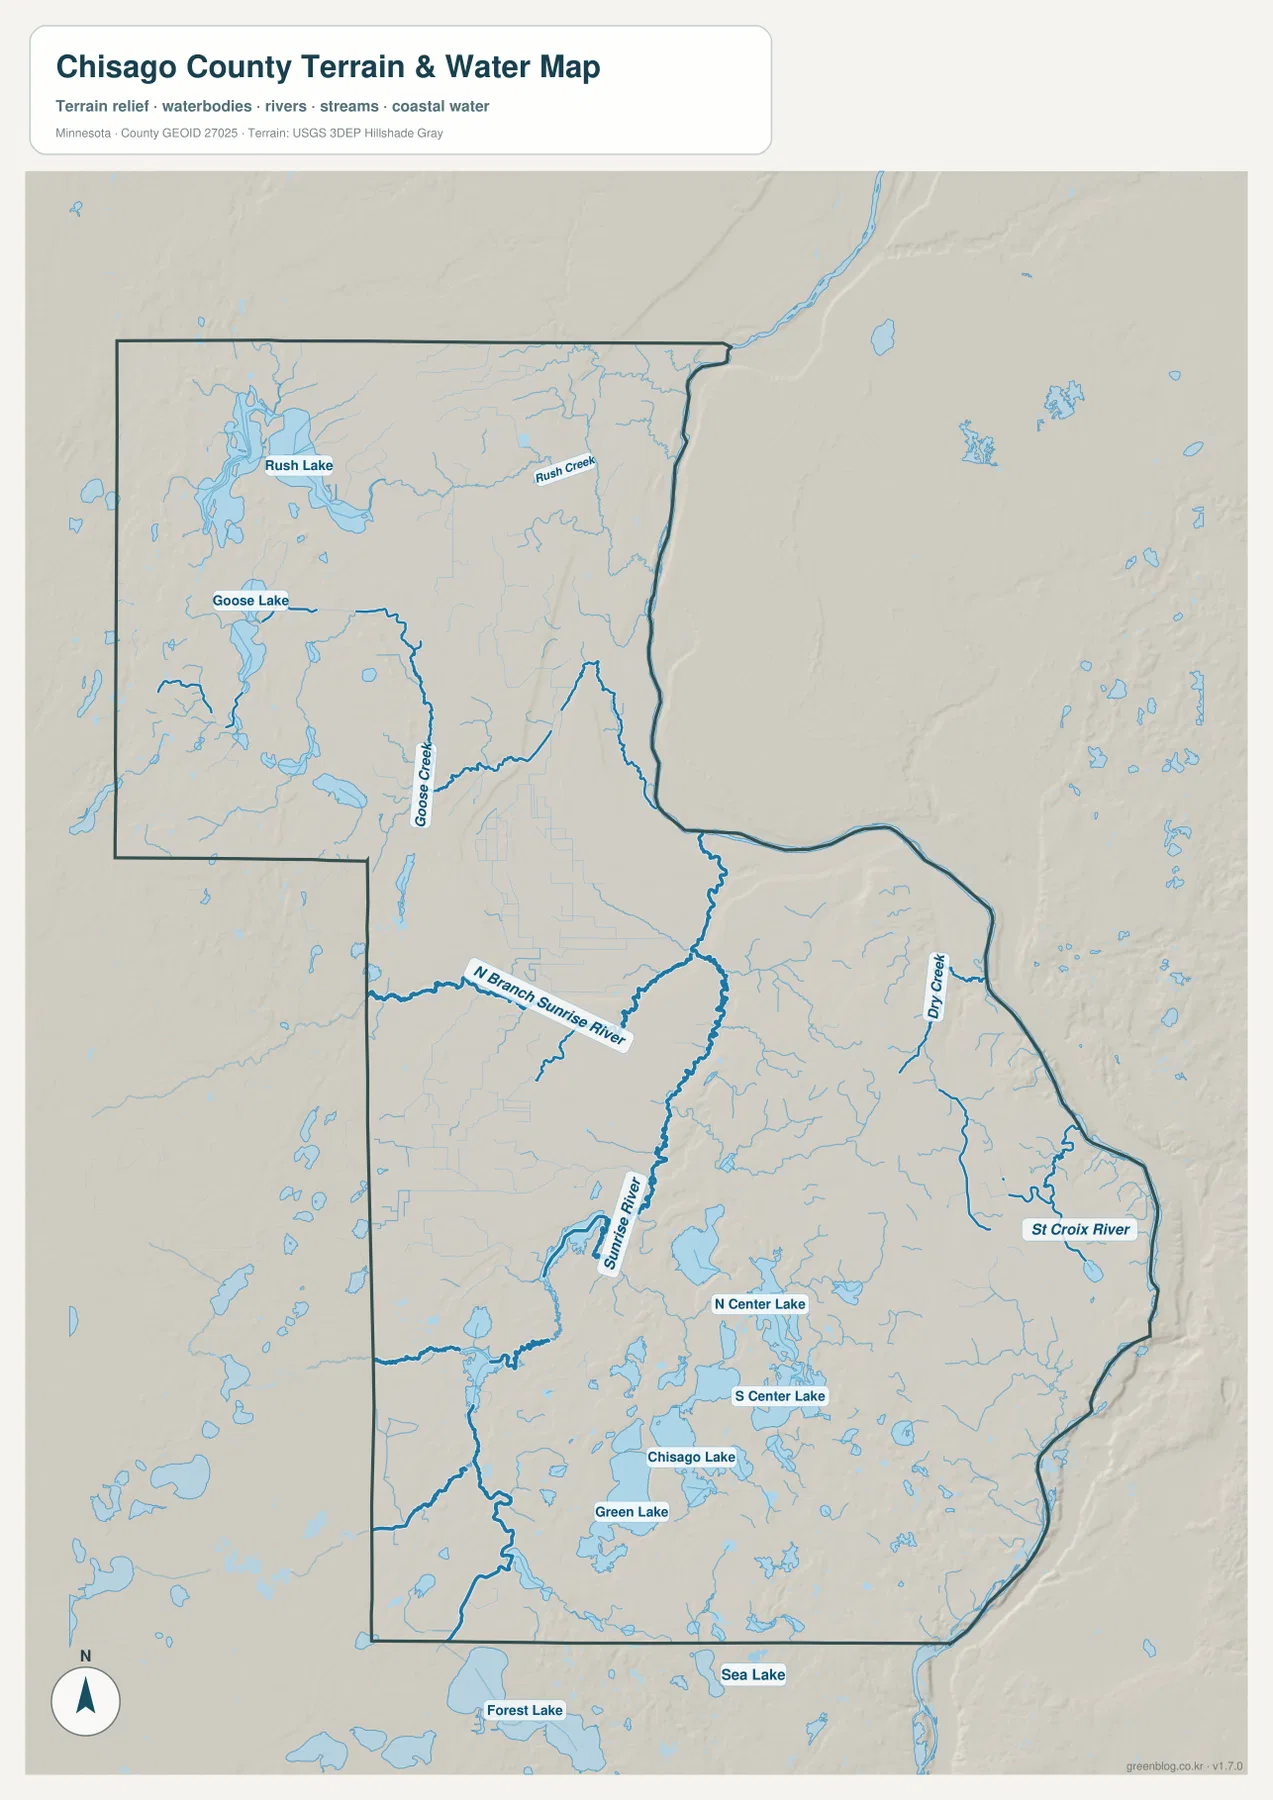
The St. Croix River is the dominant boundary waterway along the eastern side. Near Taylors Falls, the river occupies a deeply cut valley that continues south along the county edge. The elevation map reinforces that setting: the river corridor is low, while higher ridges rise immediately inland in several places.
Sunrise River forms the county’s most important interior river corridor. It runs through the broad central lowland, with North Branch Sunrise River approaching from the west. These channels help explain the large green depression visible between the western uplands and the more rugged eastern side.
Rush Lake and Goose Lake stand out in the northwest, with Rush Creek and Goose Creek crossing the surrounding lake country. This northern cluster is separate from the Chisago Lakes area in the southeast, giving the county two distinct concentrations of large inland water bodies.
The southeastern lake district includes North Center Lake, South Center Lake, Chisago Lake, and Green Lake. Chisago County planning documents describe a Chisago chain of lakes that includes Chisago, North and South Lindstrom, North and South Center, and related waters. The many narrow channels and wet lowlands around Chisago City, Lindstrom, and Center City explain why the shoreline pattern is so intricate.
Chisago County’s DNR Recreational Assets page lists public water access at Chisago Lake, Green Lake, North and South Center lakes, Rush Lake, and multiple sites on the St. Croix and Sunrise rivers. Those official access points connect the water features on the map with boating, fishing, canoeing, and other public recreation.
Use the water map for names, relative positions, and broad drainage relationships. It does not show flood probability, legal shoreline limits, navigation depth, parcel ownership, or current water conditions. Those questions require current products from the responsible public agency.
Elevation from 209 to 342 meters
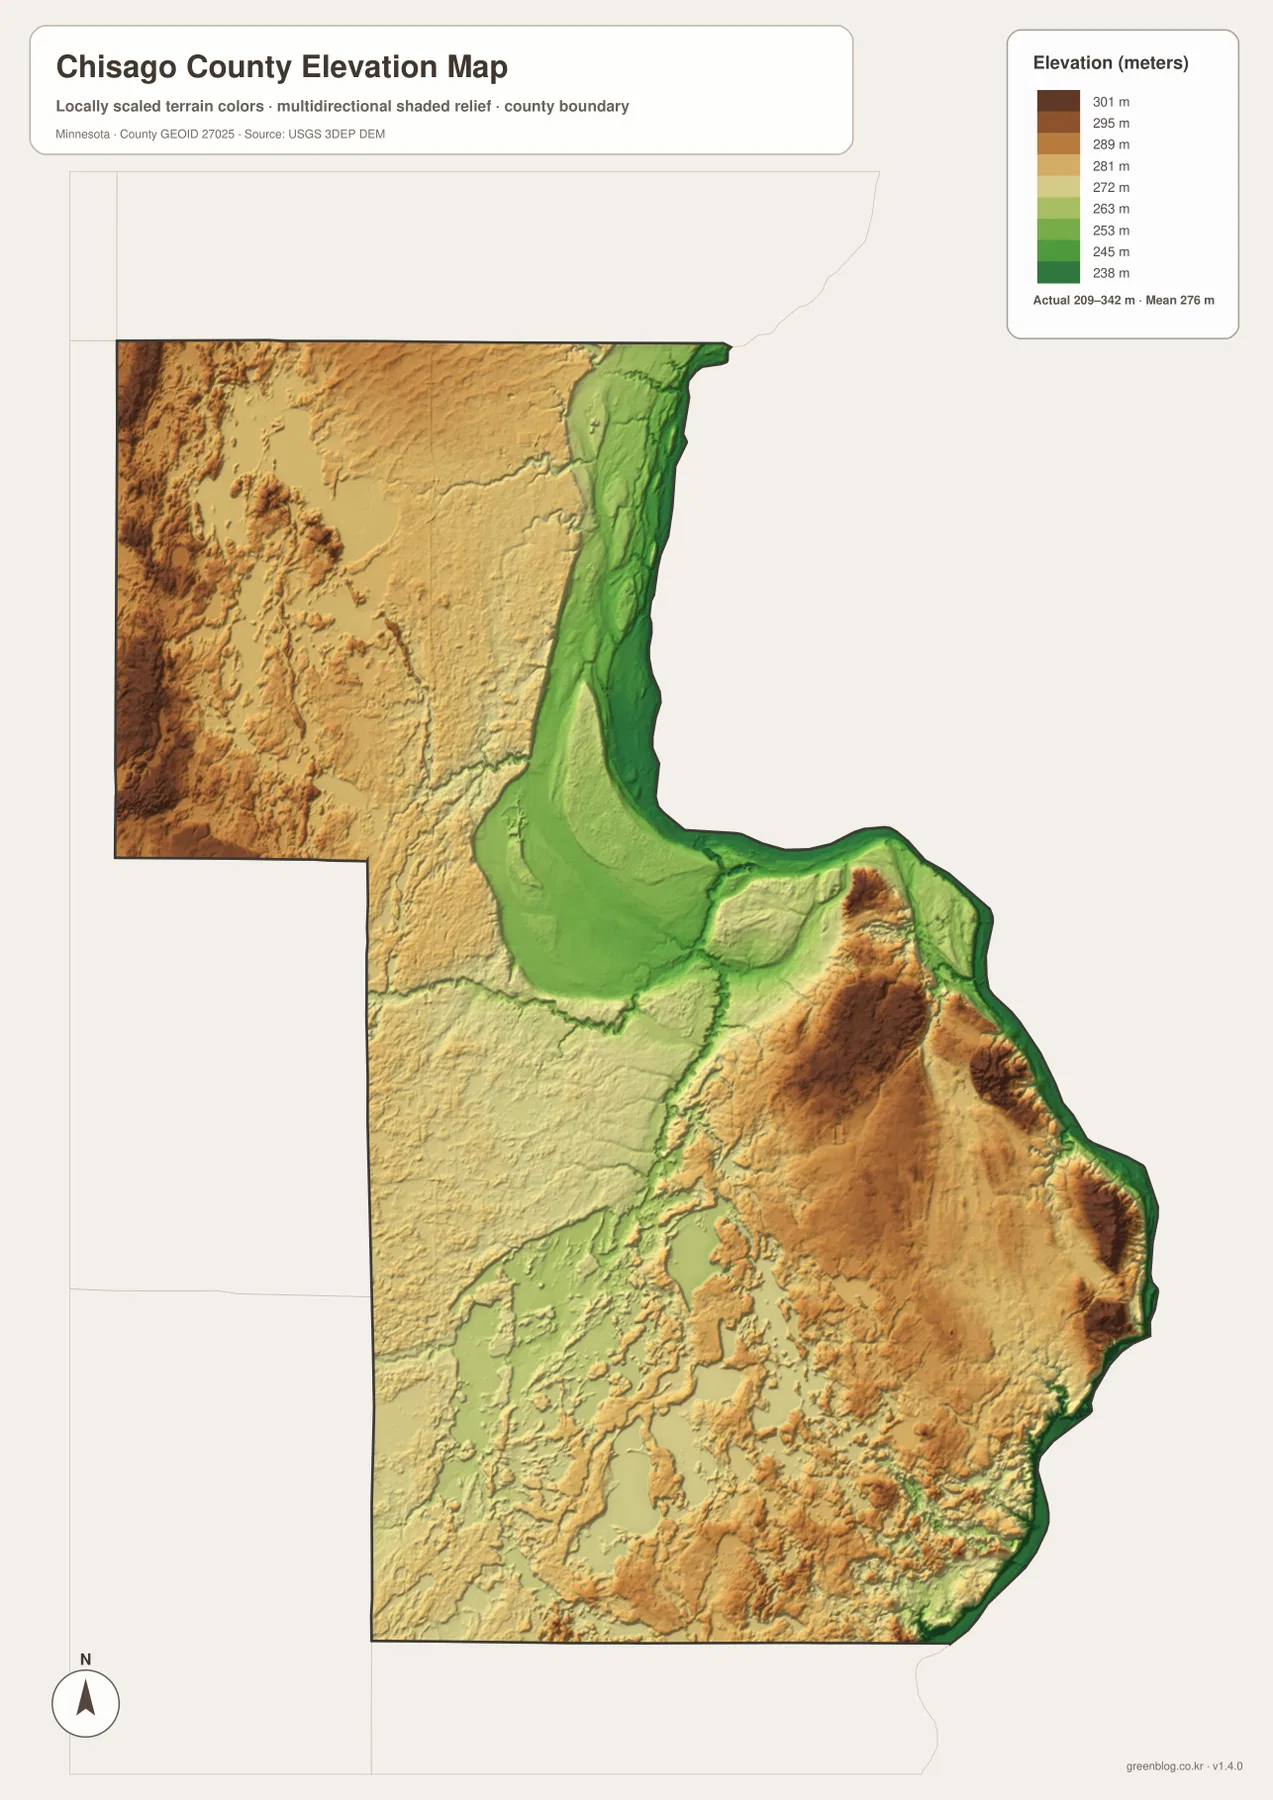
The elevation map reports an actual range of about 209 to 342 meters and a mean near 276 meters. Greens represent lower terrain, while tan and brown colors mark higher ground. The western and northwestern portions contain broad higher surfaces, while the St. Croix River and the central stream corridors occupy some of the lowest terrain.
Across the northern part of the county, elevation generally drops from the western uplands toward a broad central and eastern lowland. Sunrise River and its tributaries cross this green corridor, and the Rush Lake area contains additional low lake basins embedded within the higher surrounding land.
Farther east, isolated ridges rise sharply above the lowlands. The area west of Taylors Falls contains some of the strongest brown relief, followed by a steep descent toward the St. Croix River. In the south, the Chisago Lakes district mixes low lake basins with short rolling ridges, producing a much more irregular surface than a flat suburban plain.
The county-wide difference is roughly 133 meters. That is not mountain-scale relief, but it clearly distinguishes the western uplands, Sunrise River lowland, St. Croix valley, and southeastern lake basins. This surface is intended for broad terrain comparison rather than survey-grade measurement; precise construction, drainage, engineering, or site work requires more detailed official elevation data and field verification.
North Branch, Lindstrom, and Taylors Falls show three different settings
North Branch represents the western transportation corridor. I-35 and MN-95 provide the strongest road references, with Rush City, Harris, and Stacy aligned along the same broad north–south route. The Sunrise River system cuts across this road-oriented landscape through lower ground.
Lindstrom and Chisago City occupy the lake-centered southeast. US-8 connects the communities, while Chisago Lake, North and South Center lakes, Green Lake, and nearby channels break the land into small ridges and low basins. The elevation map confirms that this is a rolling lake landscape rather than a completely flat suburban zone.
Taylors Falls represents the eastern river-valley edge. MN-95 and US-8 approach the St. Croix River, and the terrain drops sharply from inland ridges toward the river corridor. Comparing all four maps makes the county’s transition from I-35 towns to lake country and finally to the St. Croix valley much easier to understand.
Chisago County Parks & Trails maintains regional trail resources including the Sunrise Prairie Regional Trail and developing Swedish Immigrant Regional Trail segments. The map set works well for general county orientation, school assignments, local-history presentations, and trip preparation, but parcel, flood, legal-boundary, and live road questions should be checked with current official sources.
Frequently Asked Questions
Which maps best show the difference between North Branch and Chisago City?
Start with the general county map for roads and locations, then compare the water map. North Branch sits on the I-35 and MN-95 corridor, while Chisago City is in the southeastern lake district surrounded by several connected lakes and channels.
Are the city-index values current population estimates?
The values described here are the numbers printed in the supplied city-index graphic. For the latest population figures, use current U.S. Census Bureau or Chisago County statistics rather than treating the map values as a new estimate.
Can the 209–342 meter elevation range be used for engineering or surveying?
No. The elevation layer is suitable for broad comparison of higher and lower terrain, but precise construction, drainage, engineering, or survey work requires more detailed official elevation data and field verification.
Map File Information
A ZIP containing the high-resolution A3 JPG originals for the Chisago County map, city index, water map, and elevation map.
- Included Files: county map, city index map, water map, elevation map
- File Type: JPG
Related Maps
Sources and references
- U.S. Census Bureau TIGER/Line Shapefiles – official geographic files for county boundaries, roads, and place references.
- USGS National Hydrography – federal source for rivers, streams, lakes, and other hydrographic features.
- USGS 3D Elevation Program – official U.S. elevation and terrain data resources.
- Chisago County Parks & Trails – official information about county parks and the Sunrise Prairie and Swedish Immigrant regional trails.
- Chisago County DNR Recreational Assets – official local listing of water accesses on Chisago County lakes and the St. Croix and Sunrise rivers.
- Chisago Lakes Channel & Weir System – official information about connections among the Chisago Lakes and drainage toward the Sunrise River.
Green Map creates custom-edited map images using open geographic data sources such as geoBoundaries, Natural Earth, OpenStreetMap, and government open data. These maps are edited visual materials, not raw data files, and are provided for education, documents, presentations, and graphic reference.