World Bank data for 2024 show an exceptionally wide distribution in new business density, measured as new limited-liability company registrations per 1,000 people ages 15–64. Across 134 reporting countries and economies, the simple mean is 6.87 and the median is 2.61. The Cayman Islands record 201.01, far above the Isle of Man at 33.58, Hong Kong SAR, China at 28.85, Estonia at 26.76 and the Turks and Caicos Islands at 23.74.
The first quartile is 1.02 and the third quartile 7.07, so the middle half of the observed values lies roughly between those two levels. The maximum of 201.01 is an extreme outlier and lifts the arithmetic mean well above the median. This makes the median and the distribution bands more useful than the mean alone for describing a typical reporting economy.
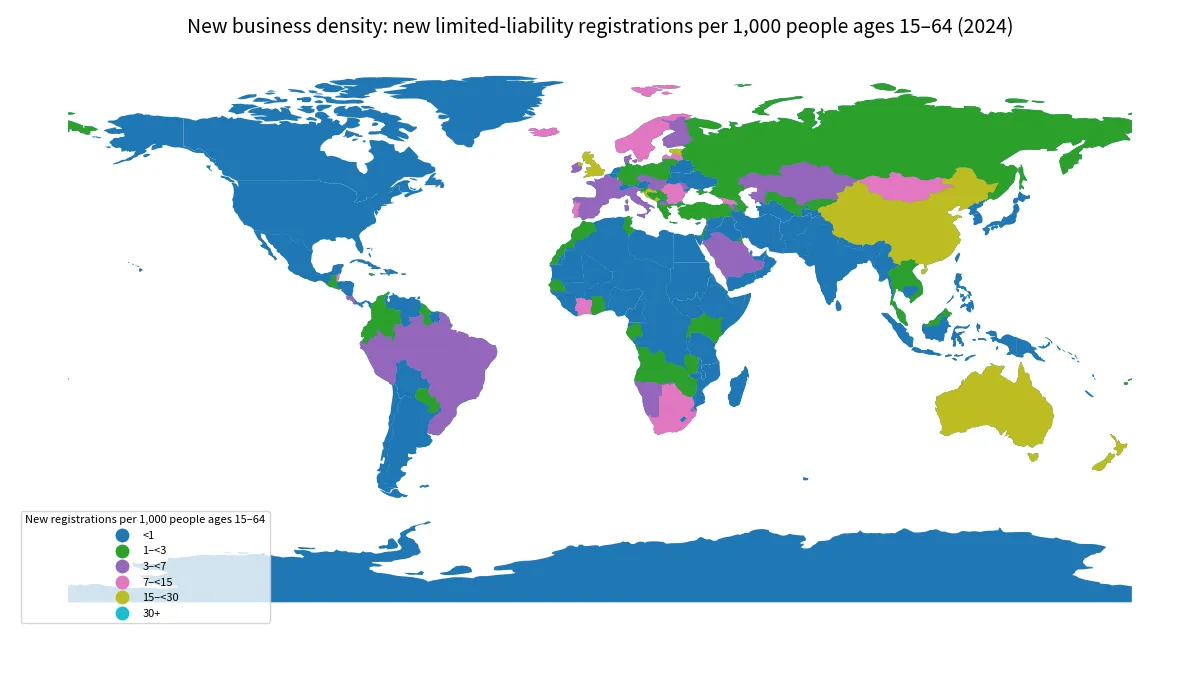
Table of Contents
What new business density actually measures
IC.BUS.NDNS.ZS measures newly registered limited-liability companies per 1,000 people ages 15–64. It is therefore a formal business-registration indicator rather than a complete count of all entrepreneurial activity. The numerator is new limited-liability registrations and the denominator is the working-age population used by the indicator.
Sole proprietorships, informal businesses, self-employment and other legal forms may not be represented in the same way. A new registration also says nothing by itself about whether the company survives, hires workers, generates revenue or innovates. The indicator is best read as the density of formal limited-liability business entry.
The Cayman Islands are an extreme outlier
The Cayman Islands record 201.01 new registrations per 1,000 people ages 15–64. That is about 6.0 times the Isle of Man value of 33.58 and far above the overall median of 2.61. A small population denominator can produce a very high density when registrations are numerous relative to the resident working-age population.
Because this outlier would compress a linear map scale, the map uses six actual-value bands: below 1, 1 to below 3, 3 to below 7, 7 to below 15, 15 to below 30, and 30 or more. The complete table retains the exact reported values so the categorical map does not replace the underlying data.
The upper group mixes small jurisdictions with larger economies
The upper observations include the Isle of Man at 33.58, Hong Kong SAR, China at 28.85, Estonia at 26.76, the Turks and Caicos Islands at 23.74, Cabo Verde at 21.76, Luxembourg at 19.61, the United Kingdom at 19.19, Australia at 18.06 and China at 15.59. The high-density group therefore does not belong to one geographic region or one economy size.
25 observations are at 10 or more registrations per 1,000 people ages 15–64, while only 6 are at 20 or more. At the other end, 33 observations are below 1. The top ten observations average 41.32, compared with only 0.104 for the bottom ten.
The 2.61 median is more representative than the 6.87 mean
The simple mean of 6.87 is 4.26 registrations above the median of 2.61. The 90th percentile is 15.59 and the 95th percentile 19.73, showing how quickly the upper tail separates from the rest of the sample. A typical observation is therefore much closer to the median than to the Cayman Islands value.
This is a common issue with density indicators. When the denominator is population and the numerator can be concentrated in a registration centre, a small number of jurisdictions can strongly influence the mean. Reporting the median, quartiles and full distribution gives a more balanced picture.
Regional medians differ, but within-region variation remains large
Among observations matched to the map boundary, Africa has 36 countries with a median of 1.01; Asia has 27 with 2.00; Europe has 32 with 5.83; and South America has 8 with 2.56. These are unweighted country medians, not population-weighted regional rates.
The variation inside regions is at least as important as the regional differences. Registration procedures, legal forms, digital incorporation systems, access to finance, business structure and informality can all be related to formal entry, but the density indicator alone cannot identify which factor causes a country’s level.
Large economies can also record high formal business entry density
China records 15.59, Australia 18.06 and the United Kingdom 19.19. Singapore is at 11.59, South Africa 11.46 and Portugal 11.00. High new business density is therefore not confined to small registration jurisdictions.
The rate should still be separated from the absolute number of new companies. A large economy can have many more registrations in total even with a lower density because its 15–64 population is much larger. Density answers how common new registrations are relative to the working-age population; absolute registrations answer a different question.
At the lower end, some economies are below 0.1 per 1,000
Somalia records 0.020, Liberia about 0.052, Bangladesh 0.065, the Central African Republic about 0.099 and Niger about 0.100. India is at 0.175 and Pakistan at 0.202. These values indicate low formal limited-liability registration density, not an absence of all new economic activity.
Countries with large informal sectors or different preferred legal forms can have business activity that is not captured by this measure in the same way. New business density should therefore be used within its formal-registration definition rather than as a universal measure of entrepreneurship.
All 134 reported observations for 2024
The table lists the 134 countries and economies with a reported 2024 value, ordered from highest to lowest. The 83 source-missing rows are not converted to zero. Missing data and genuinely low registration density remain separate states.
| Rank | Country or economy | New registrations per 1,000 ages 15–64 |
|---|---|---|
| 1 | Cayman Islands | 201.01 |
| 2 | Isle of Man | 33.58 |
| 3 | Hong Kong SAR China | 28.85 |
| 4 | Estonia | 26.76 |
| 5 | Turks & Caicos Islands | 23.74 |
| 6 | Cape Verde | 21.76 |
| 7 | U.S. Virgin Islands | 19.96 |
| 8 | Luxembourg | 19.61 |
| 9 | United Kingdom | 19.19 |
| 10 | St. Kitts & Nevis | 18.72 |
| 11 | Australia | 18.06 |
| 12 | Montenegro | 17.86 |
| 13 | New Zealand | 16.05 |
| 14 | China | 15.59 |
| 15 | Liechtenstein | 15.57 |
| 16 | Nauru | 15.23 |
| 17 | Croatia | 15.21 |
| 18 | Mauritius | 13.98 |
| 19 | Botswana | 13.33 |
| 20 | Belize | 13.01 |
| 21 | Singapore | 11.59 |
| 22 | South Africa | 11.46 |
| 23 | Portugal | 11.00 |
| 24 | Iceland | 10.86 |
| 25 | Bulgaria | 10.46 |
| 26 | Malta | 8.47 |
| 27 | Kosovo | 8.35 |
| 28 | Norway | 8.32 |
| 29 | Côte d’Ivoire | 8.28 |
| 30 | Mongolia | 8.26 |
| 31 | Barbados | 8.11 |
| 32 | Georgia | 7.62 |
| 33 | Romania | 7.47 |
| 34 | Sweden | 7.08 |
| 35 | Latvia | 7.02 |
| 36 | Denmark | 6.85 |
| 37 | France | 6.82 |
| 38 | Namibia | 6.74 |
| 39 | Brazil | 6.67 |
| 40 | Ireland | 6.65 |
| 41 | Costa Rica | 6.31 |
| 42 | Bahrain | 6.16 |
| 43 | Finland | 5.97 |
| 44 | Slovakia | 5.68 |
| 45 | Saudi Arabia | 5.46 |
| 46 | North Macedonia | 5.18 |
| 47 | Peru | 4.90 |
| 48 | Moldova | 4.89 |
| 49 | Eswatini | 4.39 |
| 50 | Czechia | 4.31 |
| 51 | Seychelles | 4.26 |
| 52 | Antigua & Barbuda | 4.16 |
| 53 | Armenia | 4.12 |
| 54 | Hungary | 3.83 |
| 55 | Dominica | 3.73 |
| 56 | Spain | 3.67 |
| 57 | Kazakhstan | 3.35 |
| 58 | Uruguay | 3.23 |
| 59 | Italy | 3.09 |
| 60 | Israel | 2.92 |
| 61 | Guyana | 2.90 |
| 62 | Uzbekistan | 2.79 |
| 63 | Zimbabwe | 2.77 |
| 64 | Rwanda | 2.72 |
| 65 | Fiji | 2.70 |
| 66 | Morocco | 2.66 |
| 67 | Slovenia | 2.62 |
| 68 | Jamaica | 2.60 |
| 69 | Greece | 2.45 |
| 70 | Malaysia | 2.38 |
| 71 | Poland | 2.38 |
| 72 | Albania | 2.29 |
| 73 | Russia | 2.28 |
| 74 | Colombia | 2.22 |
| 75 | Kyrgyzstan | 2.15 |
| 76 | Kuwait | 2.14 |
| 77 | Lithuania | 2.13 |
| 78 | Serbia | 2.12 |
| 79 | Cyprus | 2.08 |
| 80 | Azerbaijan | 2.00 |
| 81 | Vietnam | 2.00 |
| 82 | Türkiye | 1.98 |
| 83 | Tunisia | 1.82 |
| 84 | Paraguay | 1.76 |
| 85 | Thailand | 1.75 |
| 86 | Kenya | 1.73 |
| 87 | Bosnia & Herzegovina | 1.64 |
| 88 | Ecuador | 1.59 |
| 89 | Gabon | 1.57 |
| 90 | Laos | 1.57 |
| 91 | Angola | 1.55 |
| 92 | Zambia | 1.50 |
| 93 | Germany | 1.44 |
| 94 | Gambia | 1.40 |
| 95 | Ghana | 1.37 |
| 96 | Senegal | 1.22 |
| 97 | El Salvador | 1.14 |
| 98 | Uganda | 1.08 |
| 99 | St. Lucia | 1.06 |
| 100 | Togo | 1.04 |
| 101 | Guatemala | 1.02 |
| 102 | Burundi | 0.98 |
| 103 | Mexico | 0.95 |
| 104 | Indonesia | 0.94 |
| 105 | Mauritania | 0.83 |
| 106 | Algeria | 0.83 |
| 107 | Burkina Faso | 0.77 |
| 108 | Comoros | 0.76 |
| 109 | Sierra Leone | 0.73 |
| 110 | Tonga | 0.70 |
| 111 | Benin | 0.69 |
| 112 | Guinea | 0.69 |
| 113 | Djibouti | 0.68 |
| 114 | Jordan | 0.67 |
| 115 | Ethiopia | 0.61 |
| 116 | Japan | 0.58 |
| 117 | Argentina | 0.52 |
| 118 | Philippines | 0.51 |
| 119 | Brunei | 0.47 |
| 120 | Guinea-Bissau | 0.47 |
| 121 | Cambodia | 0.45 |
| 122 | Congo – Brazzaville | 0.40 |
| 123 | Honduras | 0.37 |
| 124 | Pakistan | 0.20 |
| 125 | India | 0.18 |
| 126 | Palestinian Territories | 0.17 |
| 127 | Chad | 0.13 |
| 128 | Madagascar | 0.12 |
| 129 | Congo – Kinshasa | 0.11 |
| 130 | Niger | 0.10 |
| 131 | Central African Republic | 0.10 |
| 132 | Bangladesh | 0.06 |
| 133 | Liberia | 0.05 |
| 134 | Somalia | 0.02 |
Coverage gaps matter for the interpretation
The source contains 217 country and economy rows, but only 134 have a 2024 observation. The remaining 83 are source-missing, so this is a comparison among reporting economies rather than a complete worldwide ranking.
The low-resolution map displays 113 of the reported observations. The other 21, mostly small islands and territories, remain in the table and summary statistics. A blank map area does not mean zero new business density.
Source and indicator definition
The source is World Bank indicator IC.BUS.NDNS.ZS, “New business density (new registrations per 1,000 people ages 15-64),” for 2024. It measures newly registered limited-liability companies per 1,000 people ages 15–64. The mean, median, quartiles and ranking here are calculated from the 134 reported observations, with 83 missing rows preserved as missing.
Frequently Asked Questions
What does new business density measure?
It measures newly registered limited-liability companies per 1,000 people ages 15–64. It is not a complete measure of all entrepreneurship or self-employment.
What are the 2024 median and mean?
Across the 134 reported observations, the median is 2.61 and the simple mean is 6.87 per 1,000 people ages 15–64.
Can this indicator alone explain the Cayman Islands outlier?
No. A small working-age population combined with many registrations can produce a high density, but the specific institutional and business reasons require additional evidence.
Are missing values treated as zero?
No. The 83 source-missing rows remain missing and are excluded from the mean and ranking.
Related Articles
Green Map creates custom-edited map images using open geographic data sources such as geoBoundaries, Natural Earth, OpenStreetMap, and government open data. These maps are edited visual materials, not raw data files, and are provided for education, documents, presentations, and graphic reference.