The share of firms offering formal training to permanent, full-time employees differs dramatically across economies. World Bank indicator IC.FRM.TRNG.ZS provides one latest non-empty observation for each of 181 countries and territories. Across those observations, the median is 32.07% and the simple mean is 32.52%. China has the highest latest value at 79.12% in 2024, followed by Papua New Guinea at 75.09% in 2024 and Czechia at 73.87% in 2025. Saudi Arabia is lowest at 1.42% in 2025.
The indicator is a firm-level percentage. It does not measure the percentage of workers who received training, the number of training hours, or the quality of instruction. A value of 50% means that half of surveyed firms report offering formal training programs for their permanent, full-time employees. It does not mean that half of all employees in the economy were trained.
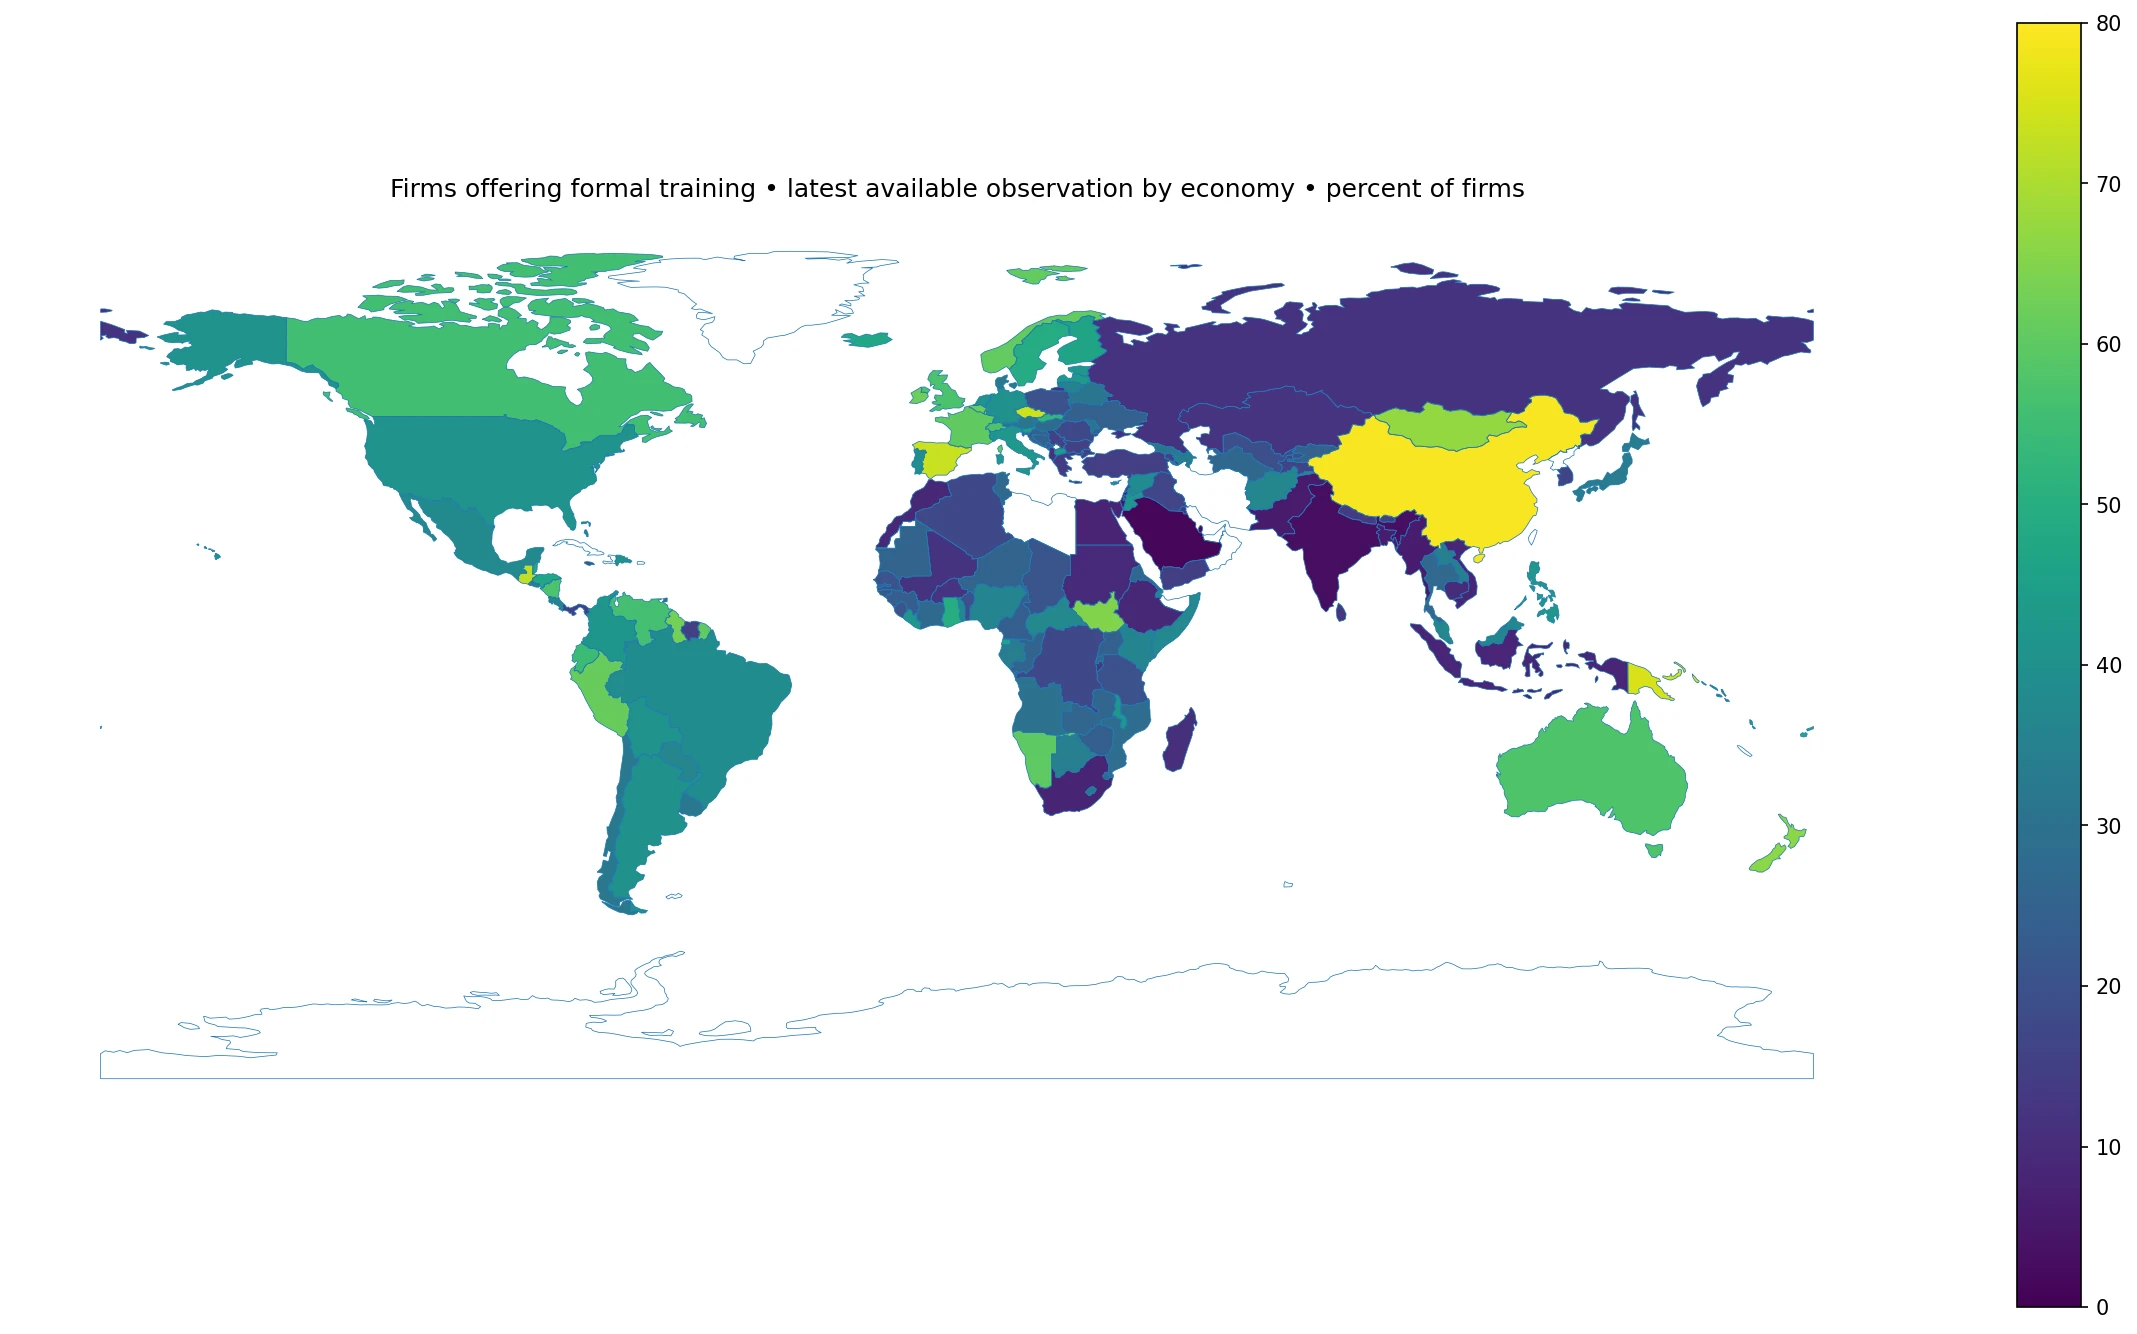
Table of Contents
The median latest observation is 32.07%
The first quartile is 18.89% and the third quartile is 42.43%, so the middle half of economies lies between roughly 18.9% and 42.4%. Twenty-seven observations are at least 50%, while 17 are below 10%. The global spread is therefore wide, but a large share of economies cluster in the 20% to 40% range.
The mean and median are unweighted descriptive statistics across economies. They are not a World Bank estimate of the percentage of all firms worldwide that offer training. A very large economy and a small island economy each contribute one observation to this calculation, so the figures describe the country distribution rather than the global firm population.
The highest latest observations reach 60% to 80%
| Country or territory | Observation year | Firms offering formal training |
|---|---|---|
| China | 2024 | 79.12% |
| Papua New Guinea | 2024 | 75.09% |
| Czechia | 2025 | 73.87% |
| Spain | 2024 | 73.36% |
| Guatemala | 2025 | 72.22% |
| Malta | 2024 | 68.83% |
| Mongolia | 2025 | 67.01% |
| Luxembourg | 2020 | 66.14% |
| New Zealand | 2023 | 66.05% |
| South Sudan | 2024 | 64.92% |
China leads at 79.12% in 2024, and Papua New Guinea follows at 75.09% in the same year. Czechia reaches 73.87% in 2025, Spain 73.36% in 2024, and Guatemala 72.22% in 2025. Malta records 68.83% in 2024, Mongolia 67.01% in 2025, Luxembourg 66.14% in 2020, New Zealand 66.05% in 2023, and South Sudan 64.92% in 2024.
The top group spans Europe, Asia, Oceania, Central America, and Africa. That diversity is a reminder that a high training share cannot be explained by one regional characteristic. Industry structure, firm size, technology use, labor-market institutions, and survey composition may all matter. The country value alone does not identify which mechanism is responsible.
The lowest observations fall below 10%
| Country or territory | Observation year | Firms offering formal training |
|---|---|---|
| Saudi Arabia | 2025 | 1.42% |
| Qatar | 2025 | 2.59% |
| India | 2025 | 2.88% |
| Pakistan | 2022 | 5.90% |
| Israel | 2024 | 5.92% |
| Myanmar | 2016 | 5.94% |
| Bangladesh | 2022 | 6.42% |
| Egypt, Arab Rep. | 2025 | 7.72% |
| South Africa | 2020 | 7.90% |
| Timor-Leste | 2021 | 8.11% |
Saudi Arabia has the lowest latest value at 1.42% in 2025. Qatar follows at 2.59%, India at 2.88%, Pakistan at 5.90% in 2022, Israel at 5.92% in 2024, and Myanmar at 5.94% in 2016. Bangladesh records 6.42% in 2022, Egypt 7.72% in 2025, South Africa 7.90% in 2020, and Timor-Leste 8.11% in 2021.
A low value does not mean workers receive almost no skills development. Firms may rely on informal on-the-job learning, external training providers, vendor instruction, professional associations, or employee-initiated courses. The indicator captures whether the surveyed firm offers a formal program meeting the survey definition, not every route through which workers can learn.
Most observations are recent, but they are not synchronized
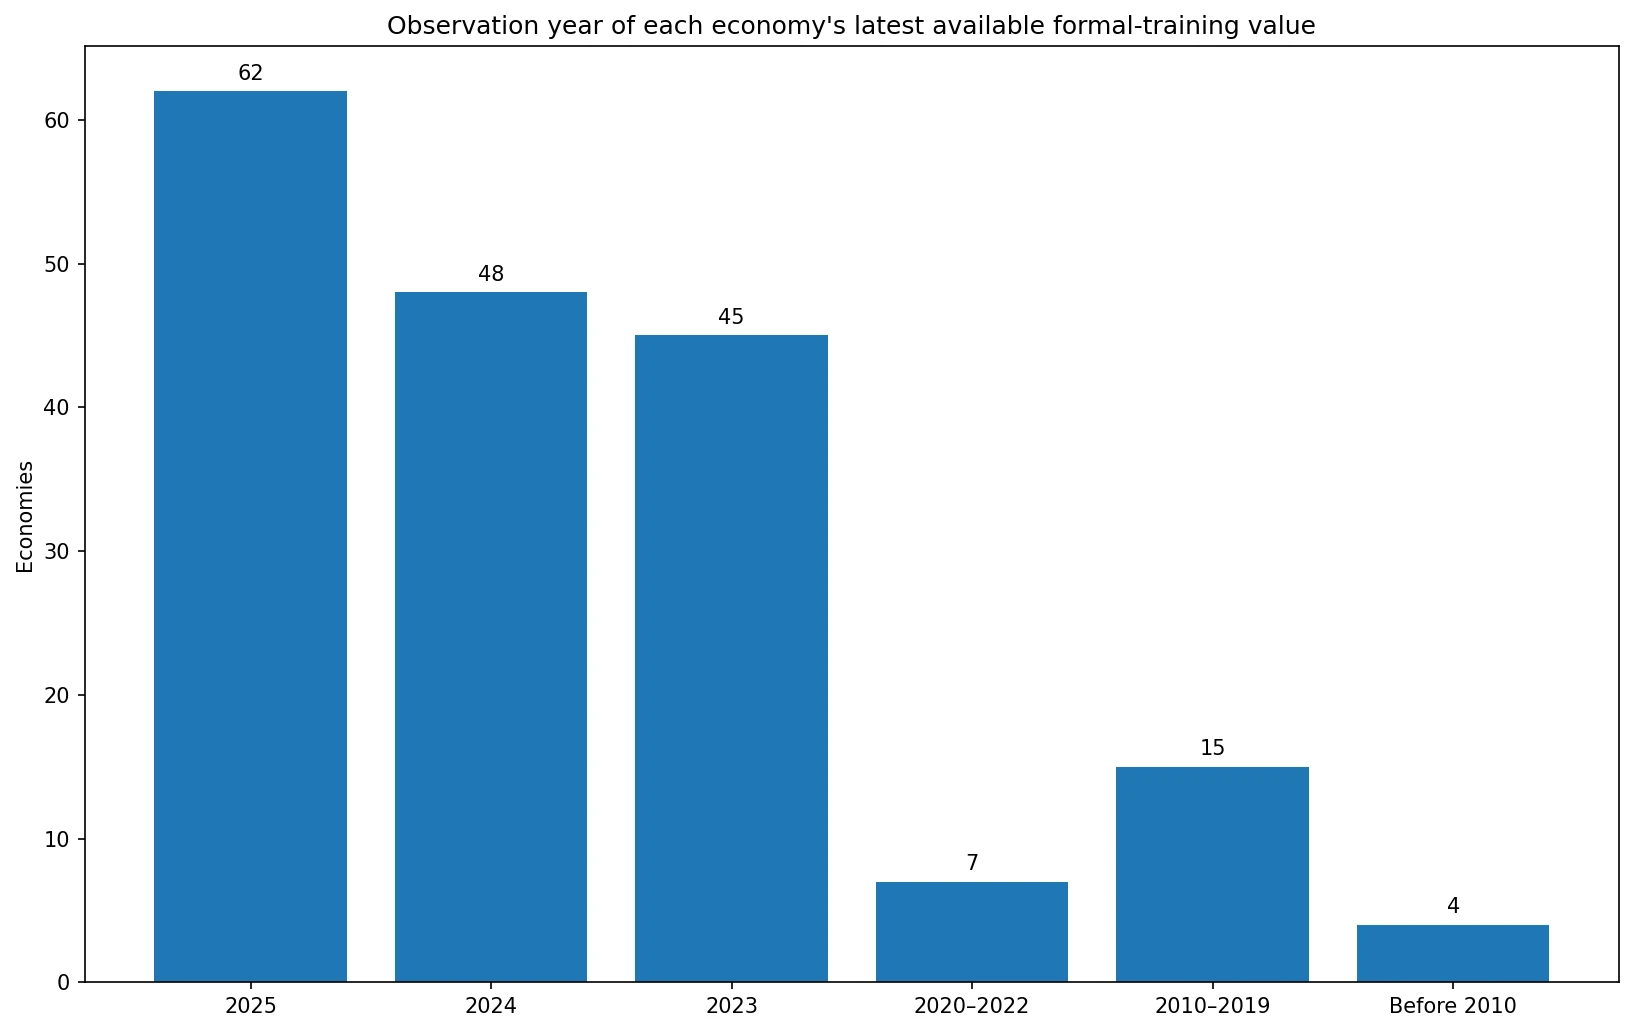
Of the 181 latest observations, 62 are from 2025, 48 from 2024, and 45 from 2023. Together, 155 observations—or 85.6%—come from 2023 through 2025. Another seven are from 2020–2022, 15 from 2010–2019, and four are from before 2010. The oldest latest observation in the dataset is from 2007.
This concentration in recent years makes the map more contemporary than many latest-available global datasets, but it is still not a same-year ranking. A country observed in 2016 may have changed substantially since then. Direct comparisons are strongest when the observation years are close.
The 2025 subset provides a same-year comparison for 62 economies
| Country or territory | 2025 firms offering formal training |
|---|---|
| Czechia | 73.87% |
| Guatemala | 72.22% |
| Mongolia | 67.01% |
| Belgium | 62.00% |
| Norway | 60.74% |
| France | 60.59% |
| St. Lucia | 58.94% |
| Australia | 57.74% |
| Switzerland | 57.63% |
| Fiji | 47.49% |
Within the 2025-only subset, Czechia is highest at 73.87%, followed by Guatemala at 72.22%, Mongolia at 67.01%, Belgium at 62.00%, Norway at 60.74%, and France at 60.59%. The median across the 62 economies with 2025 observations is 34.00%, and the simple mean is 33.40%.
The advantage of this subset is temporal consistency. The limitation is coverage: the 62 economies are simply those with a 2025 observation, not a representative sample of all economies. The broad latest-value map is useful for coverage, while the 2025 table is better when a common reference year matters.
Regional medians differ, but they are descriptive rather than official regional estimates
Grouping the latest observations geographically produces simple medians of about 45.20% in Oceania, 40.42% in South America, 40.32% in North America, 40.11% in Europe, 25.58% in Africa, and 16.76% in Asia. These figures count every economy once and are not weighted by the number of firms, employment, or GDP.
The regional differences should not be treated as causal findings. Observation years vary and the within-region ranges are extremely large. Asia, for example, includes China at 79.12% and Saudi Arabia at 1.42%. Country-level firm structure can matter more than a continental average.
The denominator is firms, not employees
This distinction is central. A firm with 20 employees and a firm with 2,000 employees can each count as one firm in a percentage of firms. If 40% of firms offer training, the percentage of workers with access could be much higher or lower depending on which firms train and how large they are.
Employee-level questions require different measures, such as the share of employees trained, training hours, training expenditure, or participation by occupation. IC.FRM.TRNG.ZS is closer to a measure of how widely formal training provision is distributed across firms.
Formal training is narrower than all workplace learning
The World Bank description refers to formal training programs for permanent, full-time employees. Informal coaching, routine supervision, learning by doing, and short task demonstrations may not be equivalent to a formal program under the survey concept. This distinction helps explain why the measure should not be interpreted as the full amount of workplace learning.
A firm can also use external providers instead of running its own training system. Industry associations, technical institutes, online courses, equipment suppliers, and professional certification programs can all contribute to skill development. The indicator does not attempt to measure every channel in the training ecosystem.
A high training share is not the same as high productivity
Formal training may be associated with skill development and productivity, but this cross-country snapshot cannot establish cause and effect. More productive firms may have more resources to invest in training, and technology-intensive industries may require more structured learning. The relationship can run in multiple directions.
A stronger explanation would combine training with labor productivity, firm size, exporter status, technology adoption, skill shortages, education levels, and industry composition. The current map shows where formal training provision is common among firms, not why it is common or whether it caused better economic outcomes.
Firm-size composition can influence the national percentage
Large firms generally have more dedicated human-resources capacity and may find it easier to organize formal courses, while small firms can face higher fixed costs per employee. A national percentage can therefore be influenced by the mix of small, medium, and large firms in the survey population.
The verified file used here contains one national total per economy and does not split the indicator by firm size or industry. A deeper analysis would compare small, medium, and large firms separately and would examine manufacturing and service industries where available.
Survey timing and design matter in latest-value comparisons
Enterprise Surveys indicators come from firm surveys, so fieldwork does not occur in every country in the same year. The latest-value approach reduces missing coverage but does not eliminate differences in economic conditions across survey dates. The few observations from the 2000s or 2010s deserve extra caution in a current comparison.
Firm surveys also differ from censuses. The sample frame, eligibility rules, and sampling design determine which firms are represented. The values in this article use the official World Bank country observations as provided, while treating observation year and the firm-level denominator as key interpretation limits.
How to read the map without turning it into a ranking of workforce quality
The map is useful for locating economies where formal training provision is widespread or uncommon among surveyed firms. It does not measure the quality of workers, universities, vocational schools, or national education systems. Nor does it tell us whether the training offered is effective.
The table and observation-year chart add context that the choropleth cannot show. A bright map color from an older survey should not be read as more current than a moderate value observed in 2025. Exact values and years should be checked together.
Data source and calculation method
The source is World Bank indicator IC.FRM.TRNG.ZS, ‘Firms offering formal training (% of firms).’ The description refers to firms offering formal training programs for permanent, full-time employees. The dataset used here contains the most recent non-empty official observation for each of 181 countries and territories.
The median, mean, quartiles, rankings, year counts, 2025 subset, and descriptive regional medians are calculated directly from those 181 verified observations. Missing economies are not filled with zero. ISO3 country codes are joined to a low-resolution world boundary layer, producing 159 direct polygon matches; 22 small economies remain in the tables and statistics even when not visible as separate polygons.
Frequently Asked Questions
Does 50% mean half of all employees received training?
No. It means 50% of surveyed firms report offering formal training programs for permanent, full-time employees. Employee participation requires a separate measure.
Are all values on the map from 2025?
No. The map uses each economy's latest non-empty observation, ranging from 2007 to 2025. However, 155 of 181 observations are from 2023–2025.
Does a higher training share prove higher labor productivity?
No. This cross-country snapshot does not establish causality. Productivity, firm size, industry mix, and technology can all be related to training provision.
Related Articles
Green Map creates custom-edited map images using open geographic data sources such as geoBoundaries, Natural Earth, OpenStreetMap, and government open data. These maps are edited visual materials, not raw data files, and are provided for education, documents, presentations, and graphic reference.