Eurostat’s 2025 business digitalisation data show large differences in the share of enterprises using artificial intelligence technologies that generate written or spoken natural language. Among 32 reporting countries, Denmark has the highest value at 30.76%. Finland follows at 20.12% and Sweden at 19.73%. The Netherlands reaches 16.34%, Belgium 15.86%, Austria 15.26%, Norway 15.09% and Estonia 15.07%. At the lower end, Türkiye records 2.72%, Albania 2.85%, Romania 3.12%, Serbia 3.16% and Bulgaria 3.22%.
The unweighted mean of the 32 national rates is 9.39%, while the median is 7.05%. The mean exceeds the median by about 2.34 percentage points because the upper observations pull the average upward. The first quartile is 4.78% and the third quartile is 14.16%, so the middle half of observations lies roughly within that interval. The difference between the maximum and minimum is 28.04 percentage points. Looking at the median and actual percentage-point gaps helps avoid over-reading the ranking.
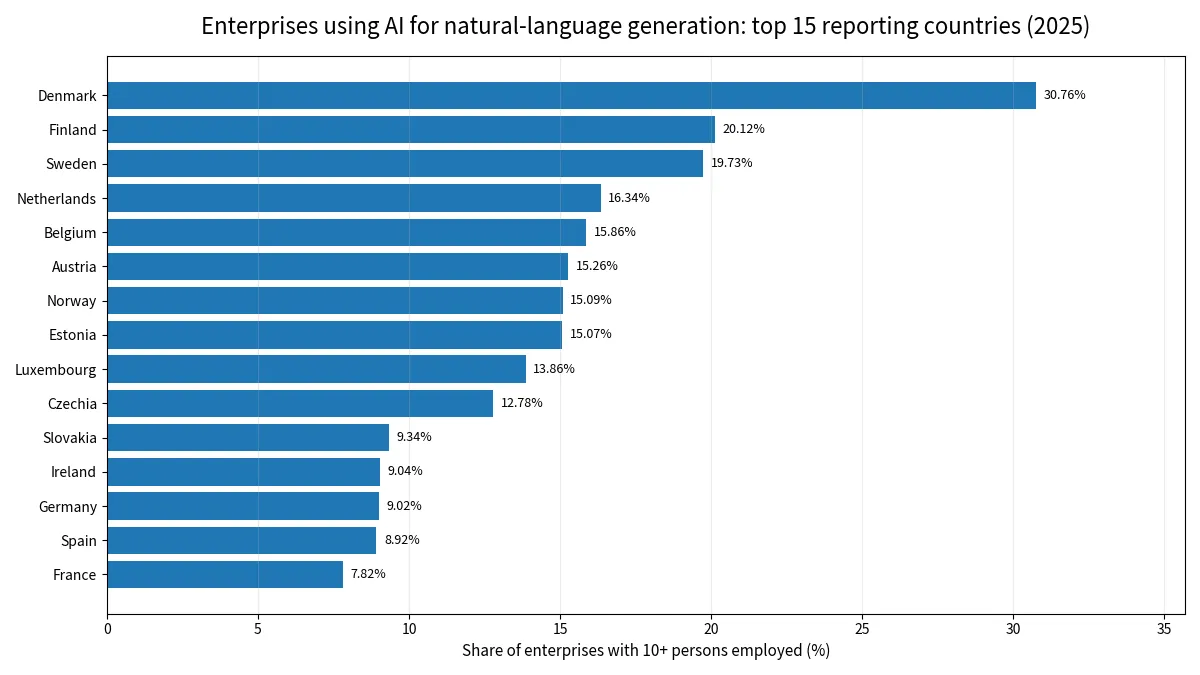
Table of Contents
This is a natural-language-generation measure, not an overall AI-use rate
E_AI_TNLG does not measure whether an enterprise uses any type of artificial intelligence. It isolates the share using AI technologies that generate written or spoken natural language. Enterprises may use other forms of AI and still remain outside this indicator. Denmark’s 30.76% therefore does not mean that only 30.76% of Danish enterprises use AI. It means that 30.76% of enterprises within the statistical population use the specific natural-language-generation technology category covered by the indicator.
The enterprise-size definition also matters. GE10 covers enterprises with ten or more persons employed, and PC_ENT expresses the result as a percentage of enterprises. A company with thousands of workers still counts as one enterprise, as does a company just above the threshold. Smaller enterprises are outside this size class. The statistic does not directly measure how often the technology is used, how many employees use it, which models are selected, how much is spent, how many documents are generated or what productivity gains result.
Denmark is above 30%, and several Nordic countries are near the top
Denmark at 30.76% is 10.64 percentage points above Finland at 20.12%. Sweden records 19.73% and Norway 15.09%. The simple average for Denmark, Finland, Norway and Sweden is 21.43%, which is 12.03 percentage points above the 32-country mean. This is an unweighted average of four national rates, not a Nordic enterprise-weighted estimate. Different national enterprise populations would need to be taken into account for a regional weighted measure.
The Benelux observations are also relatively high: the Netherlands 16.34%, Belgium 15.86% and Luxembourg 13.86%, giving a simple average of 15.35%. The Baltic states are more dispersed, with Estonia at 15.07%, Lithuania at 6.70% and Latvia at 4.67%, for a simple average of 8.81%. Geographic proximity does not guarantee similar adoption rates. The cross-section can describe the observed pattern, but it cannot by itself prove which policies, industries or skills caused the differences.
The 9.39% mean is higher than the 7.06% median
The mean is 9.39% and the median is 7.05%. With 32 observations, the median lies halfway between Croatia at 7.41% and Lithuania at 6.70%, giving 7.055%. The 2.34-point difference between mean and median reflects the influence of the upper tail, especially Denmark at 30.76%. The first quartile at 4.78% and the third quartile at 14.16% show that the middle half of countries is concentrated between roughly 4.78% and 14.16%.
By broad bands, 2 countries are at 20% or more, 6 are from 15% to below 20%, 2 are from 10% to below 15%, 13 are from 5% to below 10%, and 9 are below 5%. The top eight countries average 18.53%, while the bottom eight average 3.55%, a ratio of about 5.2 to one. These bands show why the mean alone is not a complete description of the national distribution.
Several middle-ranked countries are separated by very small gaps
Slovakia is at 9.34%, Ireland 9.04%, Germany 9.02% and Spain 8.92%, all within 0.42 percentage point. Ireland and Germany differ by only 0.02 point. France at 7.82%, Croatia at 7.41%, Lithuania at 6.70%, Malta at 6.29%, Italy at 6.20% and Slovenia at 6.05% also form a relatively compact middle group. A difference of several ranking positions can therefore correspond to only a small underlying difference in the measured share.
Germany, France, Italy and Spain have a simple average of 7.99%, which is 1.40 percentage points below the overall mean. That number is not a combined enterprise-weighted rate for the four economies because each national percentage receives the same weight. To estimate the share across all enterprises in those countries, the eligible enterprise count for each country would also be required. The present comparison intentionally keeps the focus on like-for-like national percentages.
A low value does not mean that enterprises make little use of AI overall
Latvia at 4.67%, Cyprus at 4.53%, Hungary at 4.16%, Bulgaria at 3.22%, Serbia at 3.16%, Romania at 3.12%, Albania at 2.85% and Türkiye at 2.72% are among the lower observations. These figures should not be interpreted as general AI-use rates. Enterprises can use speech recognition, image analysis, workflow automation, predictive systems or other AI technologies while not using natural-language generation. A low E_AI_TNLG rate is therefore specific to this technology category.
Natural-language generation can itself support many different activities, including drafting, summarisation, customer communication, language assistance or responses connected to internal knowledge. This national percentage does not show which uses dominate, whether adoption is occasional or deeply embedded, how many employees use the tools, or how important the technology is to core operations. It is a prevalence indicator for one technology class rather than a measure of intensity or business impact.
All 32 comparable observations for 2025
The table orders all 32 national observations from highest to lowest while holding the year, enterprise-size class, sector aggregate, indicator and unit constant. The ranking is a convenient way to navigate the data; it is not a composite ranking of AI competitiveness, innovation capacity or economic performance. Percentage-point distances are especially important in the middle of the table, where several countries are tightly clustered.
| Rank | Country | Share of enterprises |
|---|---|---|
| 1 | Denmark | 30.76% |
| 2 | Finland | 20.12% |
| 3 | Sweden | 19.73% |
| 4 | Netherlands | 16.34% |
| 5 | Belgium | 15.86% |
| 6 | Austria | 15.26% |
| 7 | Norway | 15.09% |
| 8 | Estonia | 15.07% |
| 9 | Luxembourg | 13.86% |
| 10 | Czechia | 12.78% |
| 11 | Slovakia | 9.34% |
| 12 | Ireland | 9.04% |
| 13 | Germany | 9.02% |
| 14 | Spain | 8.92% |
| 15 | France | 7.82% |
| 16 | Croatia | 7.41% |
| 17 | Lithuania | 6.70% |
| 18 | Malta | 6.29% |
| 19 | Italy | 6.20% |
| 20 | Slovenia | 6.05% |
| 21 | Portugal | 5.27% |
| 22 | Poland | 5.23% |
| 23 | Bosnia and Herzegovina | 5.10% |
| 24 | Montenegro | 4.82% |
| 25 | Latvia | 4.67% |
| 26 | Cyprus | 4.53% |
| 27 | Hungary | 4.16% |
| 28 | Bulgaria | 3.22% |
| 29 | Serbia | 3.16% |
| 30 | Romania | 3.12% |
| 31 | Albania | 2.85% |
| 32 | Türkiye | 2.72% |
What the data can and cannot establish
The evidence directly supports a comparison of the 2025 share of enterprises with ten or more persons employed using AI for natural-language generation. Denmark is highest at 30.76%, Türkiye is lowest at 2.72%, the simple mean is 9.39% and the median is 7.06%. The spread by broad bands, the difference between the upper and lower groups and the tight clustering of several middle observations can all be calculated directly from the source values.
The same data cannot tell us how much productivity the technology creates, which vendors or models dominate, or whether high adoption produces better business outcomes. A single year also does not measure the pace of adoption. Explaining national differences would require sector-level data, enterprise-size breakdowns, time series and evidence on investment, skills and organisational practice. The interpretation here therefore stays within the measured concept: the prevalence of natural-language-generation AI use in the defined enterprise population.
Source and indicator definition
The source is Eurostat isoc_eb_ai annual data for 2025. The indicator is E_AI_TNLG, the enterprise-size class is GE10, the sector aggregate is C10-S951_X_K and the unit is PC_ENT. The 2025 comparison uses 32 country observations reported under the same Eurostat definition. The mean, median, quartiles, distribution bands and ranking in this article are calculated directly from those 32 published values.
Frequently Asked Questions
Which country had the highest share of enterprises using AI for natural-language generation in 2025?
Denmark had the highest share among the 32 reporting countries at 30.76%, followed by Finland at 20.12% and Sweden at 19.73%.
Is E_AI_TNLG the same as the overall share of enterprises using AI?
No. It covers enterprises with ten or more persons employed that use AI technologies generating written or spoken natural language. Enterprises using other AI technologies may fall outside this indicator.
What are the mean and median across the 32 countries?
The unweighted mean is 9.39% and the median is 7.05%. The higher mean reflects the influence of the largest national observations.
Is the 9.39% mean an enterprise-weighted European average?
No. It is the simple average of 32 national percentages. A weighted European rate would require the number of eligible enterprises in each country.
Related Articles
Green Map creates custom-edited map images using open geographic data sources such as geoBoundaries, Natural Earth, OpenStreetMap, and government open data. These maps are edited visual materials, not raw data files, and are provided for education, documents, presentations, and graphic reference.