World Bank data for 2023 show a highly uneven distribution in the share of each reporting economy’s merchandise exports that went to Arab World economies. Among 196 reported observations, the simple mean is 7.65% while the median is only 2.60%. Somalia records the highest share at 90.84%, followed by the Syrian Arab Republic at 89.84%, the Central African Republic at 68.02% and Sudan at 59.89%. At the opposite end, several small island and Asia-Pacific economies are below 0.1%.
The gap between the mean and median is a central feature of the data. The first quartile is 0.71% and the third quartile 7.35%, so the middle half of the reported values lies roughly inside that range. The top ten observations average 58.33%, while the bottom ten average only 0.0163%. A relatively small set of very high shares pulls the arithmetic mean well above the typical observation.
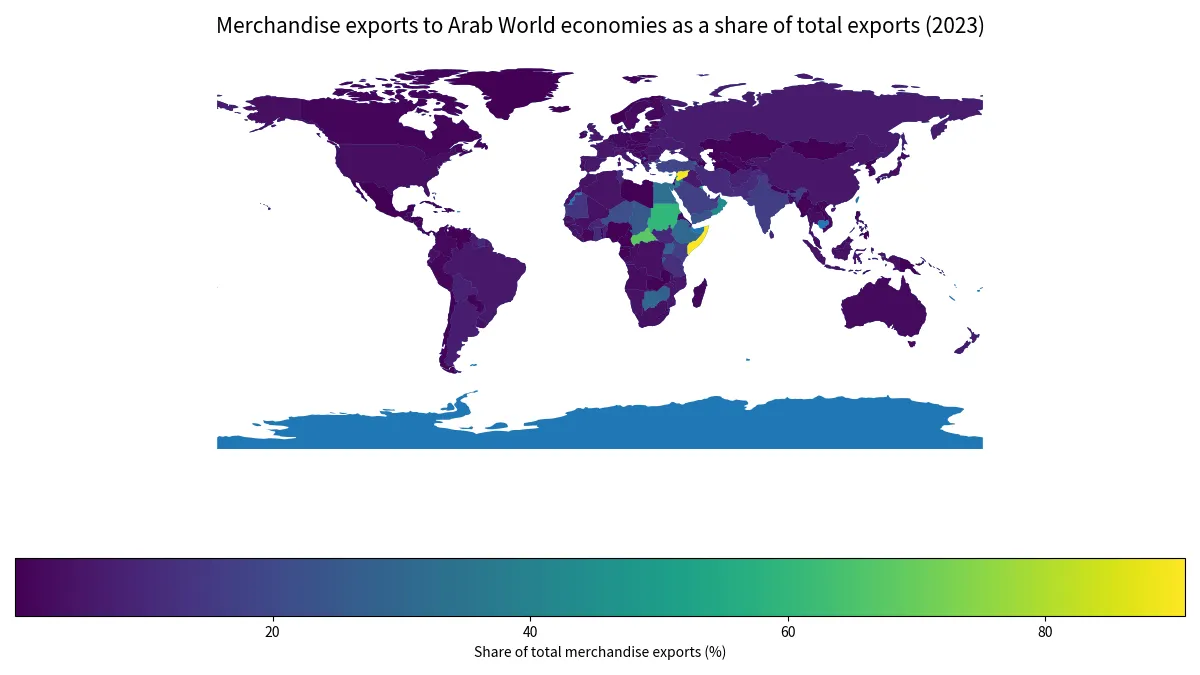
Table of Contents
The indicator measures the destination share of each reporter’s exports
TX.VAL.MRCH.AL.ZS is not the Arab World’s share of global exports. It measures, for each reporting economy, the value of merchandise exports sent to economies in the World Bank Arab World partner group as a percentage of that reporter’s total merchandise exports. Two countries can therefore have the same percentage while exporting very different dollar amounts. The measure is about export-market orientation, not absolute export size.
The indicator covers merchandise trade rather than services. Tourism receipts, transport services, remittances, investment flows and other cross-border transactions are outside its scope. A high share to Arab World destinations is one feature of the merchandise export structure and should not be treated as a complete measure of economic integration.
Somalia and Syria sent close to 90% of reported merchandise exports to Arab World economies
Somalia reaches 90.84% and the Syrian Arab Republic 89.84%. The Central African Republic is at 68.02%, Sudan 59.89%, Bahrain 55.22% and Kuwait 52.66%. Lebanon records 48.03%, Oman 43.82% and Jordan 39.01%. These values indicate a very strong concentration of merchandise export destinations in the Arab World group.
There are 6 observations at or above 50%, 19 at or above 25% and 35 at or above 10%. By contrast, 62 observations are below 1%. The pattern is therefore not a gradual global gradient: a limited set of economies has very strong exposure to Arab World destinations while many others send only a small fraction of their merchandise exports there.
The map highlights high shares in the Middle East, North Africa and some nearby economies
Among observations matched to the map boundary, the median is 4.37% across 49 African economies and 3.72% across 44 Asian economies. Europe’s median is 2.04% and North America’s is 0.50%. These are unweighted descriptive medians, not regional trade shares weighted by export value.
Geographic proximity is clearly relevant to the visible pattern but cannot explain every difference. Product mix, land and sea routes, re-export hubs, trade agreements, border commerce, historical relationships and domestic production structures can all influence destination shares. Those factors are not separately measured here, so the map should be used to identify patterns rather than assign causes.
Nearby economies also differ substantially. Bahrain at 55.22%, Kuwait at 52.66%, Oman at 43.82% and Jordan at 39.01% are all high, but not identical. Armenia reaches 28.46%, while Ethiopia is at 30.36% and Uganda 26.30%. The Arab World can therefore be an important export destination for both members of the group and neighboring non-member economies.
The 7.65% mean overstates the share of a typical reporting economy
The mean of 7.65% is about 5.06 percentage points above the median of 2.60%. The median is often a better description of a typical observation in a skewed distribution because half the reported economies are below it and half above it. The third quartile is only 7.35%, meaning three quarters of observations are at or below that level.
It is therefore more accurate to say that the median reporting economy sends roughly 2.6% of merchandise exports to Arab World economies, while a small number of very high shares lift the average to about 7.7%. Because every country percentage receives equal weight, this simple mean is not the share of world merchandise exports going to the Arab World.
Large exporters can have modest shares while still shipping large values
The United States records 3.24%, China 5.38%, India 16.12%, Germany 2.35%, France 5.02% and Japan 3.50%. These percentages describe the destination mix of each country’s merchandise exports. A lower percentage does not imply a smaller dollar value when the reporting economy has a much larger total export base.
That distinction is important when interpreting the table. The indicator answers ‘how important are Arab World destinations within this reporter’s export portfolio?’ It does not answer ‘which reporter sells the most merchandise to the Arab World in dollars?’ The latter requires bilateral trade values rather than destination shares.
Arab World member economies also show very different intra-group export shares
For reporting economies that belong to the Arab World group, the indicator captures the share of their own merchandise exports going to economies in the same partner group. Bahrain, Kuwait, Oman and Jordan have high values, suggesting strong intra-group orientation. Other member economies can have much lower shares. Membership alone therefore does not determine export-market structure.
Commodity composition can matter as well. Energy exporters may direct large volumes to destinations outside the region, while food, manufactured goods or re-exports may follow different routes. Because TX.VAL.MRCH.AL.ZS does not break exports down by product, explaining a high or low share requires commodity-level trade data.
All 196 reported observations for 2023
The table lists the 196 countries and economies with a reported 2023 value, ordered from highest to lowest. The 21 source-missing rows remain missing rather than being converted to zero. Missing data and a genuinely small export share are therefore kept distinct.
| Rank | Country or economy | Share to Arab World |
|---|---|---|
| 1 | Somalia | 90.84% |
| 2 | Syria | 89.84% |
| 3 | Central African Republic | 68.02% |
| 4 | Sudan | 59.89% |
| 5 | Bahrain | 55.22% |
| 6 | Kuwait | 52.66% |
| 7 | Lebanon | 48.03% |
| 8 | Oman | 43.82% |
| 9 | Jordan | 39.01% |
| 10 | Seychelles | 35.93% |
| 11 | Egypt | 32.85% |
| 12 | Botswana | 30.43% |
| 13 | Ethiopia | 30.36% |
| 14 | Cyprus | 29.90% |
| 15 | Armenia | 28.46% |
| 16 | Zimbabwe | 28.08% |
| 17 | Burundi | 26.41% |
| 18 | Uganda | 26.30% |
| 19 | Chad | 25.00% |
| 20 | Yemen | 23.16% |
| 21 | Niger | 21.44% |
| 22 | Türkiye | 18.56% |
| 23 | Saudi Arabia | 16.80% |
| 24 | Kenya | 16.16% |
| 25 | India | 16.12% |
| 26 | Tuvalu | 15.01% |
| 27 | Mauritania | 14.04% |
| 28 | Tanzania | 11.77% |
| 29 | United Arab Emirates | 11.45% |
| 30 | Pakistan | 10.96% |
| 31 | Iran | 10.74% |
| 32 | Bahamas | 10.56% |
| 33 | Palestinian Territories | 10.39% |
| 34 | Greece | 10.36% |
| 35 | Ghana | 10.34% |
| 36 | Tunisia | 9.81% |
| 37 | American Samoa | 9.73% |
| 38 | South Sudan | 9.72% |
| 39 | Suriname | 9.46% |
| 40 | San Marino | 9.40% |
| 41 | Palau | 9.17% |
| 42 | Burkina Faso | 8.68% |
| 43 | Qatar | 8.37% |
| 44 | Bolivia | 8.35% |
| 45 | Afghanistan | 8.28% |
| 46 | Djibouti | 8.23% |
| 47 | Sri Lanka | 7.87% |
| 48 | Benin | 7.86% |
| 49 | Rwanda | 7.63% |
| 50 | Argentina | 7.25% |
| 51 | Malta | 7.16% |
| 52 | Ukraine | 7.09% |
| 53 | Russia | 6.47% |
| 54 | Belarus | 6.09% |
| 55 | Switzerland | 6.04% |
| 56 | Kyrgyzstan | 5.91% |
| 57 | Iraq | 5.84% |
| 58 | Spain | 5.81% |
| 59 | Bulgaria | 5.79% |
| 60 | Guyana | 5.76% |
| 61 | United Kingdom | 5.71% |
| 62 | Brazil | 5.70% |
| 63 | New Zealand | 5.69% |
| 64 | Italy | 5.53% |
| 65 | China | 5.38% |
| 66 | Mozambique | 5.18% |
| 67 | France | 5.02% |
| 68 | Comoros | 4.64% |
| 69 | Algeria | 4.43% |
| 70 | Romania | 4.41% |
| 71 | Senegal | 4.37% |
| 72 | Liberia | 4.37% |
| 73 | Trinidad & Tobago | 4.34% |
| 74 | Namibia | 4.28% |
| 75 | Cape Verde | 4.12% |
| 76 | Morocco | 4.10% |
| 77 | Sierra Leone | 4.06% |
| 78 | Indonesia | 3.94% |
| 79 | Malawi | 3.92% |
| 80 | Mali | 3.75% |
| 81 | Congo – Kinshasa | 3.74% |
| 82 | Mauritius | 3.71% |
| 83 | Ecuador | 3.65% |
| 84 | Guinea | 3.59% |
| 85 | South Africa | 3.58% |
| 86 | Japan | 3.50% |
| 87 | Thailand | 3.45% |
| 88 | Portugal | 3.37% |
| 89 | Uruguay | 3.35% |
| 90 | Georgia | 3.34% |
| 91 | United States | 3.24% |
| 92 | Hong Kong SAR China | 3.16% |
| 93 | Angola | 3.10% |
| 94 | St. Kitts & Nevis | 2.85% |
| 95 | Denmark | 2.75% |
| 96 | Belgium | 2.72% |
| 97 | St. Lucia | 2.67% |
| 98 | South Korea | 2.65% |
| 99 | Congo – Brazzaville | 2.54% |
| 100 | Malaysia | 2.53% |
| 101 | Sweden | 2.50% |
| 102 | Germany | 2.35% |
| 103 | Bangladesh | 2.33% |
| 104 | Australia | 2.21% |
| 105 | Netherlands | 2.13% |
| 106 | Colombia | 2.13% |
| 107 | Guatemala | 2.11% |
| 108 | Finland | 2.08% |
| 109 | Moldova | 2.06% |
| 110 | Slovenia | 2.02% |
| 111 | Singapore | 1.96% |
| 112 | Uzbekistan | 1.94% |
| 113 | Israel | 1.93% |
| 114 | Serbia | 1.92% |
| 115 | Lithuania | 1.89% |
| 116 | Slovakia | 1.88% |
| 117 | Croatia | 1.79% |
| 118 | Vietnam | 1.79% |
| 119 | Peru | 1.71% |
| 120 | Eritrea | 1.63% |
| 121 | Madagascar | 1.61% |
| 122 | Ireland | 1.50% |
| 123 | Luxembourg | 1.49% |
| 124 | Côte d’Ivoire | 1.43% |
| 125 | Czechia | 1.39% |
| 126 | Poland | 1.33% |
| 127 | Curaçao | 1.22% |
| 128 | Latvia | 1.20% |
| 129 | Austria | 1.19% |
| 130 | Nicaragua | 1.13% |
| 131 | Guinea-Bissau | 1.10% |
| 132 | Canada | 1.10% |
| 133 | Sint Maarten | 1.02% |
| 134 | Hungary | 1.00% |
| 135 | Maldives | 0.98% |
| 136 | Kosovo | 0.97% |
| 137 | Dominica | 0.95% |
| 138 | Bosnia & Herzegovina | 0.92% |
| 139 | Estonia | 0.88% |
| 140 | Myanmar (Burma) | 0.88% |
| 141 | Paraguay | 0.86% |
| 142 | Tajikistan | 0.82% |
| 143 | Cameroon | 0.81% |
| 144 | Philippines | 0.77% |
| 145 | Montenegro | 0.76% |
| 146 | Togo | 0.73% |
| 147 | Barbados | 0.71% |
| 148 | Cuba | 0.71% |
| 149 | Nigeria | 0.70% |
| 150 | Aruba | 0.69% |
| 151 | Bermuda | 0.68% |
| 152 | Gabon | 0.67% |
| 153 | Norway | 0.67% |
| 154 | Kazakhstan | 0.65% |
| 155 | Albania | 0.65% |
| 156 | Azerbaijan | 0.62% |
| 157 | Chile | 0.54% |
| 158 | Jamaica | 0.53% |
| 159 | Venezuela | 0.53% |
| 160 | Costa Rica | 0.50% |
| 161 | Zambia | 0.41% |
| 162 | Nepal | 0.39% |
| 163 | Dominican Republic | 0.34% |
| 164 | Mexico | 0.34% |
| 165 | Lesotho | 0.30% |
| 166 | Haiti | 0.29% |
| 167 | Timor-Leste | 0.29% |
| 168 | Antigua & Barbuda | 0.28% |
| 169 | Iceland | 0.28% |
| 170 | Nauru | 0.27% |
| 171 | North Macedonia | 0.27% |
| 172 | North Korea | 0.25% |
| 173 | Gibraltar | 0.23% |
| 174 | Eswatini | 0.21% |
| 175 | Mongolia | 0.18% |
| 176 | Turkmenistan | 0.16% |
| 177 | Honduras | 0.15% |
| 178 | El Salvador | 0.14% |
| 179 | Equatorial Guinea | 0.08% |
| 180 | Greenland | 0.07% |
| 181 | St. Vincent & Grenadines | 0.06% |
| 182 | Faroe Islands | 0.06% |
| 183 | Marshall Islands | 0.06% |
| 184 | Belize | 0.05% |
| 185 | Libya | 0.04% |
| 186 | Grenada | 0.04% |
| 187 | Brunei | 0.03% |
| 188 | Panama | 0.03% |
| 189 | Papua New Guinea | 0.03% |
| 190 | Solomon Islands | 0.02% |
| 191 | Micronesia | 0.02% |
| 192 | Laos | 0.01% |
| 193 | Macao SAR China | 0.01% |
| 194 | Bhutan | 0.01% |
| 195 | Guam | 0.01% |
| 196 | Gambia | 0.01% |
Coverage rules and interpretation limits
The World Bank notes that the indicator is computed only when at least half of the economies in the partner-country group have non-missing data. A published percentage therefore does not necessarily mean bilateral data are complete for every Arab World partner. It should be read as a group share that passed the stated coverage threshold.
The comparison also represents one year. Commodity prices, shipping disruptions, large contracts, border conditions or policy changes can move the share from year to year. A long-run assessment of export dependence requires a consistent time series rather than a single 2023 observation.
The map displays 164 of the 196 reported observations. The other 32 values are retained in the complete table and summary statistics because the low-resolution map boundary does not include every small island or territory. Blank map areas should not be interpreted as zero.
Source and indicator definition
The source is the World Bank indicator TX.VAL.MRCH.AL.ZS for 2023. The unit is the percentage of each reporting economy’s total merchandise exports sent to economies in the Arab World partner group. The World Bank states that the measure is computed when at least half of the partner economies have non-missing data. The mean, median, quartiles and ranking are calculated from the 196 reported observations.
Frequently Asked Questions
What does this indicator measure?
It measures the percentage of each reporting economy’s total merchandise exports sent to economies in the World Bank Arab World partner group.
What are the 2023 median and mean?
Across the 196 reported observations, the median is 2.60% and the simple mean is 7.65%.
Does a higher percentage always mean a larger export value?
No. It is a share of each reporter’s total merchandise exports. Comparing dollar values requires total exports and bilateral trade values.
Are missing observations treated as zero?
No. The 21 source-missing rows remain missing and are excluded from the mean and ranking.
Related Articles
Green Map creates custom-edited map images using open geographic data sources such as geoBoundaries, Natural Earth, OpenStreetMap, and government open data. These maps are edited visual materials, not raw data files, and are provided for education, documents, presentations, and graphic reference.