Jefferson County is Kentucky’s most intensely urban county, centered on Louisville and wrapped along the Ohio River on the north and west. The map set shows a dense network of communities and roads around Louisville, then a noticeable transition toward creek valleys, wooded land, and higher ground in the eastern and southern parts of the county. Visitors can review the web maps on this page and download four high-resolution JPG originals in one ZIP for printing, classroom work, or closer comparison.
Louisville gives the county an urban pattern unlike most of Kentucky. St. Matthews, Jeffersontown, Shively, Lyndon, Middletown, Anchorage, Prospect, and other incorporated places sit within or beside the broader Louisville landscape, while the Ohio River remains the strongest natural boundary. Louisville Metro also has a distinctive administrative history: the city and Jefferson County governments merged in 2003, which helps explain why the city index uses the Census-style label “Louisville/Jefferson County Metro Government (balance).”
Table of Contents
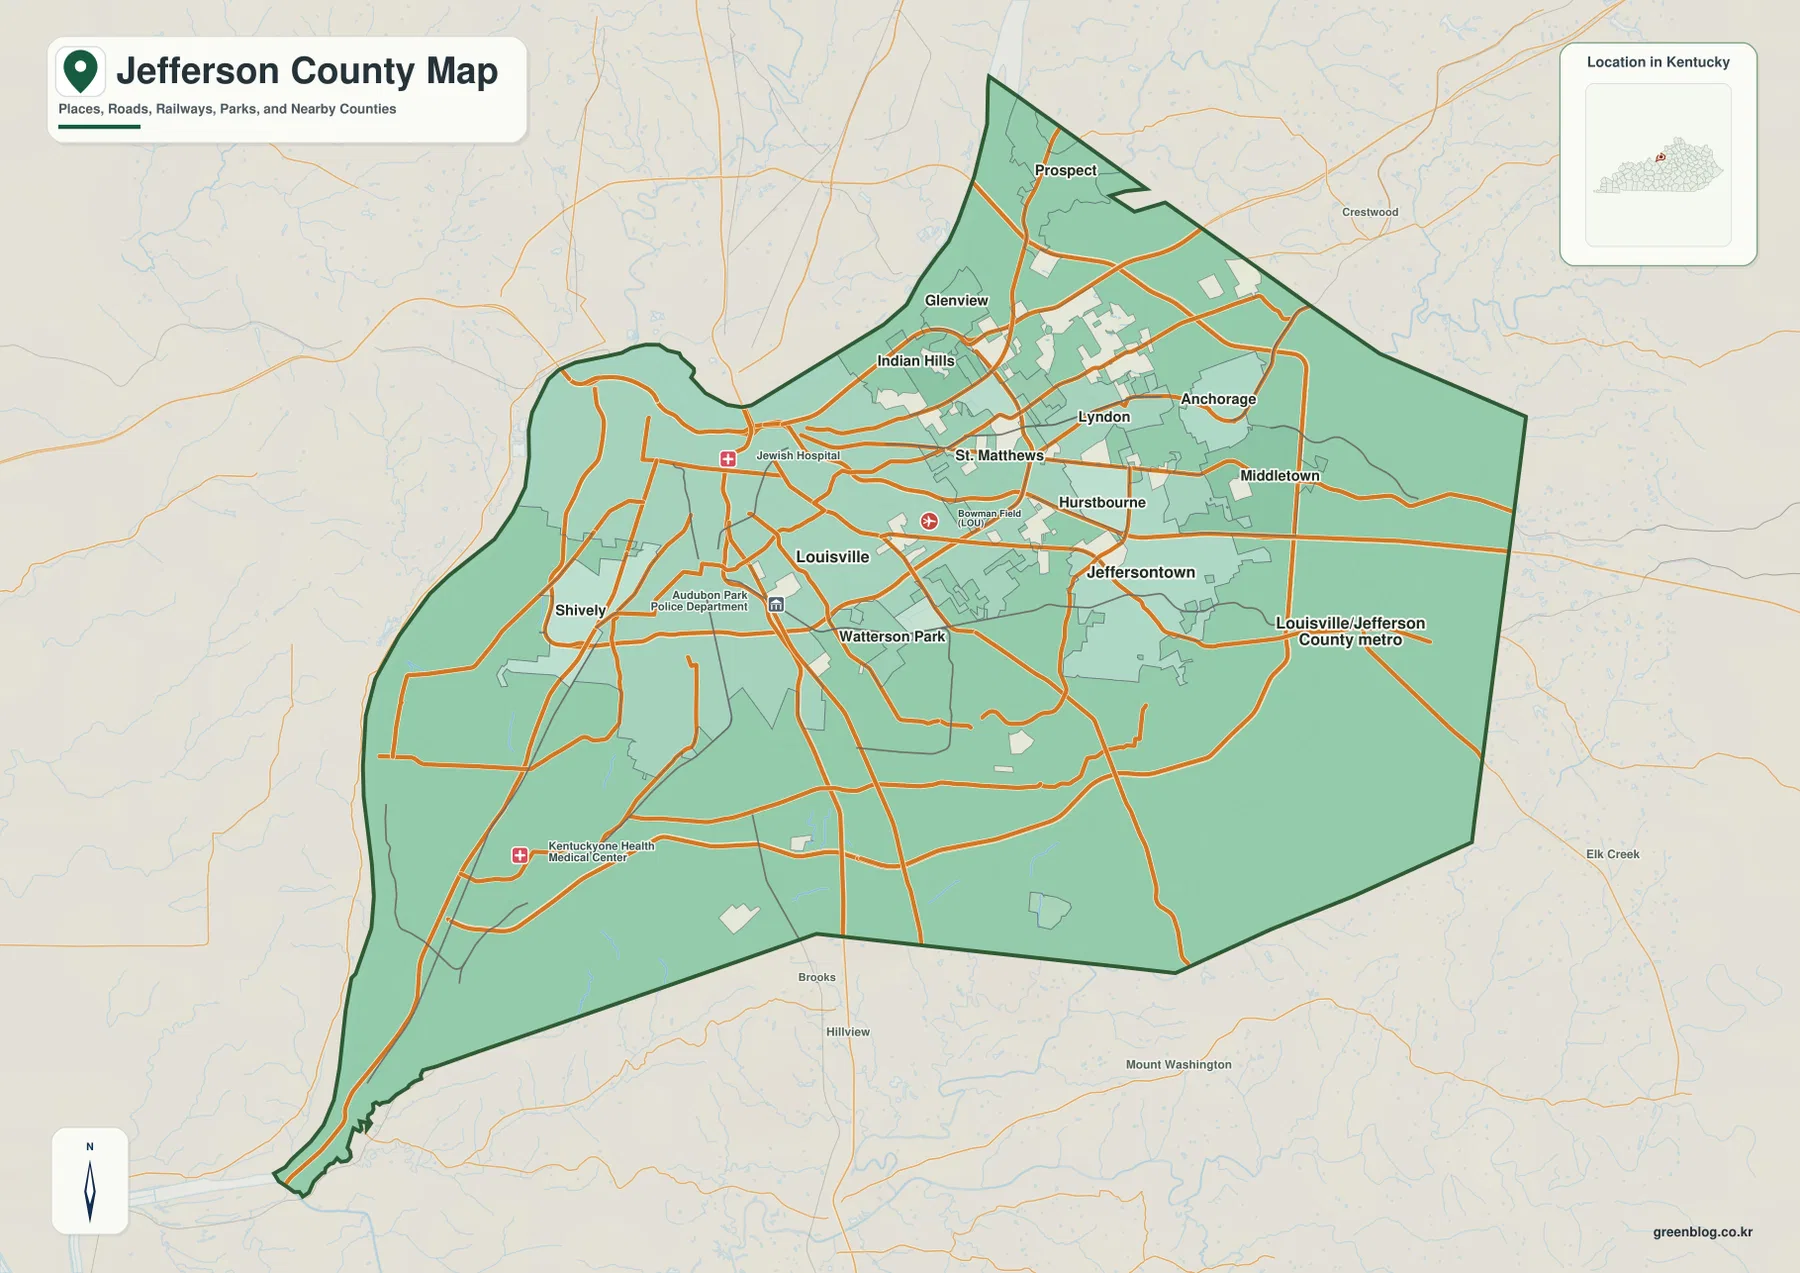
Louisville anchors a road network that spreads into many separate communities
The county map is packed with settlement names compared with most Kentucky county maps. Louisville occupies the central-western urban core, while St. Matthews and Lyndon sit to the northeast, Jeffersontown lies farther east, and Shively is west-southwest of the central city. Prospect and Glenview provide northern references near the Ohio River, and places such as Anchorage, Middletown, Hurstbourne, Indian Hills, and Watterson Park fill in the dense suburban pattern.
Several major interstate corridors shape travel through Jefferson County. I-64 crosses the Louisville area east to west, I-65 provides the main north-south connection, and I-71 leaves the urban core toward the northeast. I-264 and I-265 help frame the inner and outer metropolitan road system. The map is useful for county-wide orientation, but current navigation, closures, and construction should always be checked with live routing tools or Kentucky Transportation Cabinet information.
The dark county boundary is especially helpful on the east and northeast sides, where the continuous road network can make the transition into neighboring counties easy to miss. Jefferson County contains a large built-up area, yet its southern tip and eastern edge are much less urban than central Louisville. Reading the boundary first and then following the roads outward makes it easier to separate the legal county outline from the larger Louisville regional footprint.
The city index shows how strongly the county is centered on Louisville
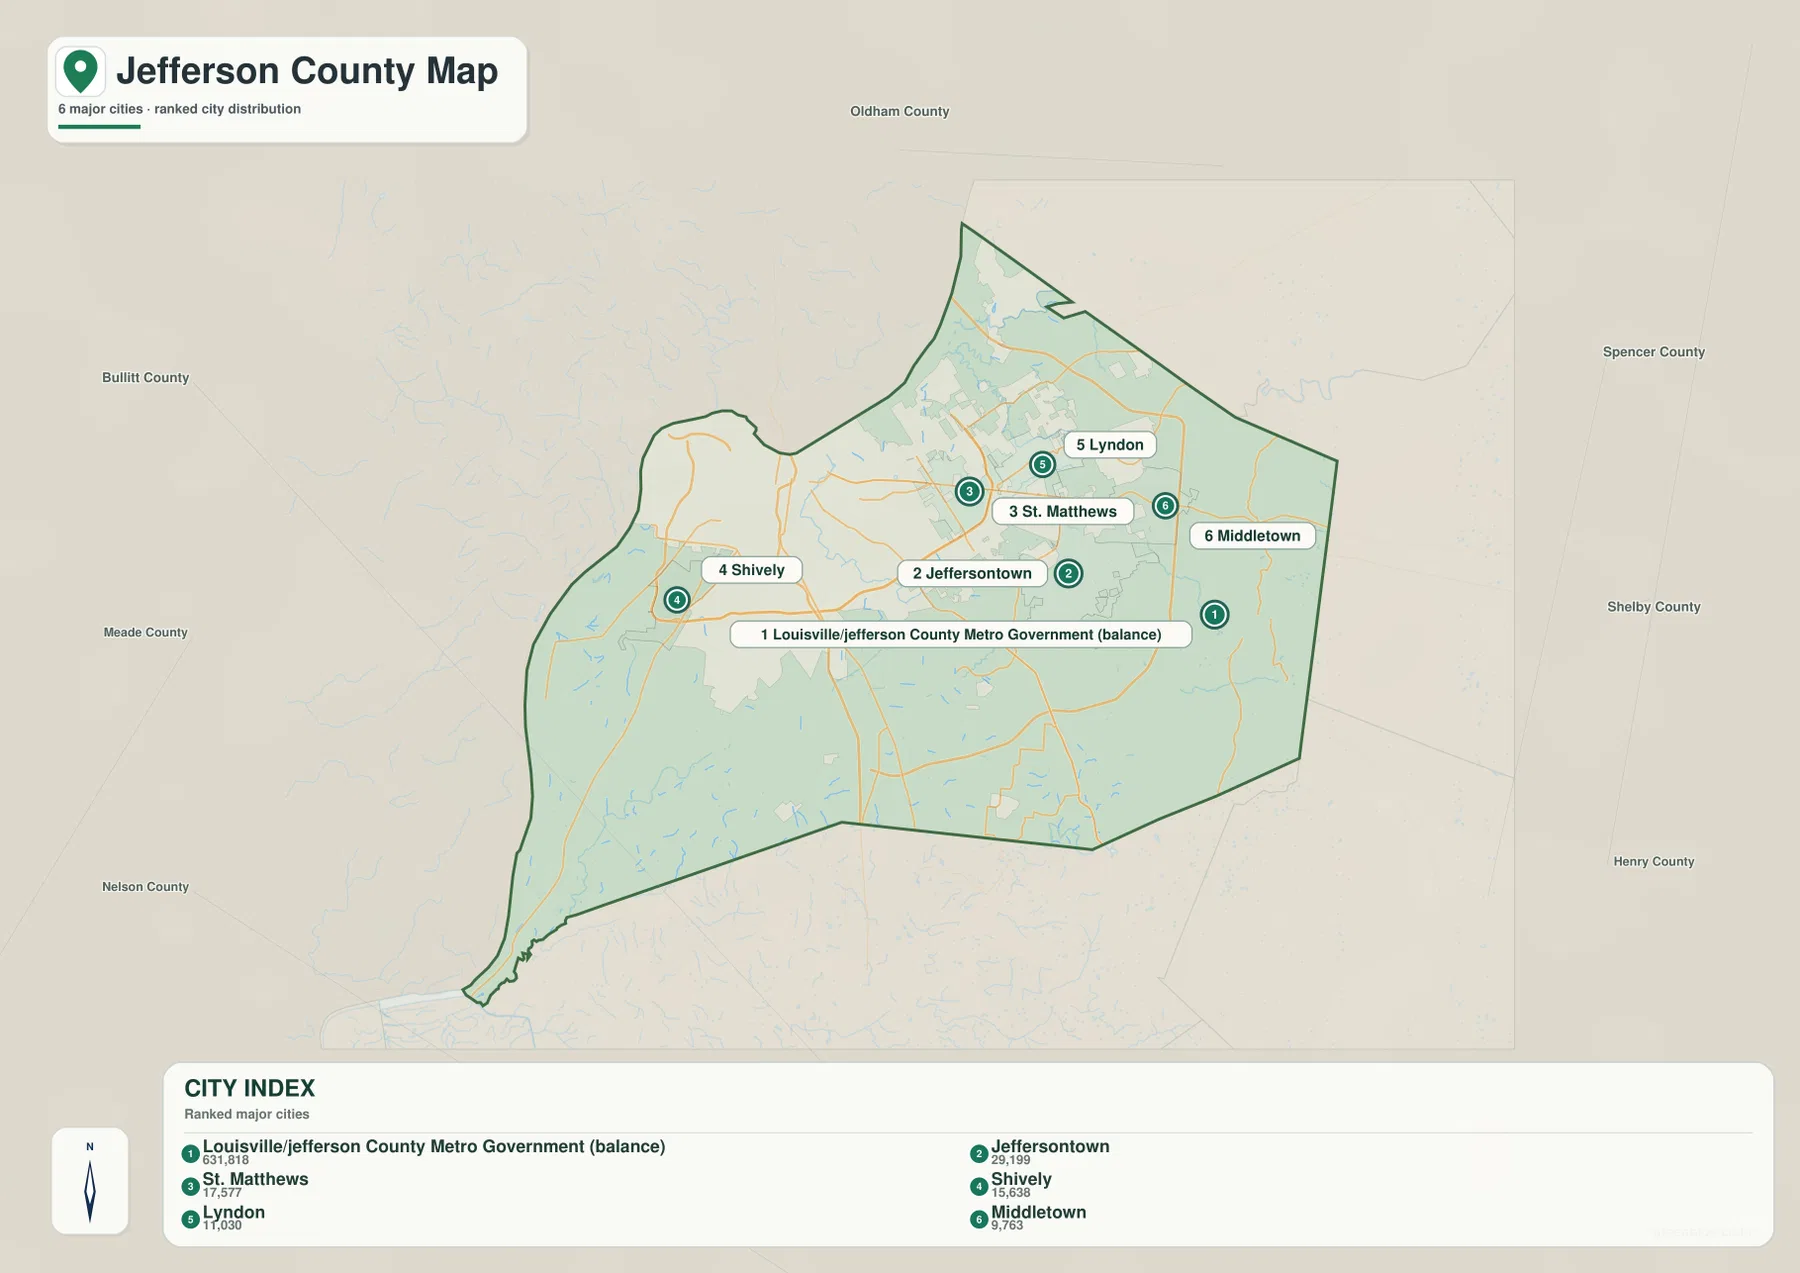
The ranked city map lists six principal entries. Louisville/Jefferson County Metro Government (balance) appears first, followed by Jeffersontown, St. Matthews, Shively, Lyndon, and Middletown. The displayed values are reference figures attached to the map rather than live population counts, so anyone who needs current demographic totals should use the latest U.S. Census Bureau tables instead of treating the labels as continuously updated statistics.
The spatial pattern matters as much as the ranking. Jeffersontown and Middletown mark the eastern side of the metropolitan area, St. Matthews and Lyndon cluster northeast of central Louisville, and Shively provides a western reference. The six ranked places are not spread evenly across the entire county; they are concentrated in the developed Louisville basin and its eastern suburbs, leaving the far south and southeast much less represented in the city ranking.
Other named municipalities remain important even though they do not appear among the six ranked entries. Prospect, Anchorage, Indian Hills, and Glenview are all visible on the county map. Using the clean city index first and then returning to the more detailed county map is a practical way to understand Jefferson County’s layered municipal geography without getting lost in the dense road network.
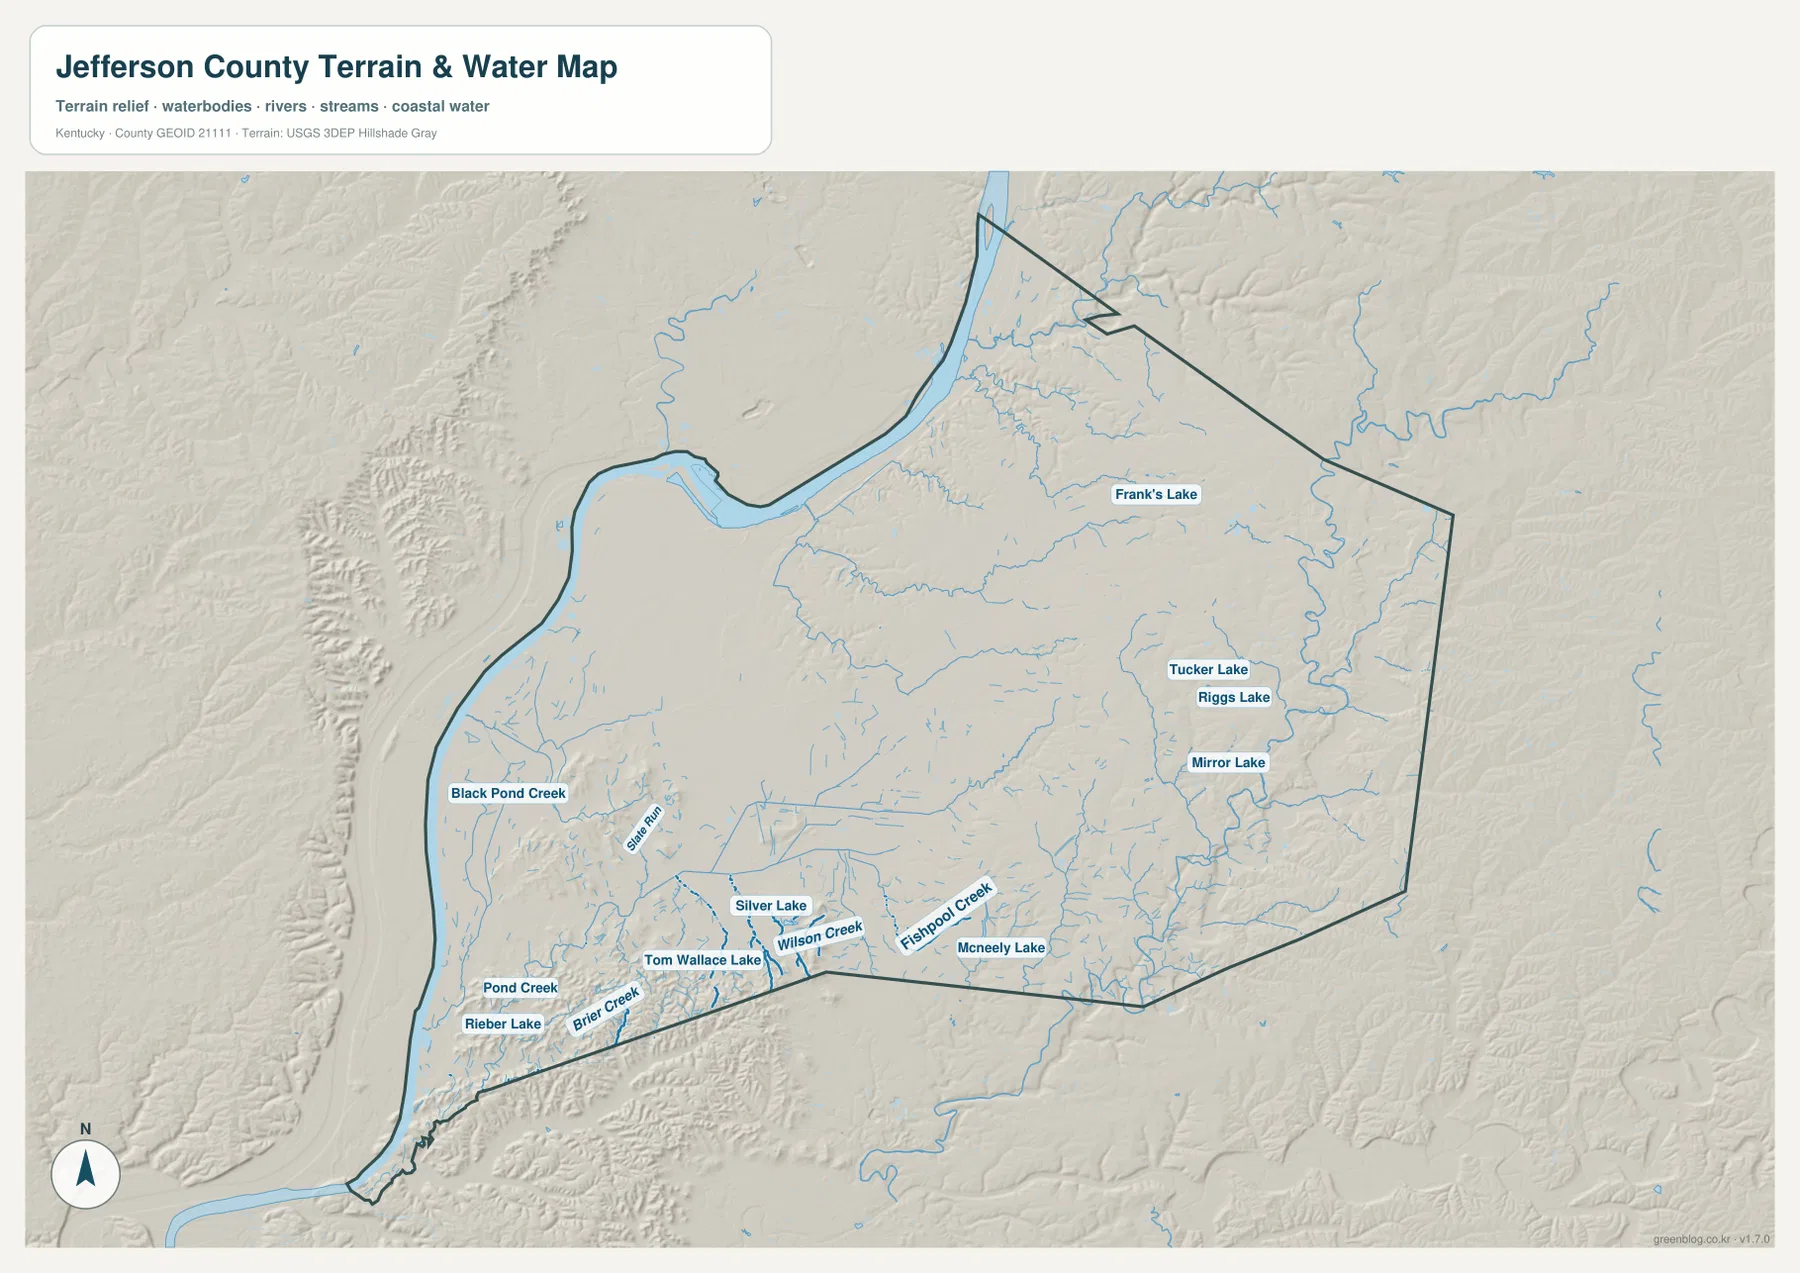
The Ohio River lowland is joined by a web of urban creeks and small lakes
The Ohio River is the dominant water feature, tracing much of Jefferson County’s northern and western edge. Away from the river, the water and terrain map identifies smaller channels including Pond Creek, Black Pond Creek, Wilson Creek, Fishpool Creek, and Brier Creek. These streams are easy to overlook on a conventional city map, but together they show how drainage corridors continue through heavily developed parts of the county and into the greener southern landscape.
Several named lakes and ponds add finer detail. Tom Wallace Lake appears in the south, with Silver Lake and McNeely Lake nearby, while Tucker Lake, Riggs Lake, and Mirror Lake are grouped farther east. Frank’s Lake is labeled in the northeastern part of the county. The result is a water map that includes both the county-scale Ohio River boundary and much smaller inland waters, making it useful for understanding the contrast between riverfront Louisville and the interior drainage network.
Jefferson Memorial Forest provides a useful real-world example of the more rugged southern landscape. Louisville Metro describes the forest as a major natural area with steep wooded slopes, small streams, trails, and Tom Wallace Lake. The supplied water map is still only a static geographic reference: it should not be used for flood-risk decisions, real-time water levels, boating navigation, legal water boundaries, or property questions.
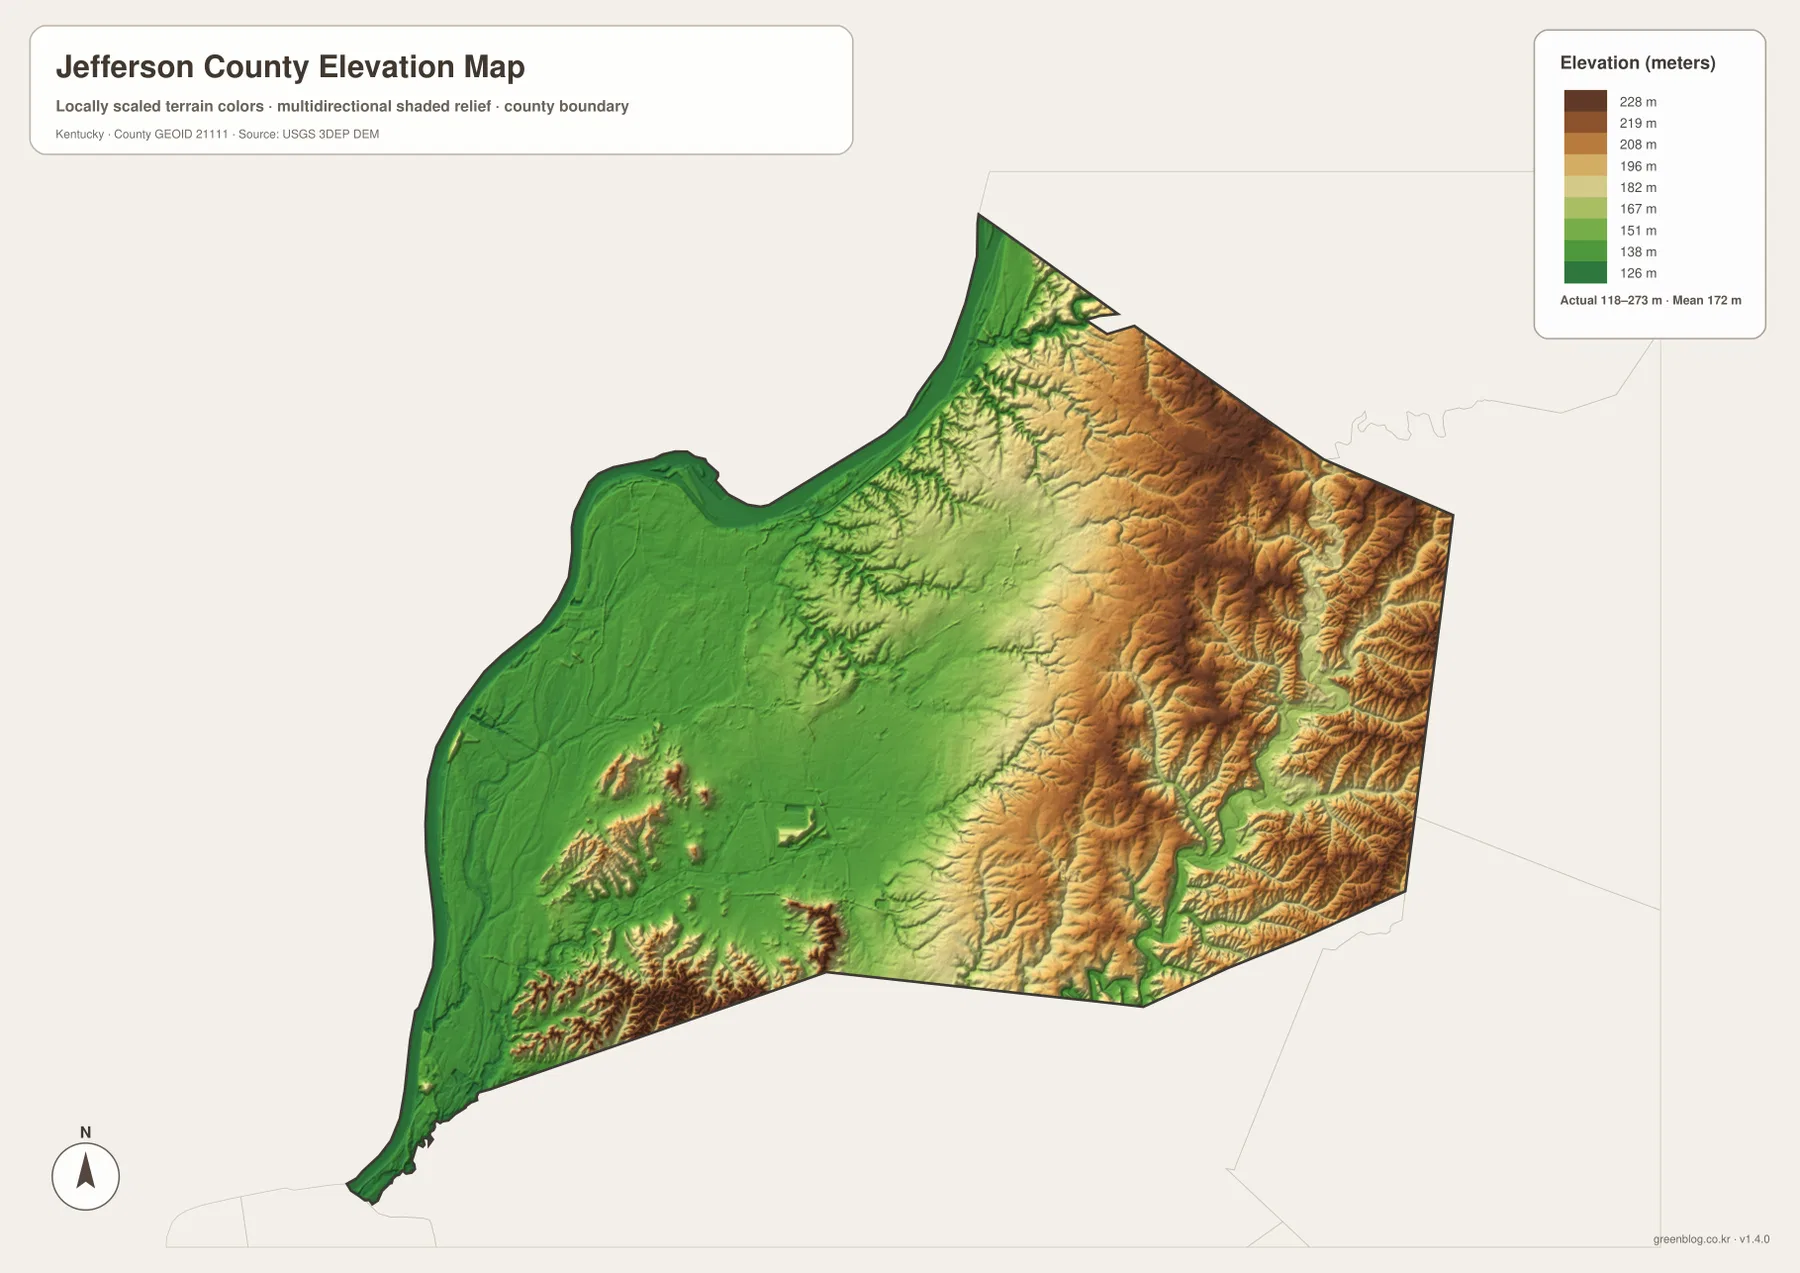
Elevation climbs from the Ohio River plain toward eastern and southern hills
The elevation map shows an actual range of about 118 to 273 meters and a mean elevation of 172 meters. The lowest green areas cover much of the western side near the Ohio River and extend across large parts of the Louisville urban plain. The northern river corridor is similarly low, creating a broad contrast with the hillier terrain that becomes increasingly obvious east of the central city.
Tan and brown colors dominate more of the eastern half, where ridges and narrow drainage valleys create a rougher surface. The southeast also contains repeated hills, while the southwest includes a separate cluster of steep knobs around the Jefferson Memorial Forest area. Louisville Metro’s own description of local physiographic regions names the Ohio River Valley, the Knobs, the Shale Lowland, the Floyd’s Fork watershed, and the Limestone Belt, underscoring how many landforms meet inside one county.
This terrain difference helps explain why the western metropolitan area appears comparatively flat while roads and streams become more winding near the outer eastern and southern edges. The elevation colors are generalized for county-scale comparison and are not survey measurements. Exact elevations for a property, building, drainage design, or engineering project should come from source elevation data or a qualified survey rather than this visualization.
Urban Louisville and Jefferson Memorial Forest reveal two very different sides of the county
A simple way to orient yourself is to start with downtown Louisville and the Ohio River, then move outward through the suburban communities. St. Matthews, Lyndon, Jeffersontown, and Middletown create a chain of eastern references, while Shively helps locate the west-southwest side of the urban area. The county map becomes much easier to read once those anchors are in place, because the remaining roads and smaller place names can be related back to them.
The southern part of Jefferson County changes character sharply. Jefferson Memorial Forest lies about 15 miles from downtown Louisville and is described by Louisville Metro as the city’s largest nature preserve, with extensive forest, trails, streams, and rugged slopes. Tom Wallace Lake appears on the supplied water map in this same broader southern landscape. The elevation map confirms that the area is far more broken and hilly than the broad river plain around central and western Louisville.
The eastern side adds another contrast. Development remains substantial, but the terrain rises and becomes more dissected by drainage valleys as the county approaches its outer edge. Jefferson County is therefore more than a dense city map: within the same boundary are an Ohio River lowland, a heavily built metropolitan core, suburban municipalities, wooded knobs, and higher eastern ridges. That variety is what makes comparing all four map layers especially informative here.
Frequently Asked Questions
Which places are highlighted as the main city references in Jefferson County?
The ranked city map places Louisville/Jefferson County Metro Government (balance) first, followed by Jeffersontown, St. Matthews, Shively, Lyndon, and Middletown. The more detailed county map also labels places such as Prospect, Anchorage, Indian Hills, Glenview, Hurstbourne, and Watterson Park. Current population totals should be checked against the latest Census data rather than the static map labels.
Which map is best for the Ohio River, creeks, and small lakes?
The water and terrain map is the best choice. It shows the Ohio River together with Pond Creek, Black Pond Creek, Wilson Creek, Fishpool Creek, and named lakes such as Tom Wallace Lake, McNeely Lake, Tucker Lake, and Mirror Lake. It is a geographic reference rather than a flood map or real-time water information source.
What does the Jefferson County elevation map show about Louisville’s landscape?
It shows a county-wide range of about 118 to 273 meters, with a mean of 172 meters. Broad low ground lies near the Ohio River and much of western Louisville, while higher and more dissected terrain dominates the east and parts of the south. The map is for regional comparison, not survey-grade elevation measurement.
Map File Information
Download the map files associated with this page for reference, printing, and compatible visual projects.
- Included Files: Use only the versions confirmed in the article and supplied images
- File Type: Use the confirmed download contents
- Intended Use: Printing, education, presentations, and map-based projects
Related Maps
Sources and References
Administrative and local context can be checked through Louisville Metro Government and the Louisville Parks and Recreation overview. Natural-area information comes from the official Jefferson Memorial Forest page, while the county’s contrasting landforms are described by the Louisville Loop physiographic regions guide. Boundary, road, water, and elevation references are available from U.S. Census Bureau TIGER/Line, Kentucky Transportation Cabinet, USGS National Hydrography, and the USGS 3D Elevation Program.
Green Map creates custom-edited map images using open geographic data sources such as geoBoundaries, Natural Earth, OpenStreetMap, and government open data. These maps are edited visual materials, not raw data files, and are provided for education, documents, presentations, and graphic reference.