Elliott County is a compact eastern Kentucky county where narrow stream valleys and closely spaced ridges shape nearly every part of the map. Sandy Hook is the clearest reference point, with KY 7 and KY 32 meeting near the community and a web of smaller numbered roads extending into the surrounding hills. Instead of broad open lowlands, the county is dominated by short valleys, winding roads, and branching streams that make the landscape feel intricate even at county scale. High-resolution map files are available for download in the section below.
This page brings together a boundary-and-road map, a simplified major-city map, a terrain-and-water map, and an elevation map. High-resolution JPG originals for all four can be downloaded together in one ZIP, which is useful when route shields, creek names, or elevation bands are too small to read comfortably in the WebP display images. The maps are intended for county-scale reference rather than live navigation, parcel work, flood determination, or survey-grade measurement.
Table of Contents
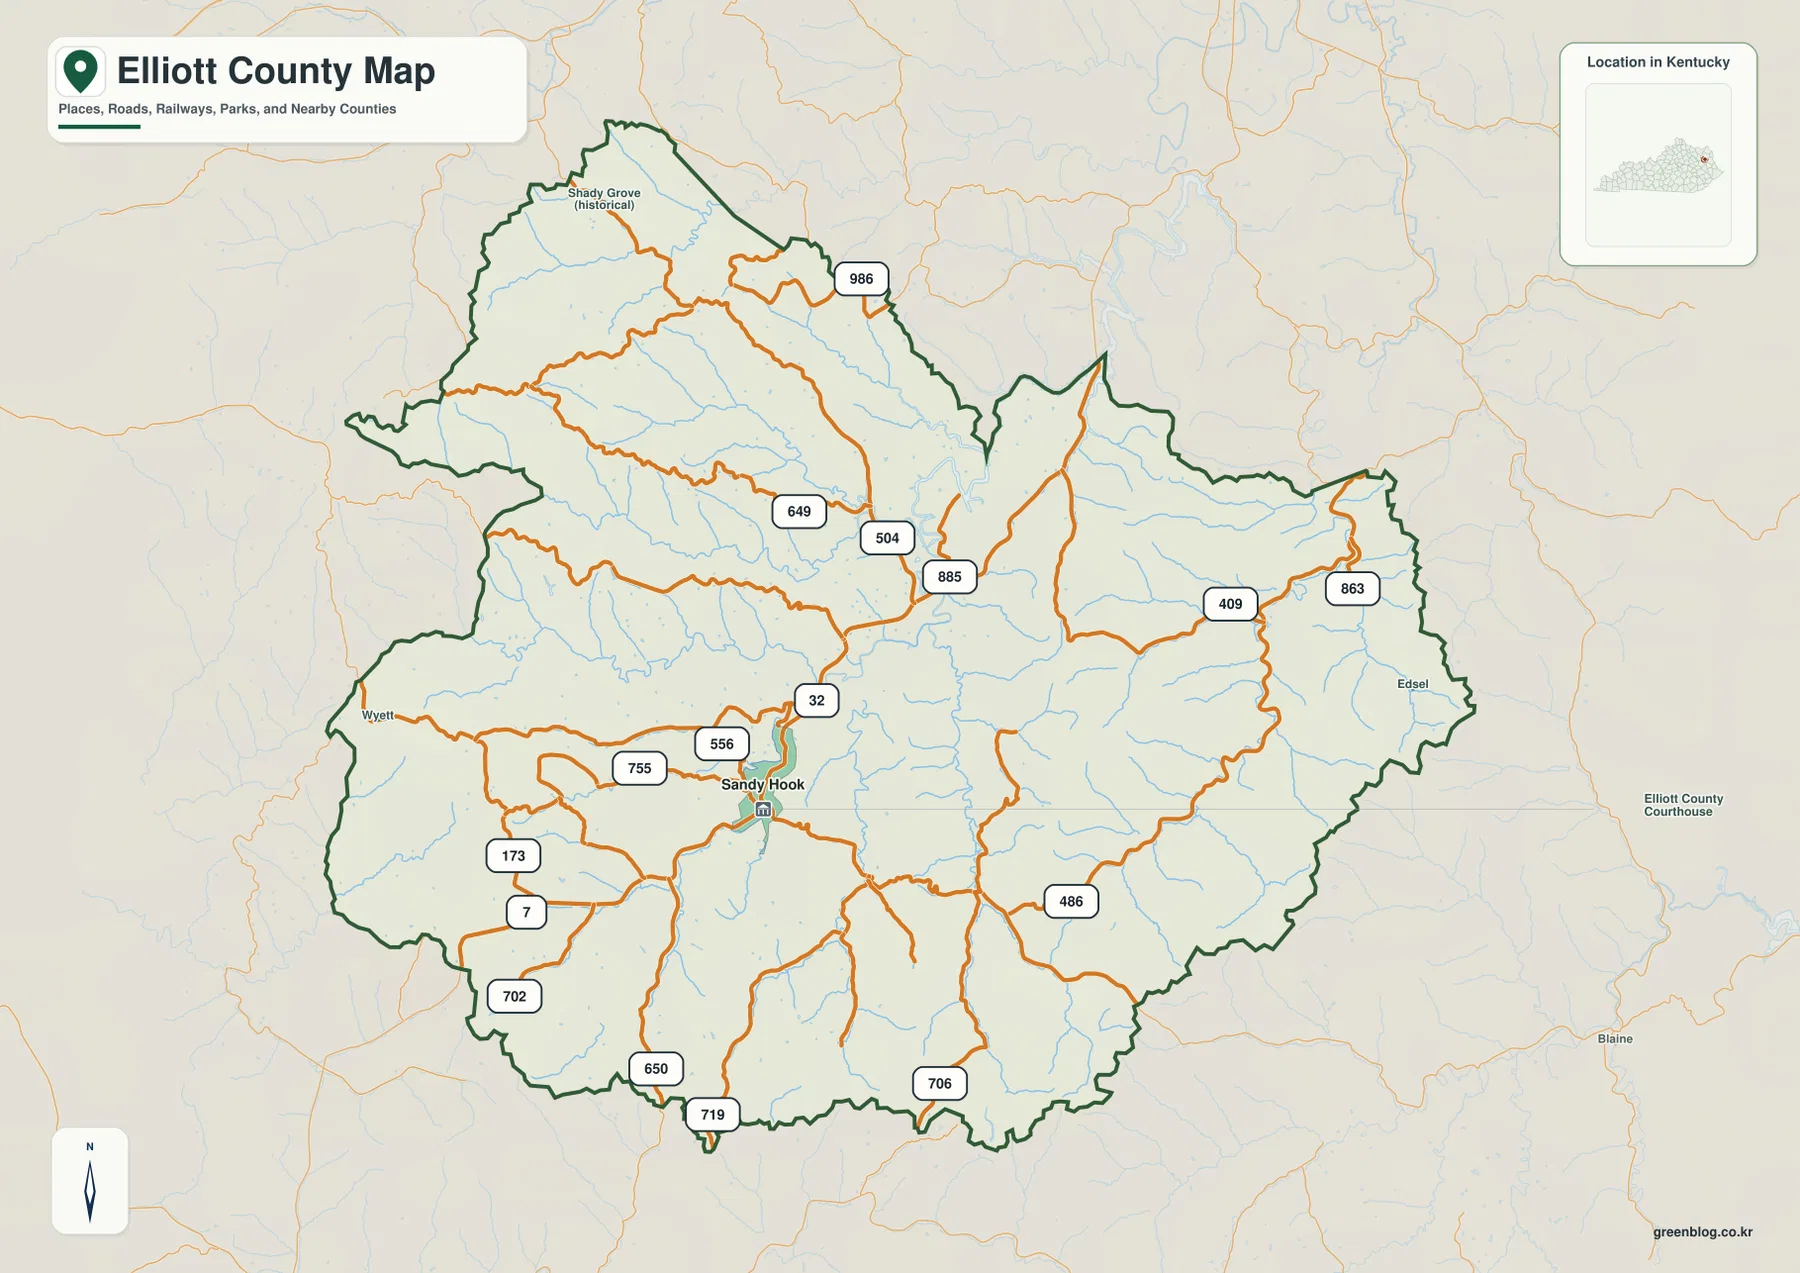
Sandy Hook turns a dense road network into an understandable starting point
The general county map makes Sandy Hook the most useful place to begin. KY 7 runs through the community while KY 32 provides an east-west connection, and KY 556 and KY 755 branch nearby. A wider look brings in KY 173, 504, 649, 885, 409, 486, 706, 719, 863, and 986. The striking feature is not the number of roads alone but how often they bend, divide, and reconnect as they follow narrow valleys between the ridges.
That pattern matters when reading distance and direction. A place that looks relatively close to Sandy Hook in a straight line may be reached by a road that curves around several ridges or follows a stream valley before turning toward its destination. Starting with KY 7 and KY 32 and then tracing the smaller route numbers gives the map a clearer hierarchy. It is a more practical approach than trying to interpret every orange road line at once.
Smaller labels around the county add local reference points without competing with Sandy Hook. Edsel appears toward the eastern side, Wytt is marked near the western edge, and Shady Grove Historical is shown in the north. These places help distinguish the outer portions of the county, especially where the roads are tightly curved and the boundary itself has an irregular shape. Pairing a local place name with a route number is often the easiest way to orient yourself in those areas.
One major-city marker keeps the county overview unusually simple
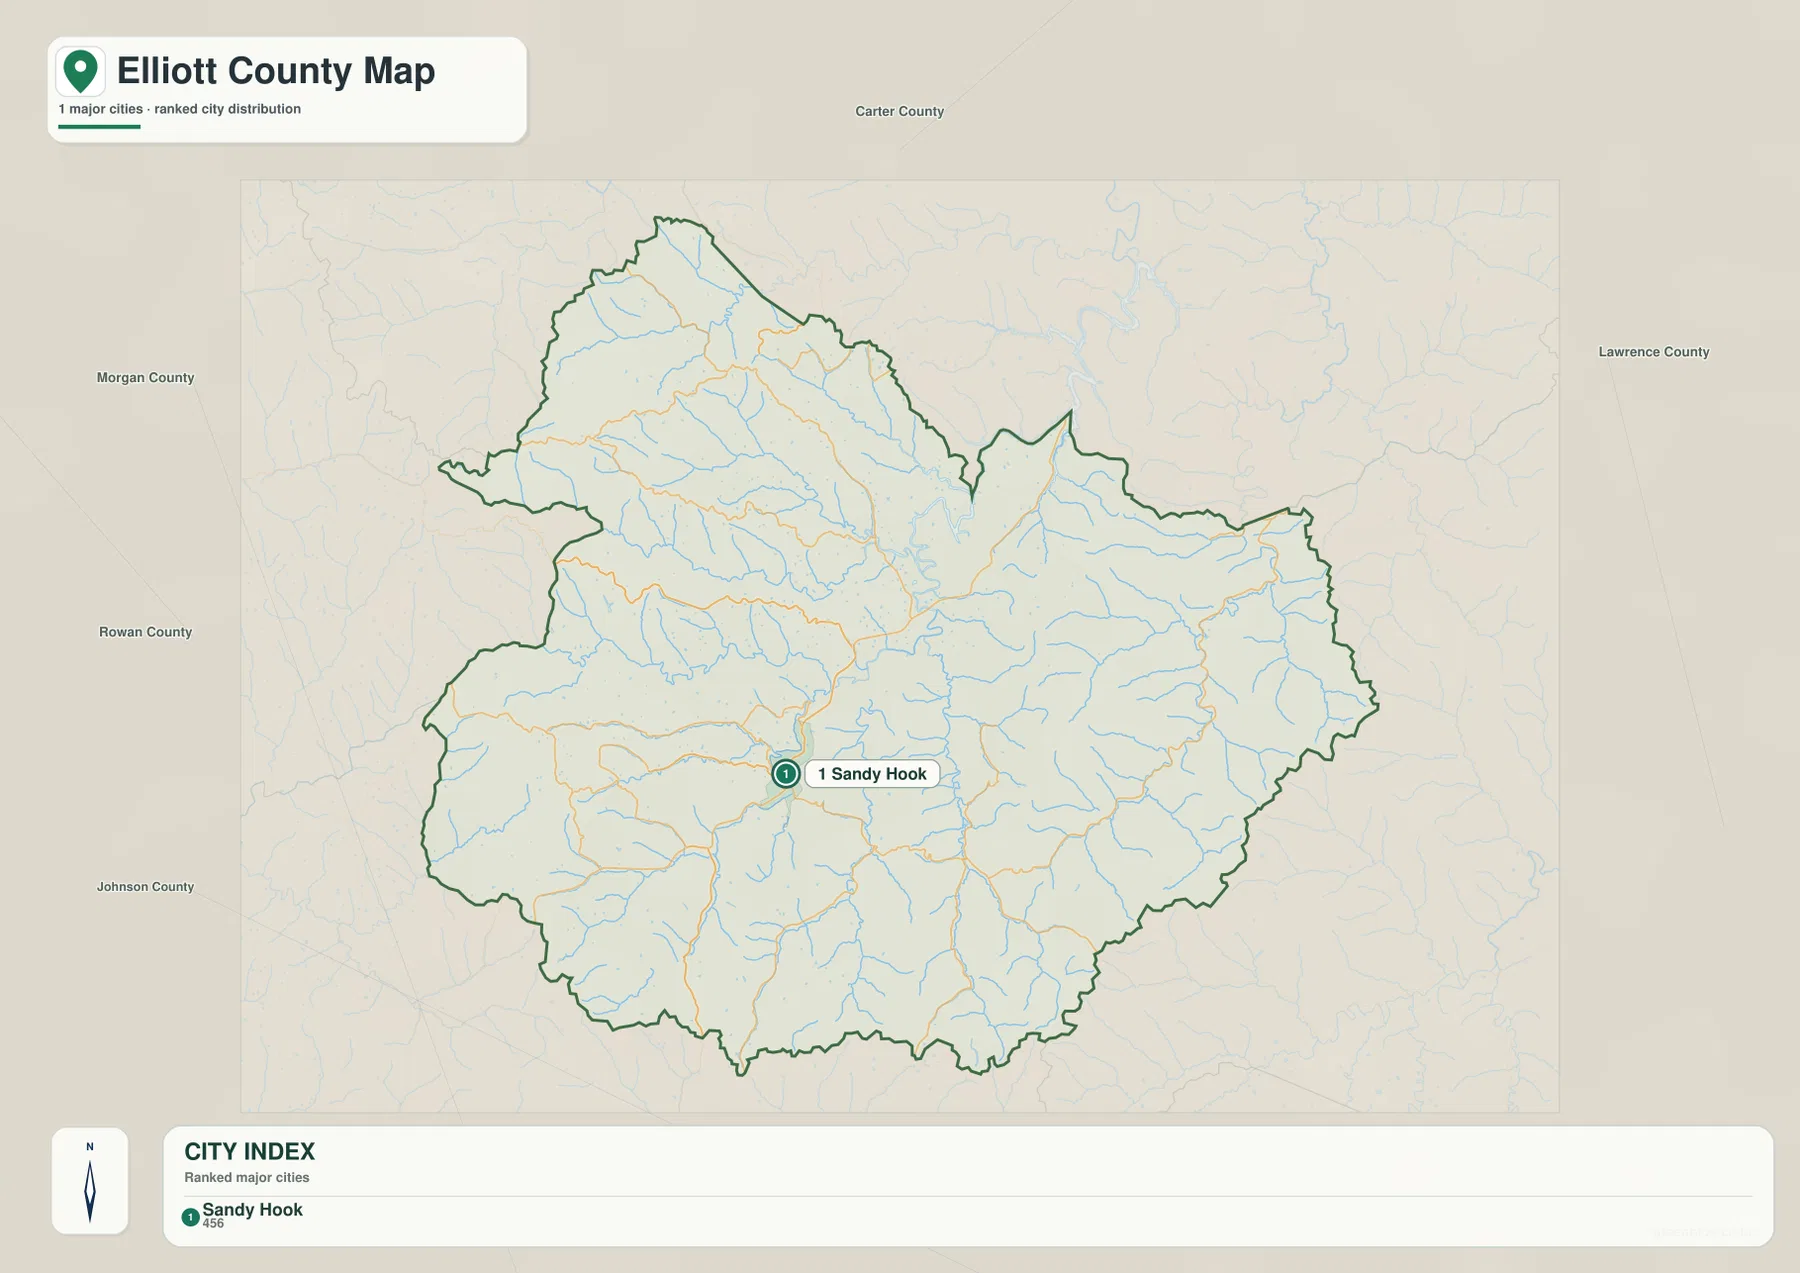
The city map identifies Sandy Hook as the county’s single major-city reference point. There are no connector lines between several ranked cities because the map does not need them here. That simplicity is useful: it shows immediately that Elliott County is not organized around several similarly prominent urban centers. Sandy Hook functions as the natural anchor for understanding where the county’s roads, services, and surrounding communities relate to one another.
The same map also provides broader geographic context by naming the surrounding counties. Carter County is shown to the north, Lawrence County to the east, and Morgan and Rowan counties on the western side, with Johnson County also visible to the southwest. For route planning, the detailed road map remains the better choice, but the city map is cleaner when the goal is simply to explain where Elliott County sits and where Sandy Hook lies inside it.
Elliott County’s official local-government site says the county was established in 1869 from parts of Morgan, Lawrence, and Carter counties and describes Sandy Hook as the heart of the county. That background fits the map well: the neighboring counties remain close on every side, while Sandy Hook stands out as the main named center within the boundary. The overview should still be treated as a geographic reference rather than a legal source for parcel or boundary disputes.
Little Sandy River tributaries divide the hills into a dense network of valleys
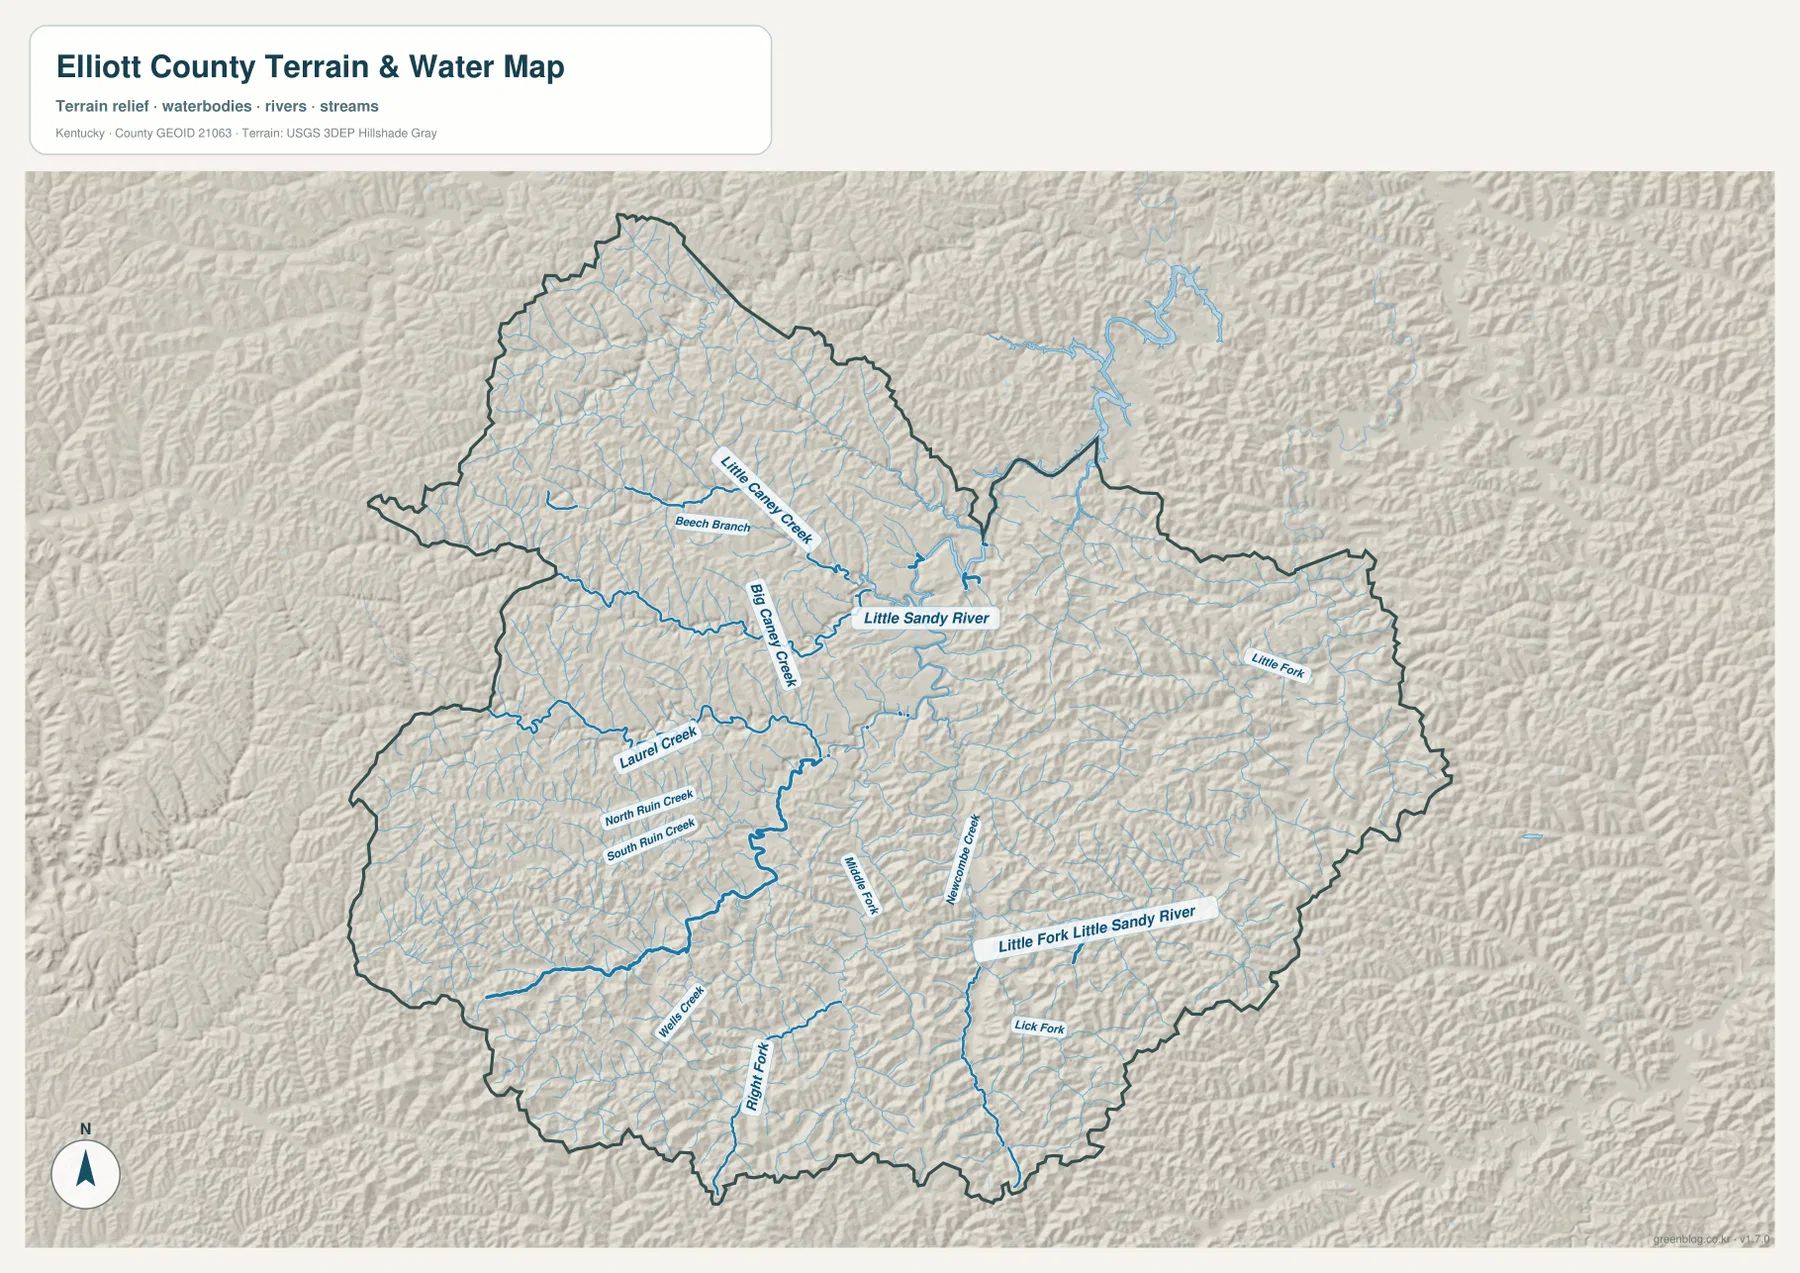
The terrain-and-water map is dominated by the Little Sandy River through the central part of the county. Little Caney Creek and Big Caney Creek approach from the northwest, Laurel Creek crosses the western side, and the Little Fork Little Sandy River drains the eastern side. Farther south, the Middle Fork and Right Fork occupy additional narrow valleys. The result is a branching drainage pattern that explains much of the fine-grained texture visible across the shaded terrain.
Smaller names such as Beech Branch, North Ruin Creek, South Ruin Creek, Wells Creek, and Lick Fork add more detail. They are especially helpful when comparing the water map with the road map, because many roads bend through the same low corridors carved by streams. The connection is easiest to see near Sandy Hook, where the road network and the main river valley occupy the same broad central zone before branching into narrower side valleys.
The shaded relief reinforces that relationship. Blue stream lines occupy the lighter valleys, while short ridges rise closely on both sides. The Little Sandy River creates a more continuous low corridor than many of the smaller tributaries, but even that main valley remains hemmed in by nearby hills. This map is useful for understanding waterways and terrain together; it does not show flood zones, water depth, boating conditions, or legal water boundaries.
A 194–409 m elevation range reveals why the terrain feels so tightly folded
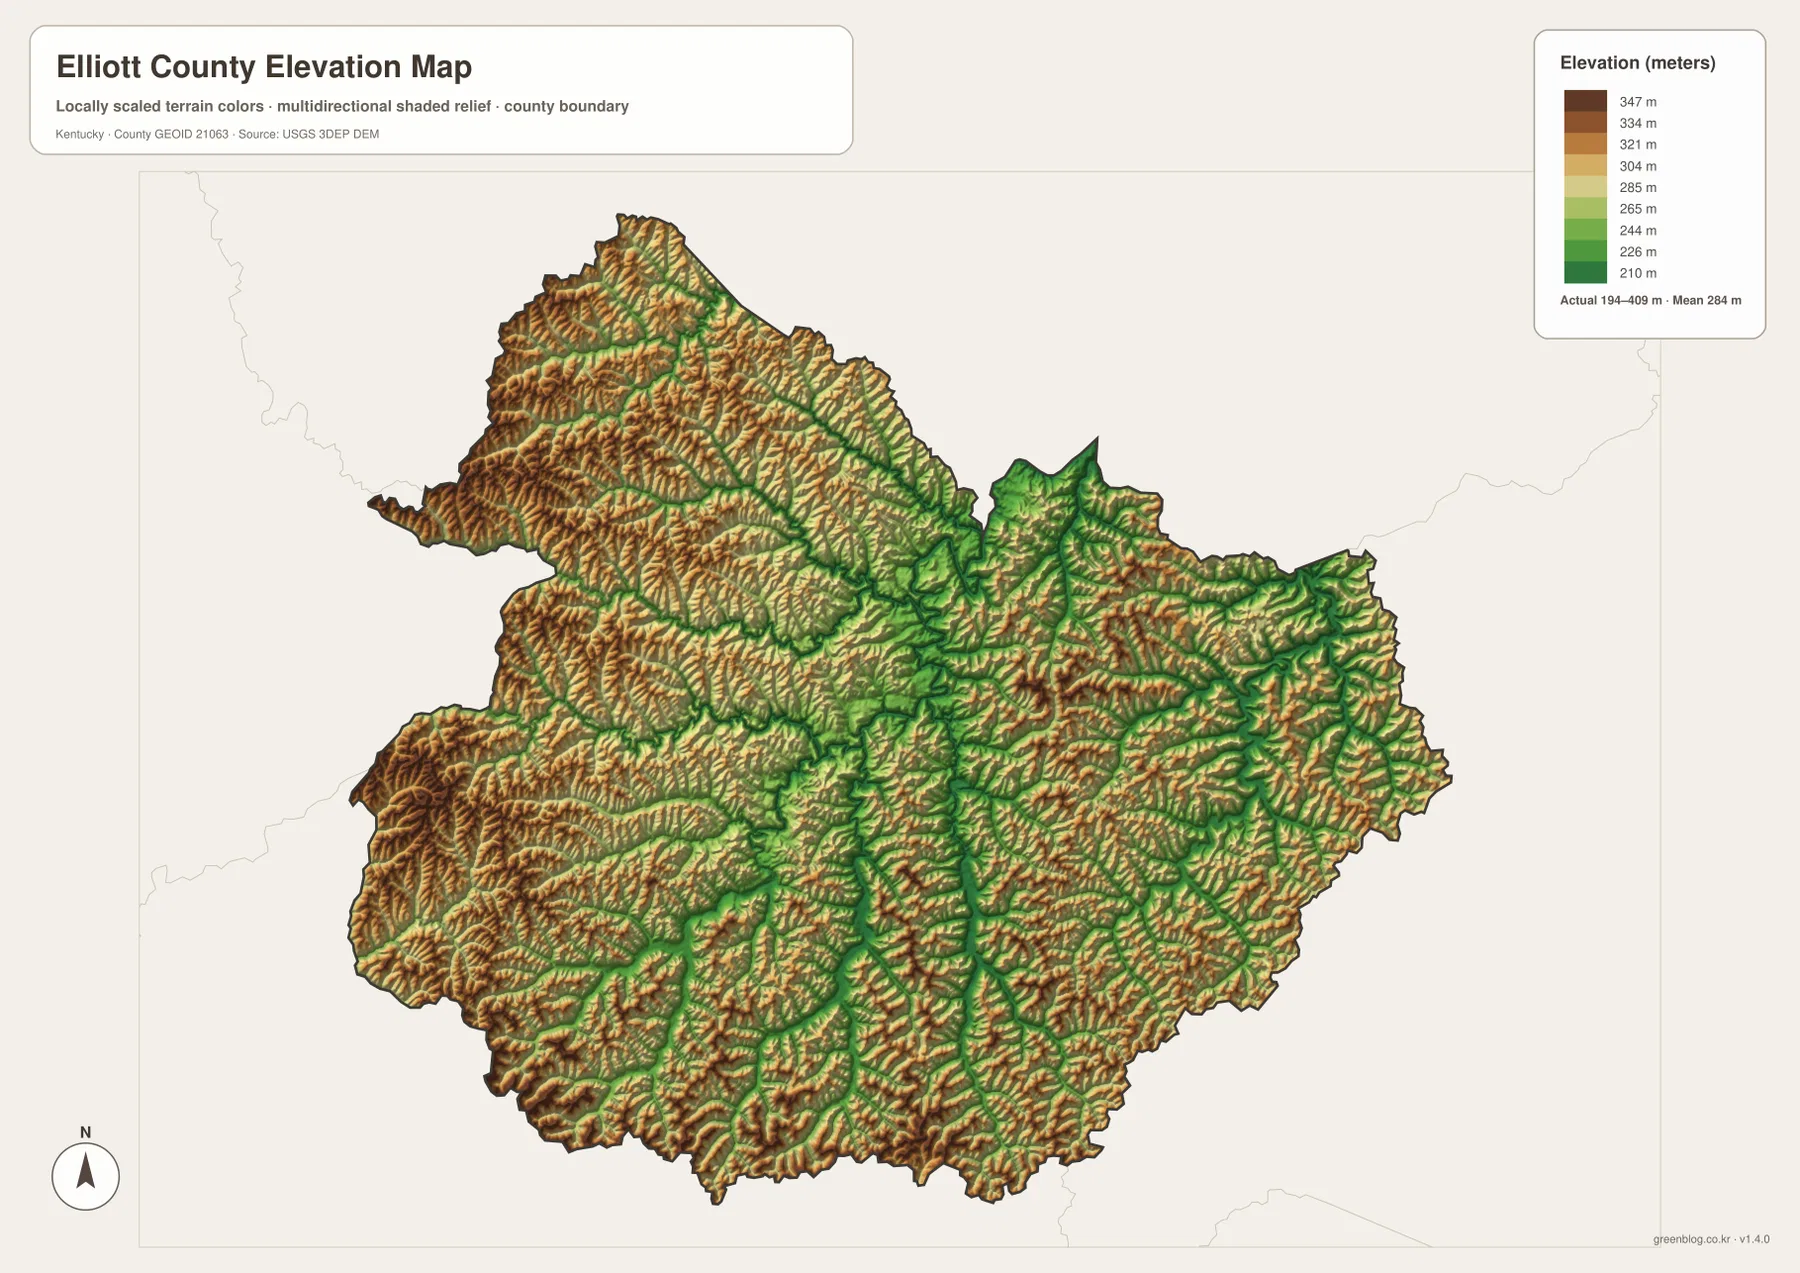
The elevation map reports an actual county range of about 194 to 409 meters, with a mean of 284 meters. Lower colors follow the Little Sandy River and several major tributary valleys, while higher bands occupy the ridges, especially across the northwestern and western portions of the county. Elliott County does not read as one isolated high mountain surrounded by flat ground; instead, low valleys and higher ridge tops repeat at short intervals across nearly the entire map.
The northwest contains a broader concentration of the higher brown shades, and similar high ridges continue through the southwest and southern edges. Green lower-elevation corridors cut inward along the streams and create long, narrow fingers between the ridges. The eastern half is also rugged, with tributary valleys separating one ridge from the next. This repeated contrast helps explain why roads often take winding paths even when two places do not look far apart on a simple county outline.
These elevation colors are best used for relative comparison at county scale. They can show that a river valley is lower than the adjoining ridge or that one part of the county contains more high ground than another. They should not be used as a precise elevation reading for a house site, road grade, drainage design, landslide assessment, or construction decision. More detailed elevation data and field measurements are required for those uses.
Choose the map by the question you are trying to answer
For roads and local orientation, the general county map is the most useful starting point. Locate Sandy Hook first, then trace KY 7 and KY 32 before moving outward to KY 556, 755, 173, 504, 649, 885, 409, 486, 706, 719, 863, or 986. If the only question is where Sandy Hook sits within Elliott County and how the county relates to its neighbors, the city map removes most of the detail and gives a cleaner regional view.
For creeks, river valleys, and the shape of the hills, the terrain-and-water map adds the most context. It places the Little Sandy River, the Little Fork Little Sandy River, and the Caney Creek system directly on shaded relief, making the relationship between water and landform visible. The elevation map is better for a quick height comparison because its 194–409 m scale turns the same landscape into clear low and high bands.
Each downloadable JPG is 3638 × 2572 pixels. The WebP images on the page are convenient for browsing, but the larger originals are better when you need to enlarge a minor road shield, read a small tributary label, compare elevation bands, or prepare a printed handout. For current travel conditions, legal boundaries, emergency information, or engineering work, use the responsible agency’s latest data in addition to these reference maps.
Frequently Asked Questions
Which map is best for tracing roads around Sandy Hook?
Use the general county map. Sandy Hook provides the clearest starting point, with KY 7 and KY 32 as the first routes to identify and KY 556, 755, and 173 among the nearby secondary routes. The city map is cleaner for broad location, but it intentionally omits much of the road detail needed for local orientation.
Where can I see how the Little Sandy River relates to the ridges?
The terrain-and-water map is the best single view because it places the Little Sandy River and its tributaries directly over shaded relief. Pair it with the elevation map to see the same valleys as lower bands between higher ridges. The county’s actual mapped elevation range is about 194–409 meters, with a mean of 284 meters.
What is included in the downloadable ZIP?
The ZIP contains high-resolution JPG originals of the county road-and-boundary map, the Sandy Hook city-location map, the terrain-and-water map, and the elevation map. Each image is 3638 × 2572 pixels, giving more space for route numbers, stream labels, and terrain detail than the WebP previews used in the article.
Map File Information
The high-resolution Elliott County JPG set includes the county road map, major-city map, terrain-and-water map, and elevation map. The originals provide more room to inspect route labels, tributary names, and elevation colors than the smaller web images.
- Included Files: county map, city map, terrain and water map, elevation map
- File Type: JPG
Related Maps
Sources and references
County background and Sandy Hook context can be checked at Elliott County Local Government and Elliott County Tourism. Boundary data are available from the U.S. Census Bureau TIGER/Line program, water data from USGS National Hydrography, and elevation data from the USGS 3D Elevation Program.
Green Map creates custom-edited map images using open geographic data sources such as geoBoundaries, Natural Earth, OpenStreetMap, and government open data. These maps are edited visual materials, not raw data files, and are provided for education, documents, presentations, and graphic reference.