Johnson County changes character quickly from the Greenwood urban area in the north to the Franklin corridor and the hillier communities farther south. This page includes a high-resolution JPG ZIP for direct download, so readers who need clearer road shields, creek labels, elevation shading, or printable copies can use the original files instead of the reduced previews. The Johnson County Indiana Map set follows U.S. 31 and I-65 through the populated north, then adds the city index, Honey and Hurricane creeks, and the higher terrain around Nineveh and Prince’s Lakes.
Greenwood and Franklin are the simplest places to use for orientation. Greenwood fills a broad area in the north, while Franklin sits farther south near the county center. New Whiteland and Whiteland occupy the corridor between them, and Bargersville lies farther west. South of Franklin, the map becomes more dispersed: Trafalgar, Nineveh, Prince’s Lakes, and Edinburgh are separated by larger rural gaps and increasingly varied terrain.
The elevation surface reveals a pattern that the road map alone does not show. The legend gives an actual Johnson County range of about 193 to 310 meters and a mean of 234 meters. The east and northwest contain broad lower green areas, while the south and southwest rise into much higher ridges cut by narrow stream valleys. A smaller elevated belt also appears in the north-central interior, so the county is not simply a smooth slope from one side to the other.
Table of Contents
Greenwood and Franklin organize the main road and settlement pattern
The general map makes Greenwood the strongest northern reference. The city has the largest developed footprint, and the Greenwood Police Department label helps identify its center. Kindred Hospital Indianapolis South appears near the northeastern side. U.S. 31 continues south through the New Whiteland–Whiteland corridor toward Franklin, while I-65 runs farther east on a parallel north-south path. Together, those two routes make the northern and central parts of the county easy to organize.
Franklin is the county seat and provides a second major reference near the middle of Johnson County. U.S. 31 passes through the city, Route 44 crosses it from west to east, and Route 144 approaches from the Bargersville side. Johnson Memorial Hospital and the Franklin Police Department are labeled within the developed area. Greenwood is the larger northern urban center, but Franklin is the point from which the southern half of the county becomes easier to place.
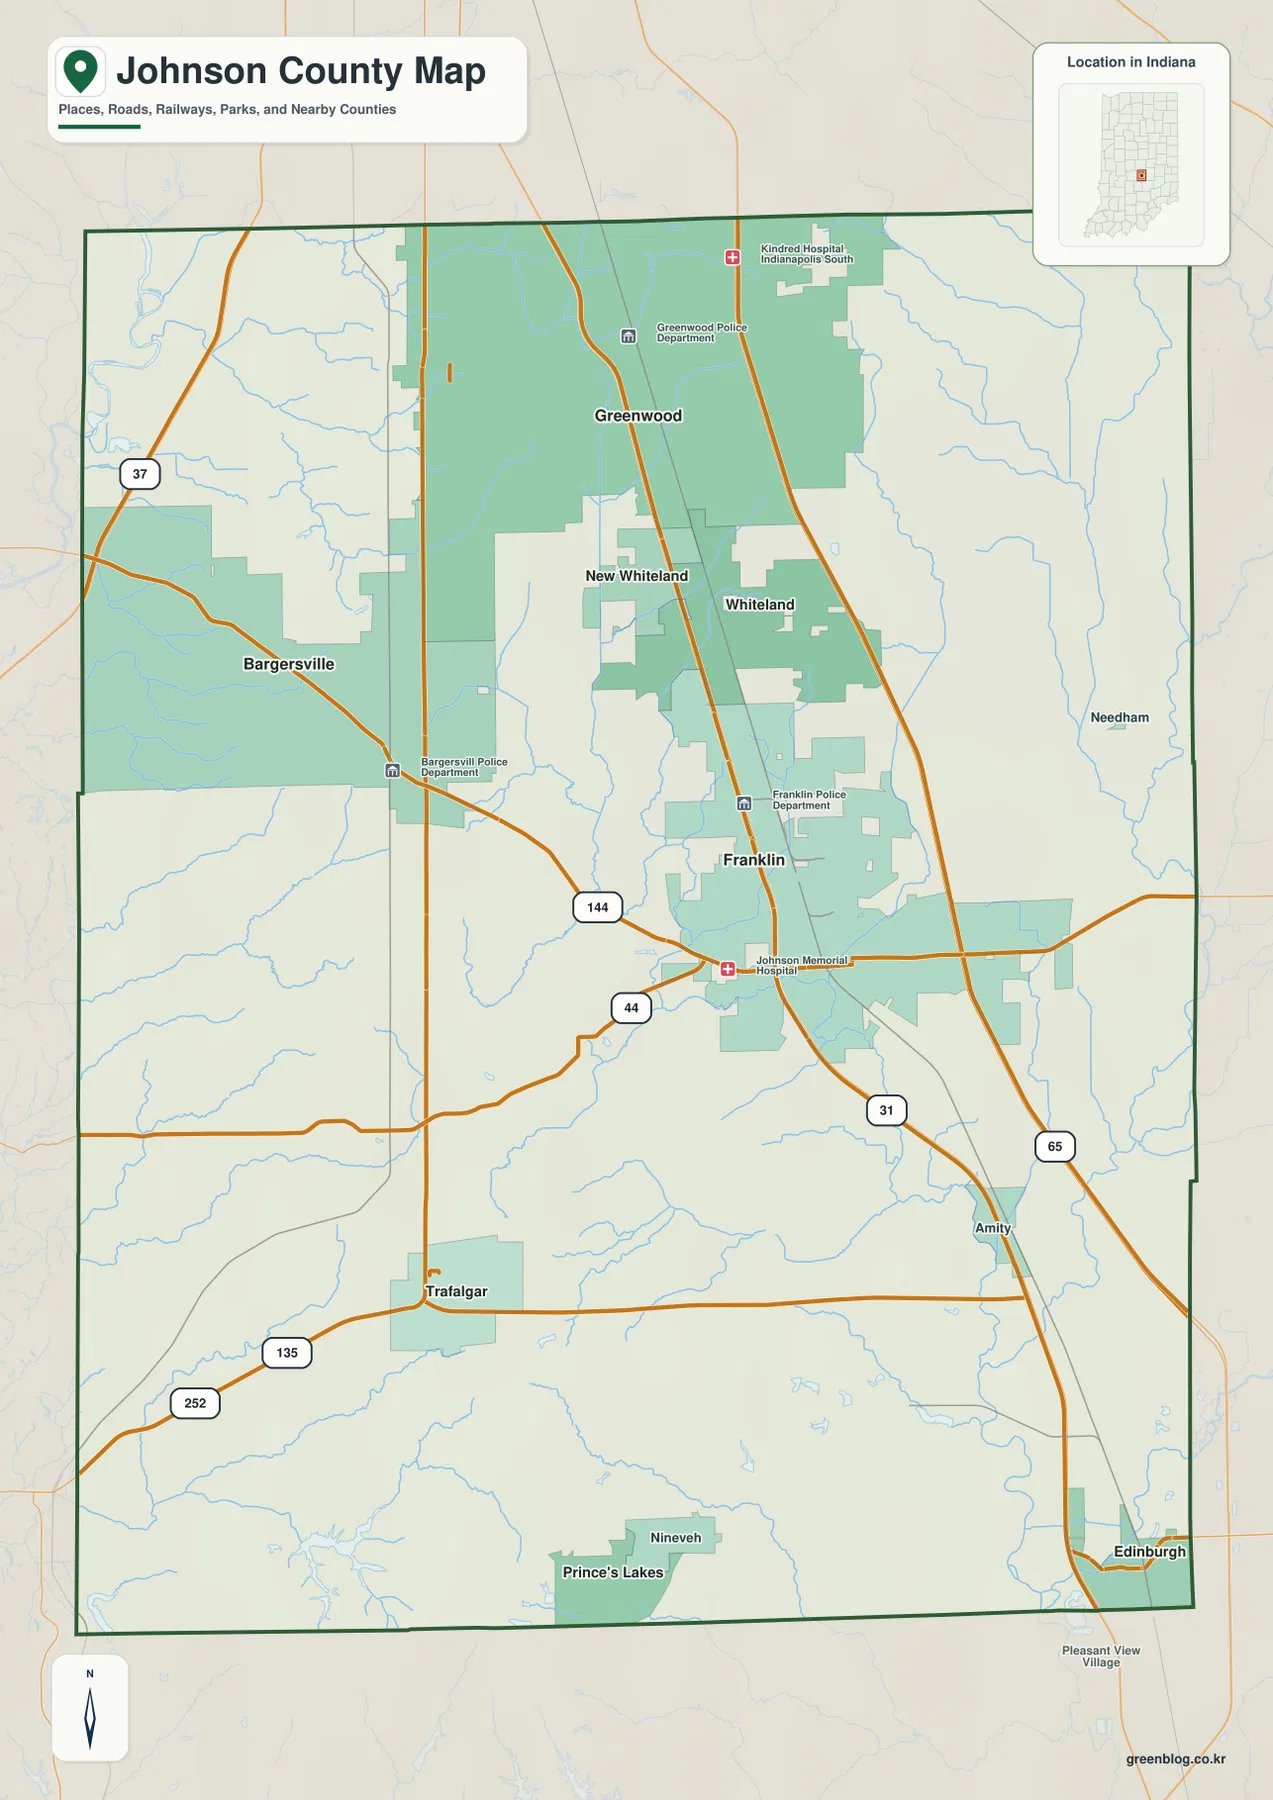
Bargersville sits west of the U.S. 31 corridor, with Route 144 connecting the area toward Franklin. Route 37 is visible farther west and provides another north-south reference. The spaces around Bargersville contain more open land and creek lines than the continuous developed areas around Greenwood, so the map changes quickly from urban to rural across the northern half.
The southern part of the map is anchored by Trafalgar, Nineveh, Prince’s Lakes, and Edinburgh. Routes 135 and 252 help locate Trafalgar and the southwest, while U.S. 31 continues toward Edinburgh at the southeastern edge. Amity lies east of the Franklin–Trafalgar area. These communities are more widely separated than the northern cities, and the elevation map shows why the south has a different physical character as well.
The city index highlights Greenwood and Franklin while showing a tight northern cluster
Six places appear on the city index, with Greenwood carrying the largest printed value at 66,029. Franklin follows at 26,168 and Bargersville at 10,752, while New Whiteland, Whiteland, and Edinburgh are labeled 5,704, 5,173, and 4,381. Those numbers belong to the supplied map and should not be substituted for a current population table without checking the latest official statistics. For this page, the index is most useful as a clean visual comparison of where the six highlighted cities sit and how strongly Greenwood stands out from the rest.
| Rank | City | Value printed on map | Position |
|---|---|---|---|
| 1 | Greenwood | 66,029 | North |
| 2 | Franklin | 26,168 | Central |
| 3 | Bargersville | 10,752 | West / northwest-central |
| 4 | New Whiteland | 5,704 | North-central |
| 5 | Whiteland | 5,173 | North-central/east |
| 6 | Edinburgh | 4,381 | Southeast |
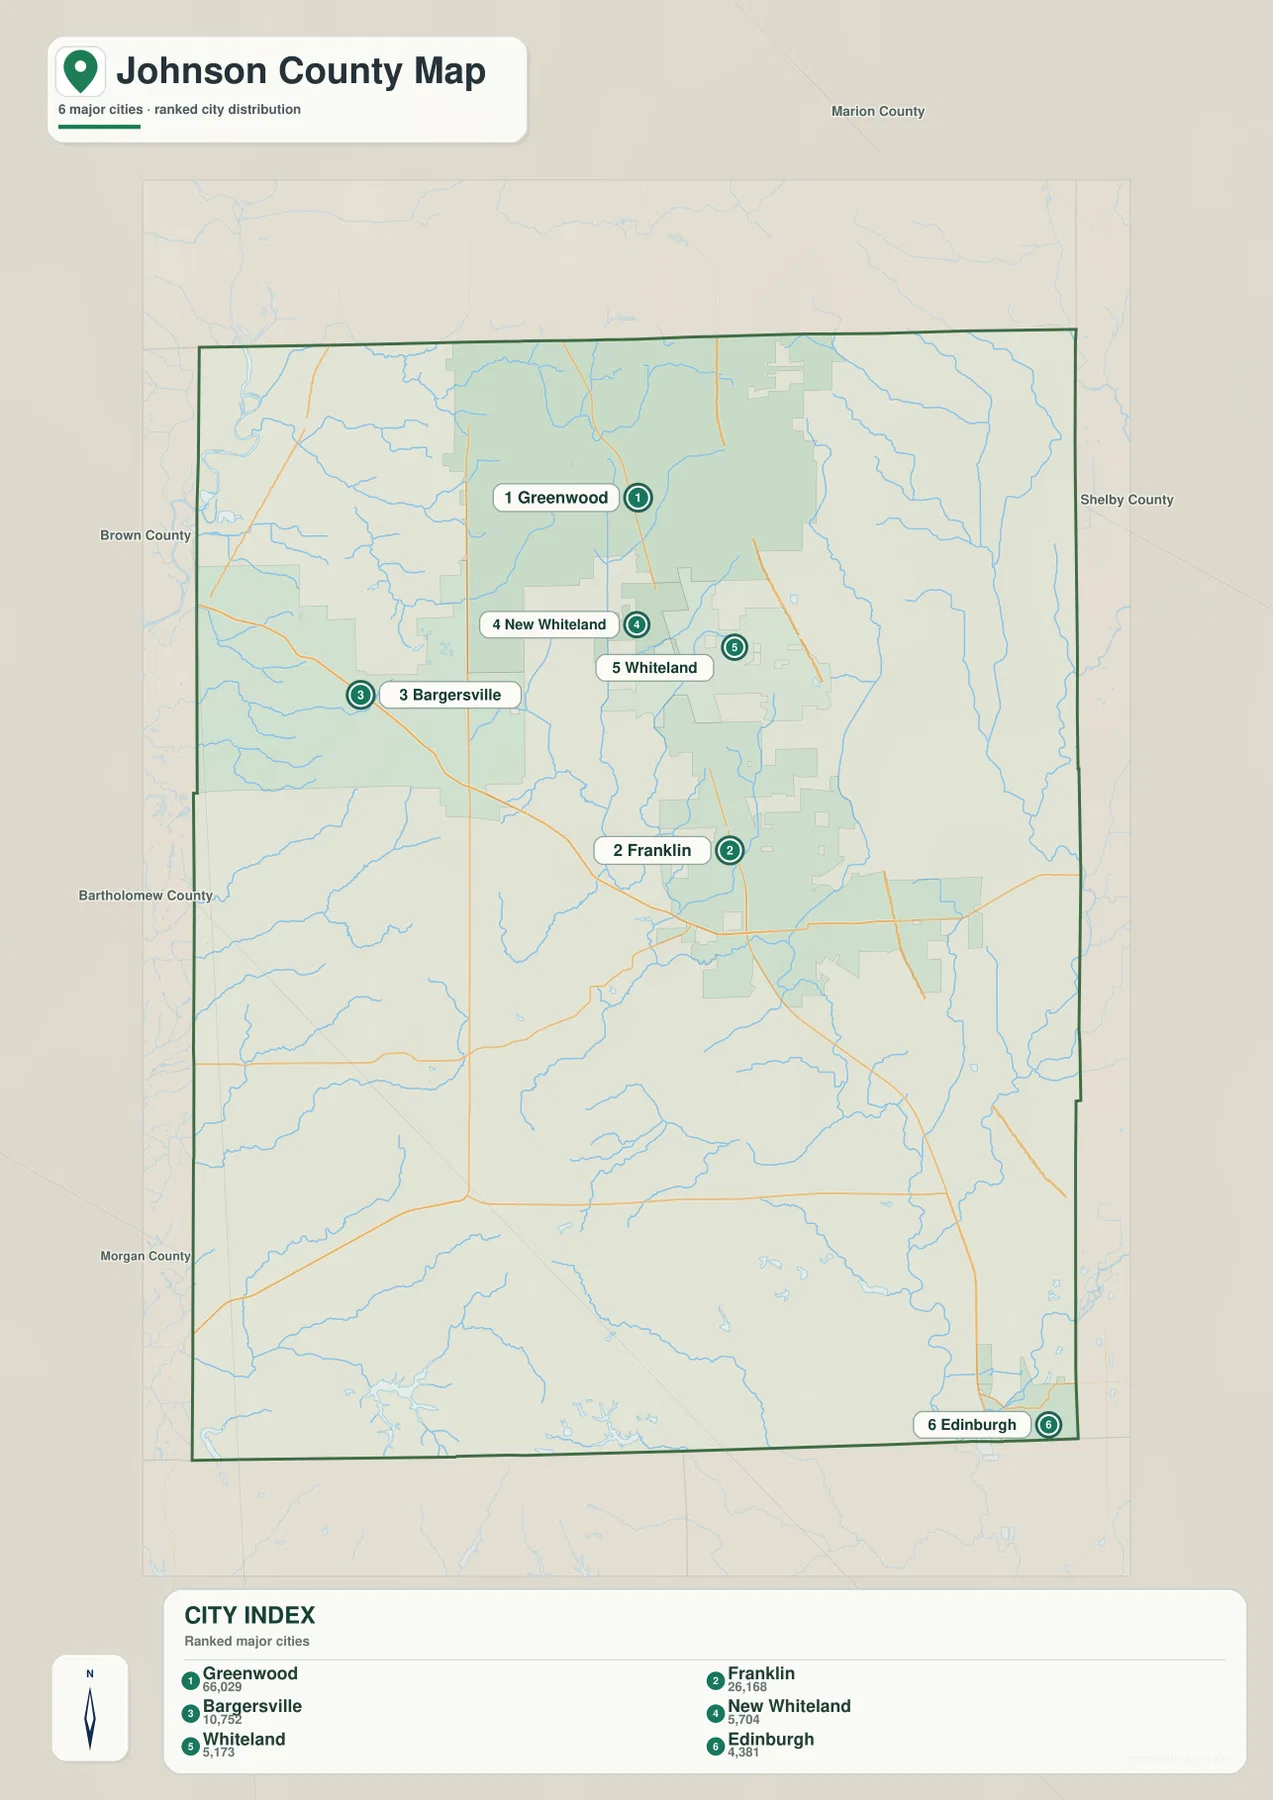
Greenwood, New Whiteland, and Whiteland occupy a relatively compact part of the northern half, while Franklin sits distinctly farther south. Bargersville extends the urban pattern westward away from the U.S. 31 corridor. Edinburgh is the only highlighted city close to the southern county edge, making it useful for understanding Johnson County’s north-south span.
Trafalgar, Nineveh, Prince’s Lakes, Amity, Needham, and other local names remain visible on the general map even though the index narrows its attention to six cities. That difference is intentional: the general map is the better choice for tracing roads, locating smaller communities, and understanding the county outline, while the index strips away detail to emphasize the selected urban places. Anyone using the printed values for demographic analysis should verify them against a current official population source rather than treating the index as a live statistical table.
Honey and Hurricane creeks divide the north and east while small lakes cluster in the south
Honey Creek is the clearest northwestern water reference on the terrain-and-water map. It enters from the west and bends repeatedly through the northwest, collecting several smaller tributaries. Grassy Creek lies farther east and follows a more north-south path. Once Greenwood and Bargersville have been located on the general map, these streams help organize the northern drainage pattern without relying on road labels.
Hurricane Creek is the strongest eastern stream reference. It runs south through the eastern half, while Youngs Creek approaches across the central-east and connects with the same broad drainage area. Sugar Creek continues farther south along the eastern side. Together, these streams create a sequence of lower valleys east of Franklin and toward the Edinburgh side of the county.
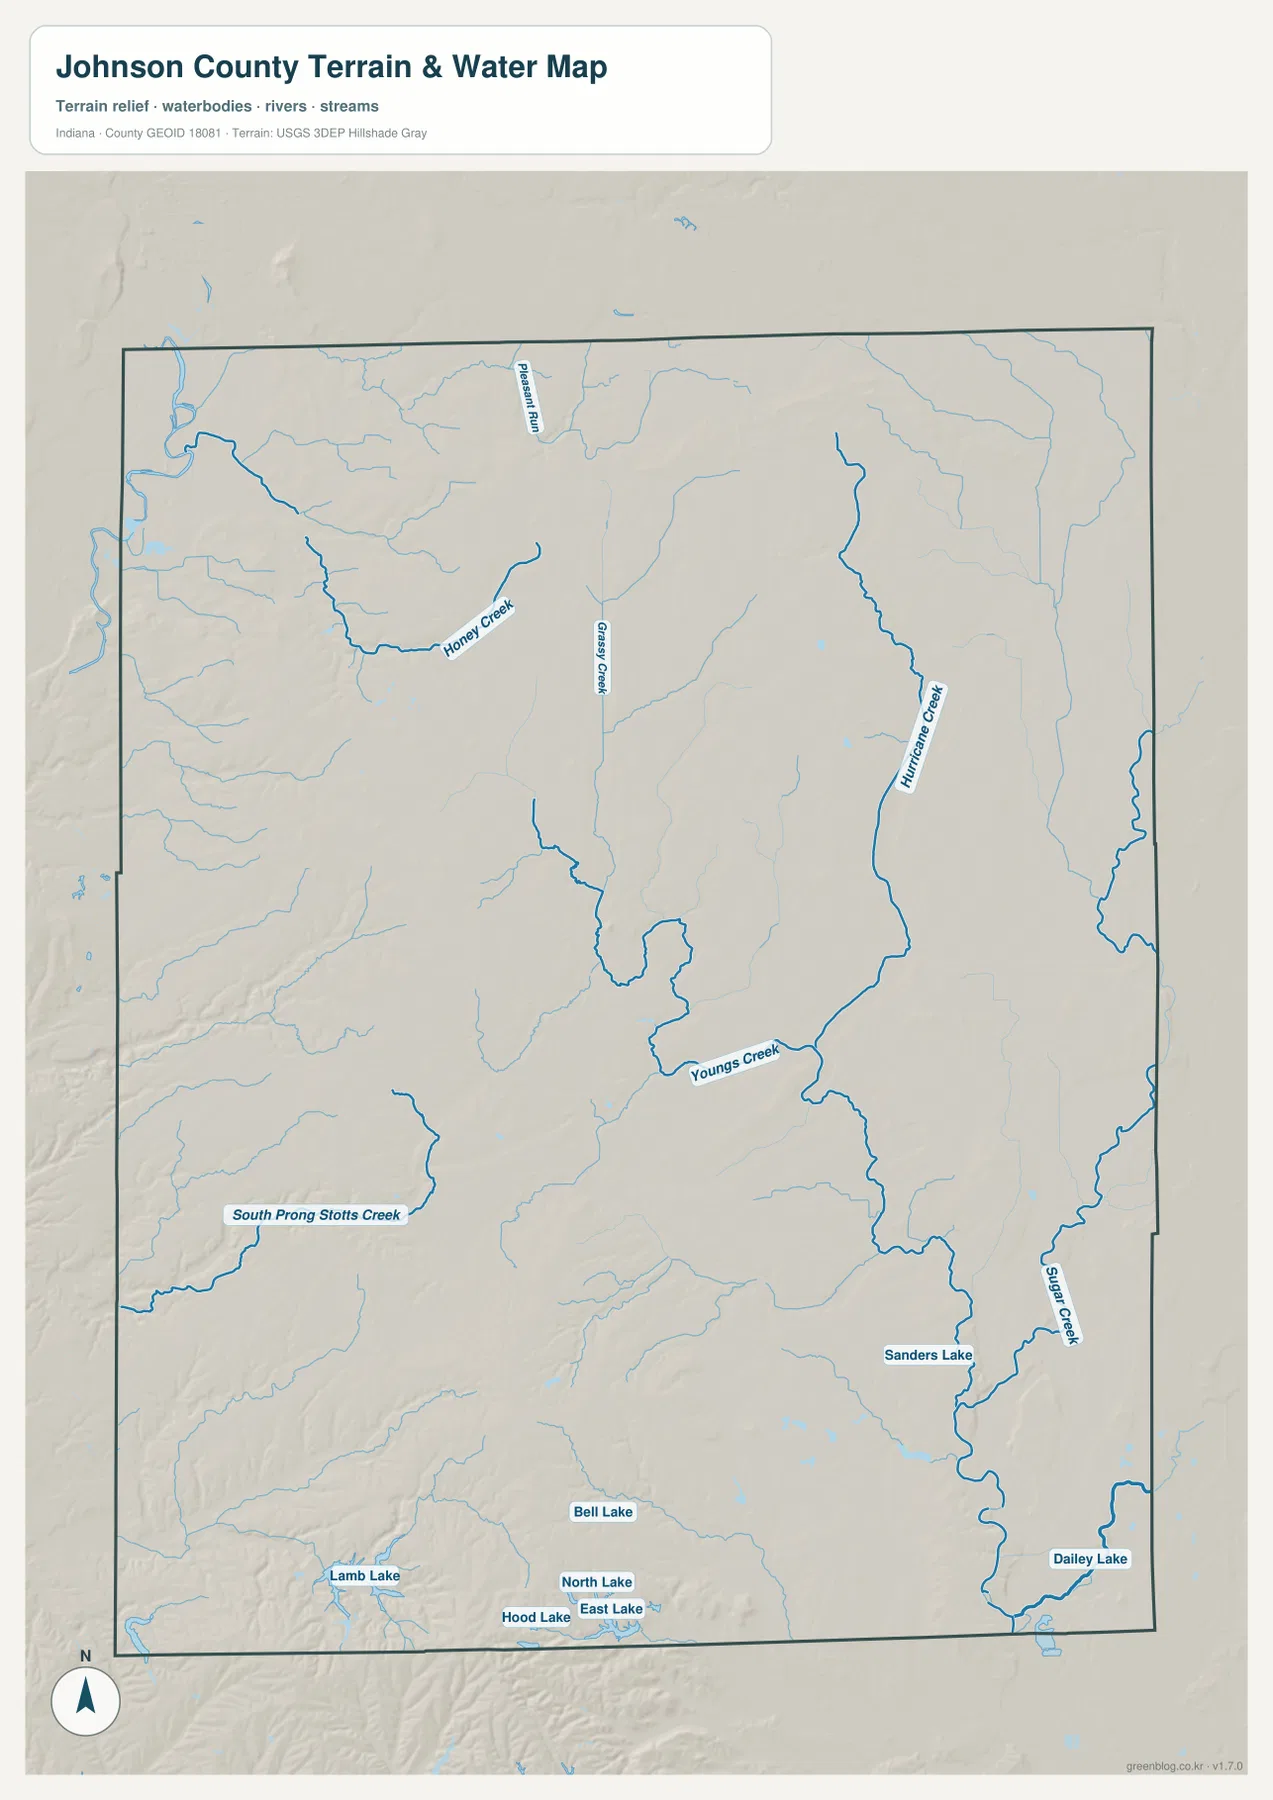
South Prong Stotts Creek provides a long southwestern reference. The surrounding terrain is more dissected than the broad eastern lowlands, and short tributaries wind between ridges. Around the Trafalgar–Nineveh side of the county, the terrain shading makes it clear that the streams are following narrow valleys rather than a flat open surface.
Several small lakes are labeled across the south. Lamb Lake, Hood Lake, East Lake, North Lake, and Bell Lake form a cluster toward the south-central and southwestern area, while Sanders Lake and Dailey Lake lie farther east. These are local landmarks rather than county-scale reservoirs, but they are useful for orienting the southern terrain when city and road labels are absent.
The blue stream and lake features are useful for locating Johnson County’s drainage network, but they should not be read as regulatory or real-time water information. Floodplain limits, legal channel boundaries, navigability, water levels, water quality, and parcel lines all require separate current sources from the responsible agencies. On this page, the water layer is used to place Honey Creek, Hurricane Creek, the southern tributaries, and the small lake group in relation to the surrounding terrain.
The 193–310 m elevation surface contrasts southern hills with lower eastern and northwestern ground
The elevation legend gives an actual Johnson County range of about 193 to 310 meters and a mean of 234 meters. Greens mark lower terrain, while yellow, tan, and brown indicate higher ground. Much of the eastern side is low and green, and the northwest also contains broad lower areas. The south and southwest, however, rise into the strongest hill country on the map.
The southern uplands are not one smooth plateau. Around the Nineveh–Prince’s Lakes side and farther west, dark brown ridges are separated by narrow green creek valleys. The terrain becomes more deeply cut south of Trafalgar than it is around Greenwood and Franklin. That difference helps explain why the southern map looks much more textured even though the county does not contain mountain-scale elevations.
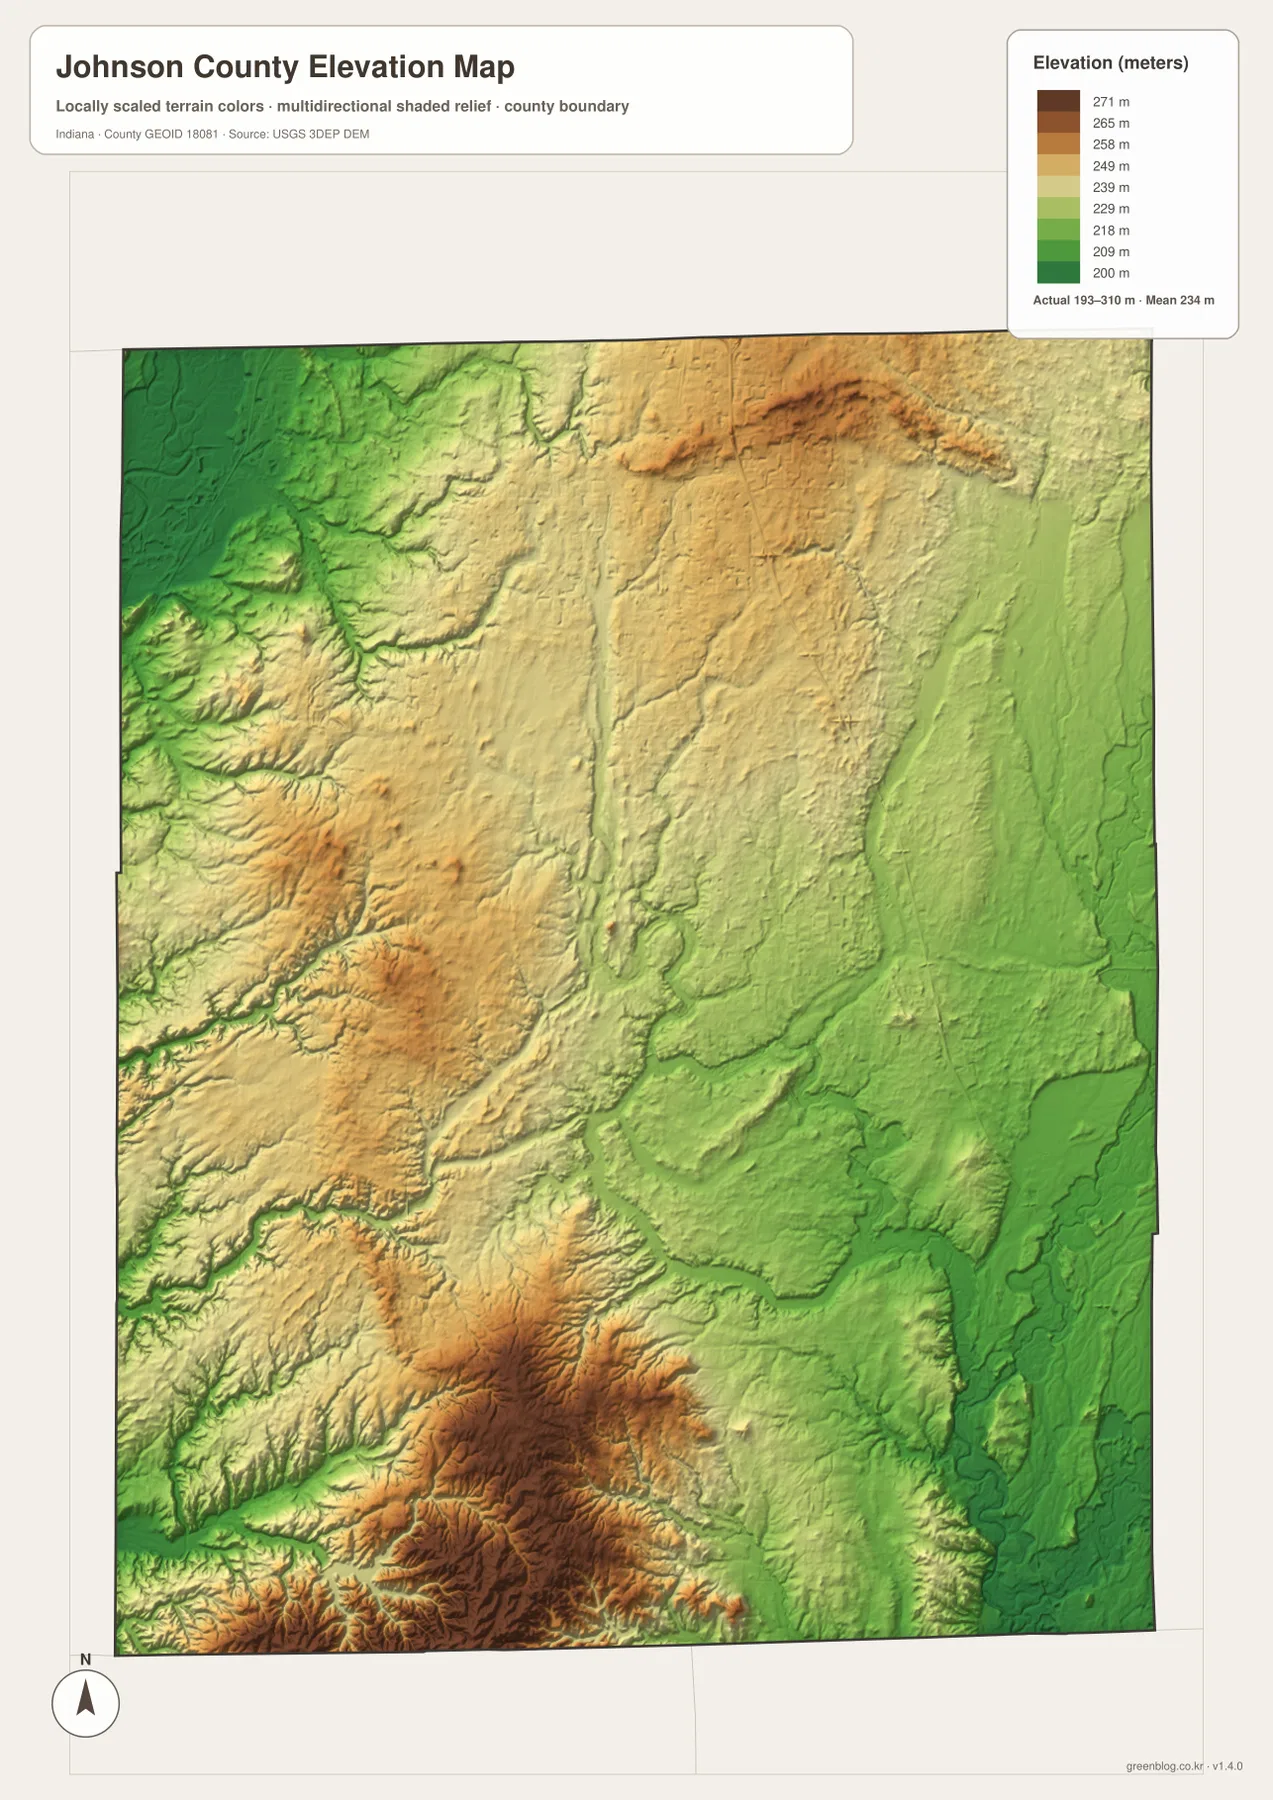
A smaller elevated belt appears through the north-central interior. It is not as rugged as the southern hills, but it breaks up the idea that the entire Greenwood–Franklin side is flat. Honey Creek and nearby tributaries occupy lower cuts through this higher surface, creating local relief within the northern developed half.
The east remains lower overall, with Hurricane Creek and Sugar Creek occupying some of the clearest low corridors. From east of Franklin toward Edinburgh, the terrain changes more gradually than it does across the southern hill belt. A useful first reading is to separate Johnson County into the northern urban corridor, southern hill country, and eastern creek lowlands before looking at smaller local ridges.
The elevation colors summarize relief across the county as a whole; they are not precise spot elevations for a house lot, roadway, or construction design. Work that depends on exact grades or drainage should use the underlying elevation dataset or a professional survey rather than estimating from this image. USGS 3D Elevation Program data can provide a more appropriate source for detailed terrain work, while the map here is meant to show the broad contrast between Johnson County’s southern hills, lower creek corridors, and gentler northern and eastern ground.
Start with Greenwood and Franklin, then compare the creek valleys with the southern hills
For first-time orientation, begin with the general map. Find Greenwood and Franklin, then place New Whiteland, Whiteland, and Bargersville between and beside them. Continue south toward Trafalgar, Nineveh, Prince’s Lakes, and Edinburgh. U.S. 31 and I-65 provide the clearest north-south framework, while Routes 144 and 44 help organize the Franklin area.
Use the city index when the main question is how the six highlighted cities compare. Greenwood and Franklin dominate the printed values, Bargersville extends the pattern westward, New Whiteland and Whiteland sit close together in the north, and Edinburgh provides the southern reference. For any present-day population comparison, check a current official dataset instead of treating the printed index as a live count.
For physical geography, locate Honey Creek and Hurricane Creek first, then follow Youngs Creek and Sugar Creek toward the east and south. Open the elevation map beside the water map and look for those streams as lower green corridors. In the southwest, compare South Prong Stotts Creek with the much higher terrain around the southern ridge belt. That side-by-side view makes the county’s internal terrain differences much easier to understand.
The on-page WebP versions are reduced for faster browsing, so the smallest creek names and road shields can be difficult to inspect at normal page size. The downloadable archive provides the county/general, city index, terrain-and-water, and elevation maps as four 2572×3638-pixel JPG originals. Use those full-size files for close zooming, larger prints, classroom displays, or detailed side-by-side comparison.
One practical way to combine the files is to keep a few fixed landmarks as you change views. Start with Greenwood and Franklin on the road map, use the city index to see how their scale compares with the other highlighted cities, and then match Honey Creek and Hurricane Creek on the water layer. Moving to the elevation image at those same locations shows how the lower eastern corridors differ from the ridged south, linking the separate map themes without relying on repeated generic descriptions.
Frequently Asked Questions
Which cities have the largest values on the supplied city index?
Greenwood is shown at 66,029, followed by Franklin at 26,168 and Bargersville at 10,752. New Whiteland and Whiteland are smaller northern entries, while Edinburgh is the southern highlighted city. The FAQ repeats the map values only for orientation; up-to-date population figures should come from a current official source.
Which waterways are easiest to recognize on the Johnson County map?
Honey Creek is a strong northwestern reference, Grassy Creek lies farther east, and Hurricane Creek runs through the eastern half. Youngs Creek and Sugar Creek provide additional central-eastern and southeastern references, while South Prong Stotts Creek crosses the southwest. The map is intended for geographic reference and should not be used to determine flood risk or legal water boundaries.
Can the 193–310 m elevation range be used as an exact property elevation?
No. The supplied elevation map gives a county-wide range of about 193 to 310 meters, with a mean of 234 meters. It is intended to compare broad lowlands, stream valleys, and the higher southern hills. Parcel-level elevations, construction grades, and drainage calculations need source data or a qualified survey rather than this county-scale rendering.
Map File Information
This ZIP contains the Johnson County general map, city index map, terrain-and-water map, and elevation map as high-resolution JPG originals for enlarged viewing and printing.
- File Type: ZIP containing four 2572×3638px JPG files
Related Maps
Sources and References
The article is based primarily on the supplied Johnson County map set and asset manifest. The references below cover Johnson County government context together with the boundary, water, and elevation datasets used for geographic cross-checking.
- Johnson County, Indiana – official county government information
- IN.gov Counties – official state county information, including Franklin as the county seat and the county’s cities and towns
- U.S. Census Bureau TIGER/Line Shapefiles – county boundary and base-geography files
- USGS National Hydrography – stream and water-network reference
- USGS 3D Elevation Program – source elevation coverage for detailed terrain work
Green Map creates custom-edited map images using open geographic data sources such as geoBoundaries, Natural Earth, OpenStreetMap, and government open data.
These maps are edited visual materials, not raw data files, and are provided for education, documents, presentations, and graphic reference.