Birth registration records a child’s birth in the official civil system and is a basic component of legal identity. World Bank series SP.REG.BRTH.Q2.ZS does not measure all children under five. It measures birth registration among children living in households in the second wealth quintile, Q2. When households are divided into five relative wealth groups, Q2 is the group immediately above the poorest 20%, roughly the 20th-to-40th-percentile range within each country.
The retained country-level table contains 105 latest non-missing observations dated from 2006 to 2021. The median is 83.2% and the unweighted mean is 71.6%. The years are not synchronized, so this should not be described as a 2021 global ranking simply because 2021 is the maximum year in the table.
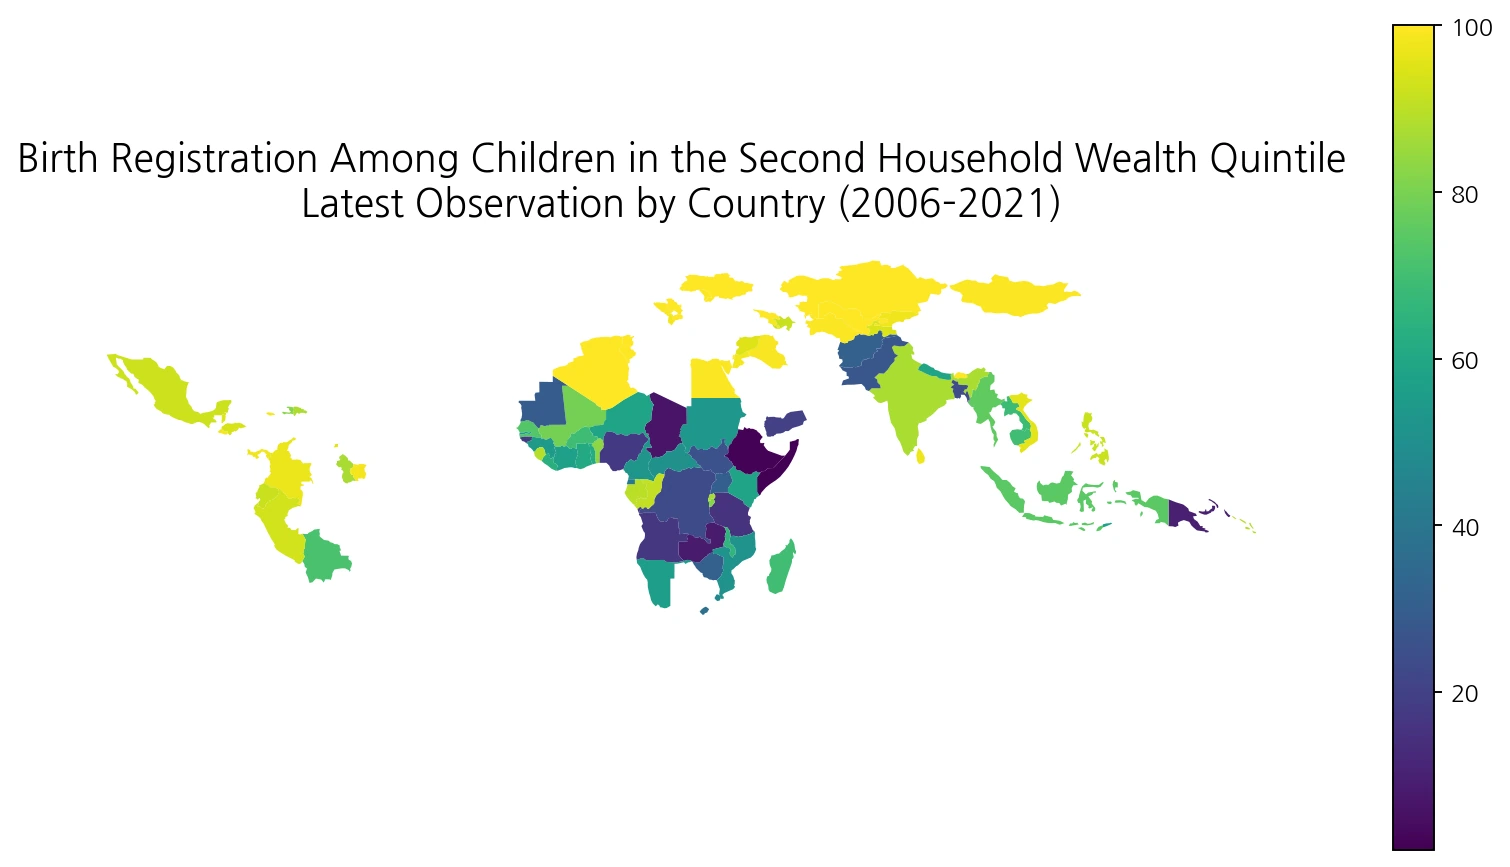
Table of Contents
Q2 is the second-lowest 20% group, not the bottom 40% combined
Households are ordered from Q1, the lowest wealth quintile, through Q5, the highest. Q2 is the second group: it excludes the poorest 20% and covers the next 20% of households in the national wealth distribution. Calling Q2 “the bottom 40%” would be too broad because that combined group would include both Q1 and Q2.
In DHS and MICS-type surveys, wealth quintiles are often constructed from a household wealth index based on assets and living conditions rather than one directly reported monthly income figure. The ranking is relative within each country, so a Q2 household in one country does not necessarily have the same absolute income or assets as a Q2 household elsewhere.
Registration includes caregiver reports, not only certificates seen
The World Bank’s general birth-registration definition is the percentage of children under age five whose births were registered at the time of the survey. The numerator includes children whose birth certificate was seen by the interviewer and children whose mother or caretaker reported that the birth had been registered. The measure is therefore broader than the share of children for whom a certificate could physically be produced during the interview.
Birth registration is foundational for legal identity, but the percentage does not by itself prove access to school, health care, social protection, or other services. A low rate also cannot be attributed to household wealth alone. Administrative distance, registration procedures, conflict, mobility, awareness, and survey design can all matter.
The median latest Q2 observation is 83.2%
Across the 105 observations, the median is 83.2% and the unweighted mean is 71.6%. 45 observations are at least 90%, while 46 are below 75%. 22 are below 50%, including 12 below 25%. The same wealth group therefore ranges from near-universal registration in some countries to very low coverage in others.
| Q2 birth-registration rate | Countries/economies | Share of 105 |
|---|---|---|
| Below 25% | 12 | 11.4% |
| 25% to <50% | 10 | 9.5% |
| 50% to <75% | 24 | 22.9% |
| 75% to <90% | 14 | 13.3% |
| 90% to <95% | 13 | 12.4% |
| 95% to <99% | 13 | 12.4% |
| 99% to <100% | 16 | 15.2% |
| 100% | 3 | 2.9% |
The 71.6% mean is not a population-weighted global rate for children in Q2 households. Each country or separately reported economy contributes one observation regardless of population size. A true global child-level percentage would require the number of Q2 children in each country and the appropriate survey weights.
The lowest latest observations are Somalia, Ethiopia, and Chad
The lowest retained observations are Somalia at 1.0% in 2006, Ethiopia at 1.4% in 2016, and Chad at 6.4% in 2015. Zambia is 8.3% in 2018, Papua New Guinea 9.7% in 2018, Tanzania 15.2% in 2016, Angola 16.6% in 2016, and Nigeria 17.5% in 2013. Guinea-Bissau is 18.3%, Yemen 20.2%, and the Democratic Republic of the Congo 23.3%.
| Country/economy | Observation year | Q2 birth registration |
|---|---|---|
| Somalia, Fed. Rep. | 2006 | 1.0% |
| Ethiopia | 2016 | 1.4% |
| Chad | 2015 | 6.4% |
| Zambia | 2018 | 8.3% |
| Papua New Guinea | 2018 | 9.7% |
| Tanzania | 2016 | 15.2% |
| Angola | 2016 | 16.6% |
| Nigeria | 2013 | 17.5% |
| Guinea-Bissau | 2014 | 18.3% |
| Yemen, Rep. | 2013 | 20.2% |
| Congo, Dem. Rep. | 2014 | 23.3% |
| Bangladesh | 2018 | 23.5% |
| South Sudan | 2010 | 25.4% |
| Pakistan | 2018 | 27.3% |
| Mauritania | 2021 | 29.6% |
The year column matters as much as the percentage. Somalia’s figure is from 2006, while Zambia and Papua New Guinea are from 2018. The table should therefore be read as a latest-available-observation comparison, not a current league table.
Among observations dated 2018–2021, Zambia and Papua New Guinea are below 10%
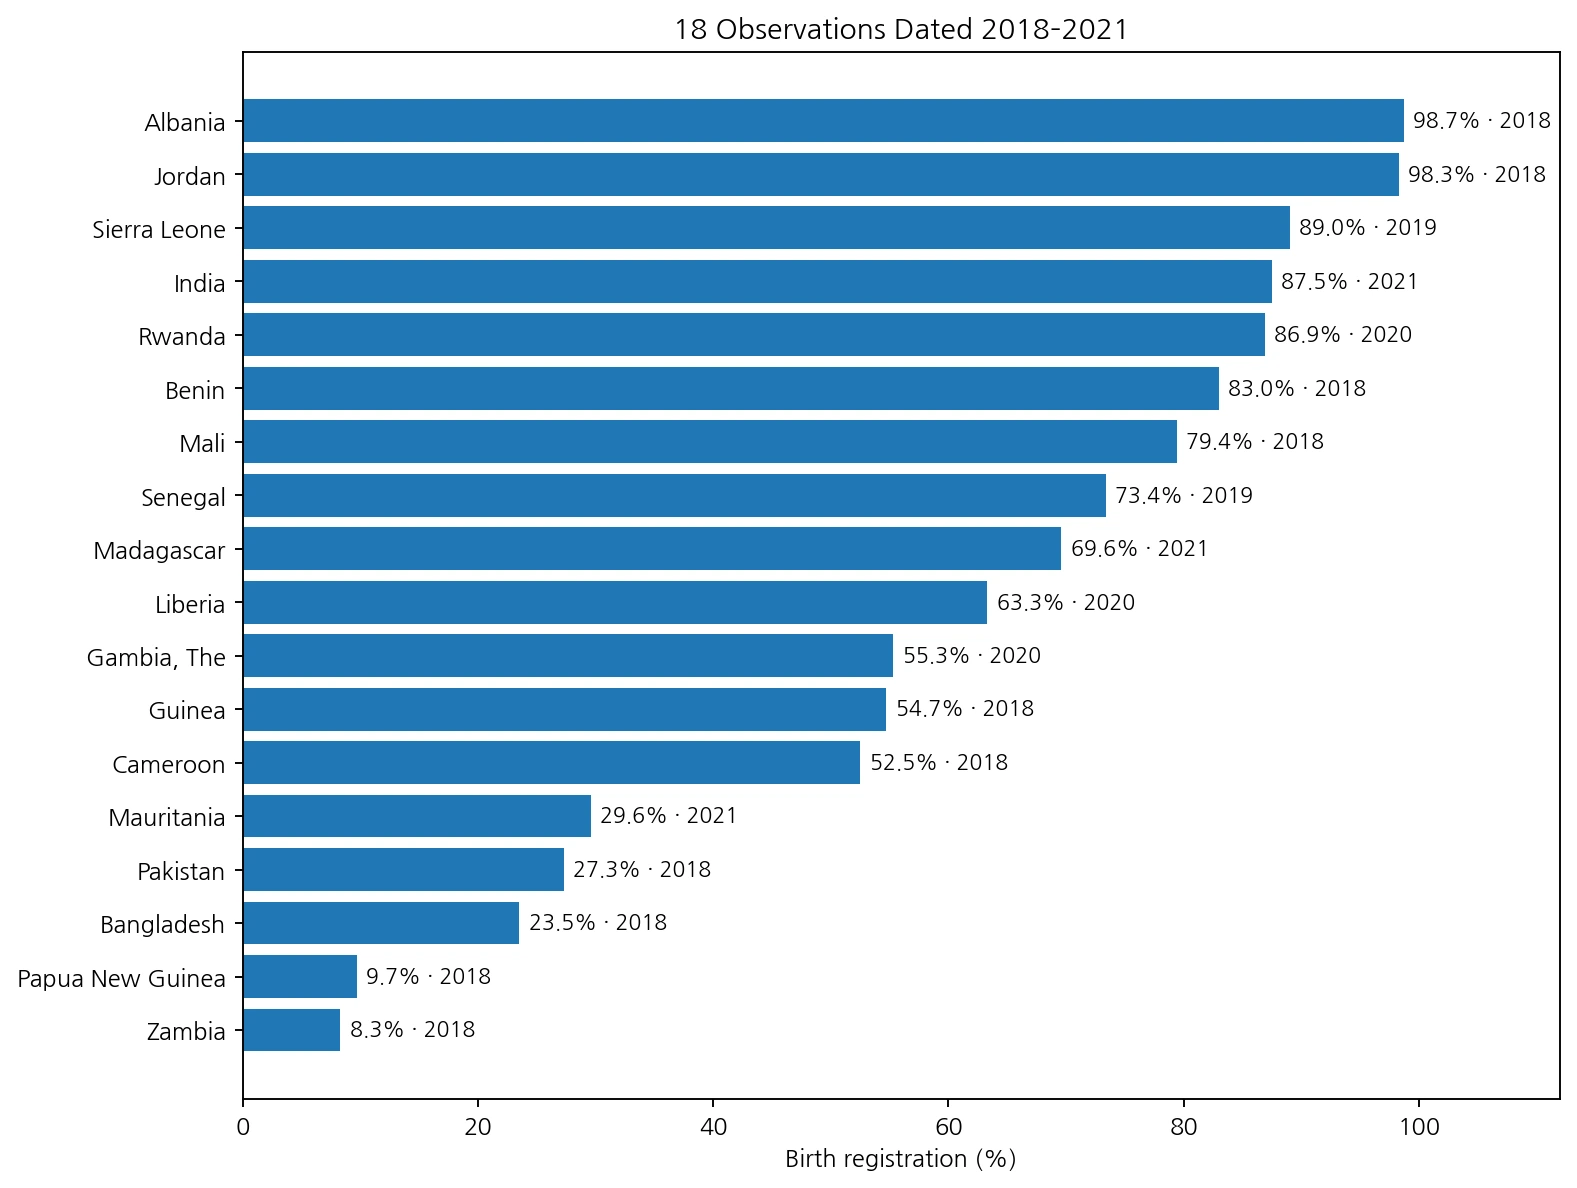
Restricting the data to 2018–2021 leaves 18 countries. The median in this subset is 66.4% and the unweighted mean is 60.6%. Zambia is lowest at 8.3%, followed by Papua New Guinea at 9.7%, Bangladesh at 23.5%, Pakistan at 27.3%, and Mauritania at 29.6%.
| Country/economy | Observation year | Q2 birth registration |
|---|---|---|
| Zambia | 2018 | 8.3% |
| Papua New Guinea | 2018 | 9.7% |
| Bangladesh | 2018 | 23.5% |
| Pakistan | 2018 | 27.3% |
| Mauritania | 2021 | 29.6% |
| Cameroon | 2018 | 52.5% |
| Guinea | 2018 | 54.7% |
| Gambia, The | 2020 | 55.3% |
| Liberia | 2020 | 63.3% |
| Madagascar | 2021 | 69.6% |
| Senegal | 2019 | 73.4% |
| Mali | 2018 | 79.4% |
| Benin | 2018 | 83.0% |
| Rwanda | 2020 | 86.9% |
| India | 2021 | 87.5% |
| Sierra Leone | 2019 | 89.0% |
| Jordan | 2018 | 98.3% |
| Albania | 2018 | 98.7% |
At the upper end of this recent subset, Albania is 98.7%, Jordan 98.3%, Sierra Leone 89.0%, India 87.5%, and Rwanda 86.9%. Narrowing the time window reduces the influence of old observations, but it also reduces geographic coverage to only 18 countries.
Q3 is higher than Q2 in 84 of 105 matched countries
Matching Q2 with the middle wealth quintile, Q3, for the same country and survey year produces 105 pairs. Q3 is higher than Q2 in 84 countries, equal in 3, and lower in 18. The median Q3-minus-Q2 difference is 2.3 percentage points.
The fact that Q3 is higher in most matched countries is consistent with a socioeconomic gradient in birth registration, but the ordering is not perfectly monotonic in every survey. Sampling variability, rounding, survey design, geographic composition, and real local patterns can all produce small reversals between adjacent wealth groups.
The wealthiest quintile is higher than Q2 in 90 countries
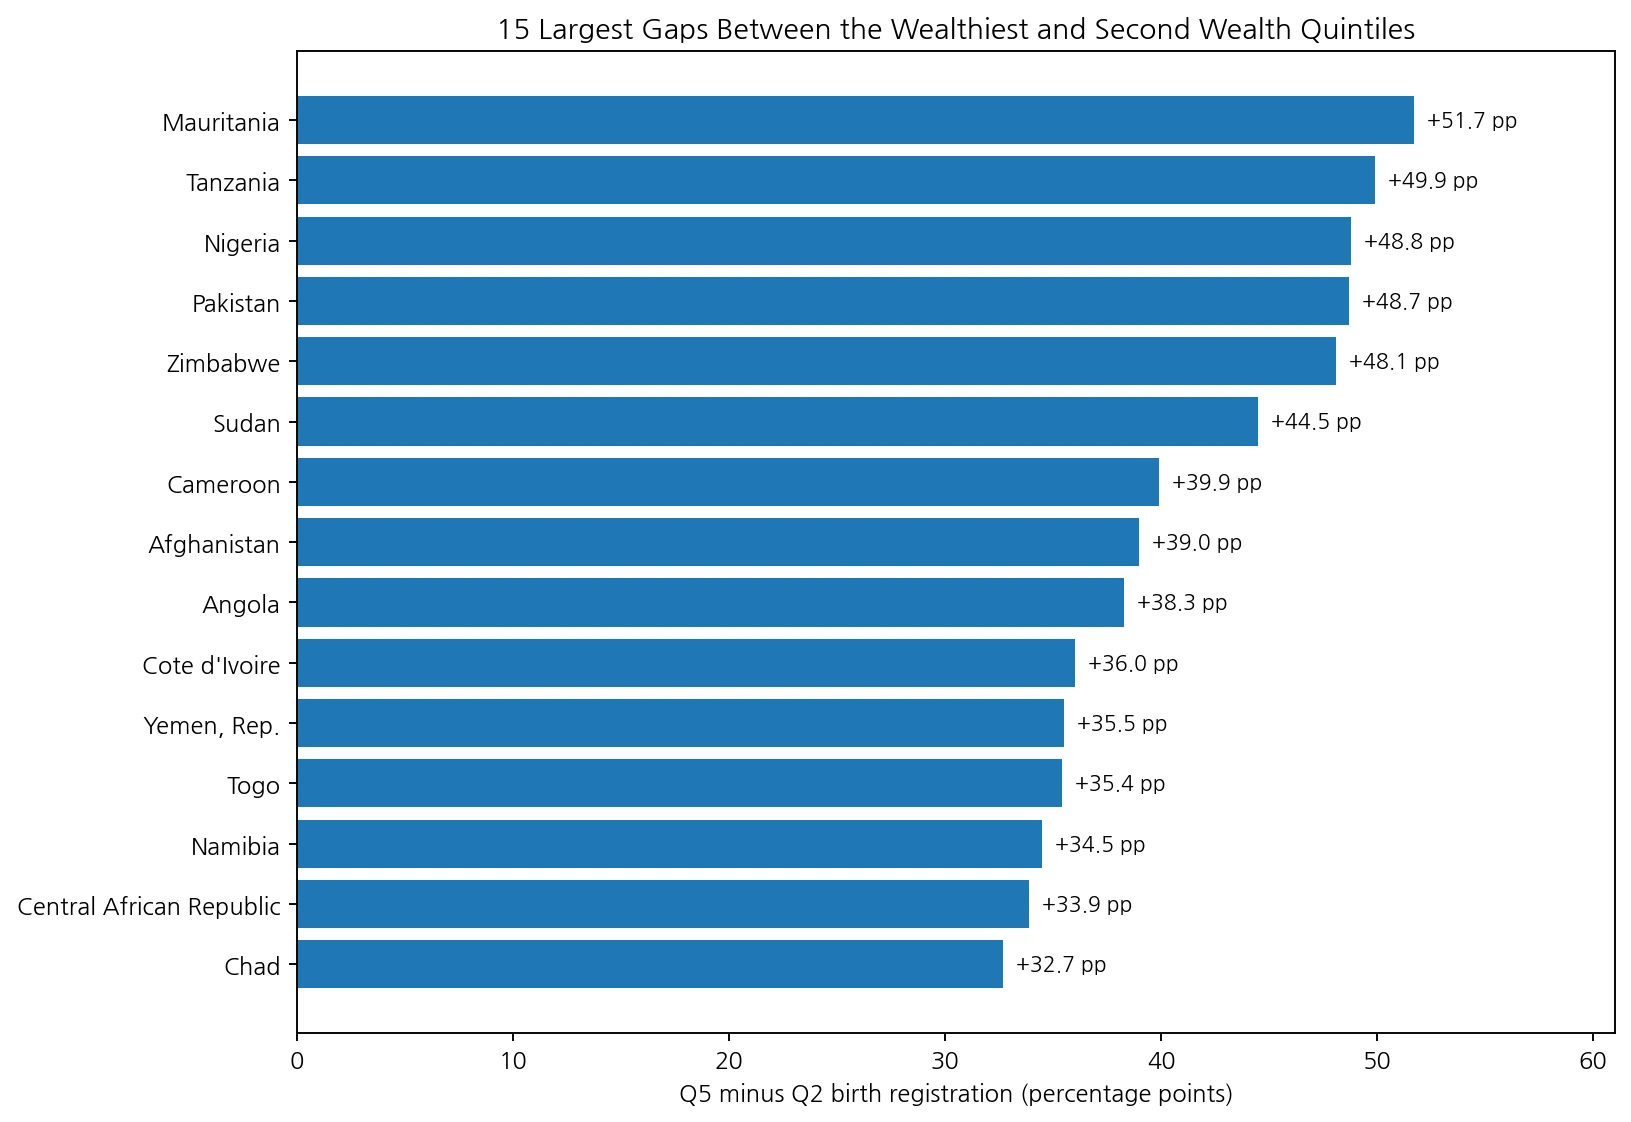
Comparing Q2 with Q5, the wealthiest 20% of households, shows an even larger gap. Q5 is higher in 90 of 105 countries, equal in 3, and lower in 12. The median Q5-minus-Q2 gap is 7.0 percentage points, while the unweighted mean gap is 13.2 points.
This comparison adds information that a simple country ranking cannot provide. A country may have nearly universal registration among the wealthiest households while coverage remains much lower in Q2. That pattern can signal a strong socioeconomic gap in registration, although identifying the cause requires other variables such as rural residence, parental education, administrative access, and national registration rules.
| Country/economy | Year | Q2 | Q3 | Q4 | Q5 | Q5-Q2 gap |
|---|---|---|---|---|---|---|
| Mauritania | 2021 | 29.6% | 52.2% | 66.3% | 81.3% | +51.7 pp |
| Tanzania | 2016 | 15.2% | 20.0% | 37.2% | 65.1% | +49.9 pp |
| Nigeria | 2013 | 17.5% | 28.2% | 46.2% | 66.3% | +48.8 pp |
| Pakistan | 2018 | 27.3% | 44.2% | 63.4% | 76.0% | +48.7 pp |
| Zimbabwe | 2015 | 30.9% | 39.4% | 54.3% | 79.0% | +48.1 pp |
| Sudan | 2014 | 53.4% | 73.8% | 86.4% | 97.9% | +44.5 pp |
| Cameroon | 2018 | 52.5% | 65.3% | 81.6% | 92.4% | +39.9 pp |
| Afghanistan | 2015 | 30.9% | 34.9% | 48.2% | 69.9% | +39.0 pp |
| Angola | 2016 | 16.6% | 26.9% | 30.7% | 54.9% | +38.3 pp |
| Cote d’Ivoire | 2012 | 56.7% | 65.5% | 81.6% | 92.7% | +36.0 pp |
| Yemen, Rep. | 2013 | 20.2% | 26.9% | 40.6% | 55.7% | +35.5 pp |
| Togo | 2014 | 62.0% | 73.1% | 93.8% | 97.4% | +35.4 pp |
| Namibia | 2013 | 56.3% | 69.0% | 77.2% | 90.8% | +34.5 pp |
| Central African Republic | 2010 | 50.8% | 59.0% | 71.2% | 84.7% | +33.9 pp |
| Chad | 2015 | 6.4% | 6.1% | 8.0% | 39.1% | +32.7 pp |
Mauritania has the largest matched gap: 29.6% in Q2 versus 81.3% in Q5, a difference of 51.7 percentage points. Tanzania follows at 49.9 points, Nigeria at 48.8, Pakistan at 48.7, and Zimbabwe at 48.1. Sudan is 44.5 points, Cameroon 39.9, Afghanistan 39.0, and Angola 38.3.
Looking across Q2, Q3, Q4, and Q5 shows the gradient more clearly
Countries with large wealth gaps often show a stepwise increase across the four groups. Mauritania, for example, moves from 29.6% in Q2 to 52.2% in Q3, 66.3% in Q4, and 81.3% in Q5. Pakistan moves from 27.3% to 44.2%, 63.4%, and 76.0%. These sequences make the within-country gradient easier to see than a single Q2 value.
The sequence still should not be treated as proof that income alone causes registration. Wealth quintiles correlate with many other characteristics, and civil registration depends on administrative systems and legal procedures. The most appropriate next step for a country with a large gap is to consult its DHS, MICS, or other official survey documentation for the variables and barriers that can explain the pattern.
The 2006–2021 spread in observation years is the main limitation
The observation dates are widely distributed. Nineteen values are from 2014, fourteen from 2012, ten each from 2015 and 2016, and ten from 2018. Only two are from 2019 and three each from 2020 and 2021. The presence of a few 2021 values does not turn the full dataset into a 2021 global comparison.
For that reason, the world map is explicitly labeled as a latest-observation view, while the 2018–2021 subset is separated. A truly current global comparison would require a newer harmonized source or a much larger common-year subset.
Countries missing from the Q2 table are not zero
The wealth-disaggregated Q2 series covers 105 countries and separately reported areas. Countries such as Korea, the United States, Japan, and Germany do not appear in this retained table and must not be assigned a value of zero. Detailed wealth-quintile statistics depend heavily on household surveys, so their country coverage differs from the general birth-registration indicator.
Gray areas on the map likewise mean that there is no matched Q2 observation in this table or no visible polygon at the low-resolution map scale. They do not indicate zero birth registration.
Data source and calculation method
The primary statistical source is World Bank SP.REG.BRTH.Q2.ZS, Completeness of birth registration (%): Q2. The World Bank’s general birth-registration measure covers children under age five whose births were registered at the time of the survey, and the source is largely compiled by UNICEF from DHS, MICS, other national household surveys, censuses, and vital registration systems.
The world map and base distribution statistics use 105 latest non-missing Q2 observations dated 2006–2021. The wealth-gap analysis matches Q2 with Q3, Q4, and Q5 for the same country and observation year. ISO-3 codes are joined to a Natural Earth low-resolution world layer, with 95 polygons directly filled.
- World Bank – Completeness of birth registration (%): Q2
- World Bank – Completeness of birth registration (%)
Frequently Asked Questions
What does Q2 mean in this indicator?
Q2 is the second of five household wealth quintiles, the 20% group immediately above the poorest quintile.
Does Q2 mean the bottom 40% of households?
No. The bottom 40% combines Q1 and Q2. Q2 alone is roughly the 20th-to-40th-percentile group within each country.
Is Q5 birth registration always higher than Q2?
No, but Q5 is higher in 90 of the 105 matched country observations when the same survey year is used.
Can the 105 observations be treated as a 2021 ranking?
No. Observation years range from 2006 to 2021, so the map represents the latest retained observation for each country or area.
Related Articles
- Tanzania 2022 Demographic and Health Survey Guide
- Global Population Growth Map – 2025 Country Comparison
- Global Population Density Map – 2023 Country Comparison
Green Map creates custom-edited map images using open geographic data sources such as geoBoundaries, Natural Earth, OpenStreetMap, and government open data.
These maps are edited visual materials, not raw data files, and are provided for education, documents, presentations, and graphic reference.