Jefferson County, Illinois has a mixed 2025 land-cover pattern rather than a single uninterrupted agricultural surface. Agriculture is the largest class at 60.46%, but forest reaches 22.06% and developed land 10.62%. A broad developed concentration near the center is one of the map’s strongest visual features, while large water bodies in the southern half create a second contrast with the surrounding farms and woods.
Four map views are provided on this page, and the four original JPG files are available together in one download. The general land-cover map works best for seeing all major classes at once. The forest-and-farmland view simplifies the field-and-wood relationship, the impervious map isolates hard built surfaces, and the 1985–2025 comparison identifies cells whose mapped classes differ between the two endpoints.
Table of Contents
The county’s central built cluster stands out inside a landscape still led by agriculture
Agriculture covers 60.46% of Jefferson County and forms wide yellow areas across the north, east, southeast, and many interior blocks. Those fields are repeatedly interrupted by green forest patches, especially in the northwest, north-central area, west, and east. The result is a farm-led county with a substantial wooded component rather than a simple uninterrupted crop grid.
The developed class is unusually prominent for a county where agriculture remains the majority. At 10.62%, it forms a large, compact central cluster with several road-shaped extensions. Smaller developed nodes appear farther east, southeast, west, and north. Between those nodes, agricultural and forest cover quickly become dominant again, so the built pattern remains concentrated rather than continuous across the county.
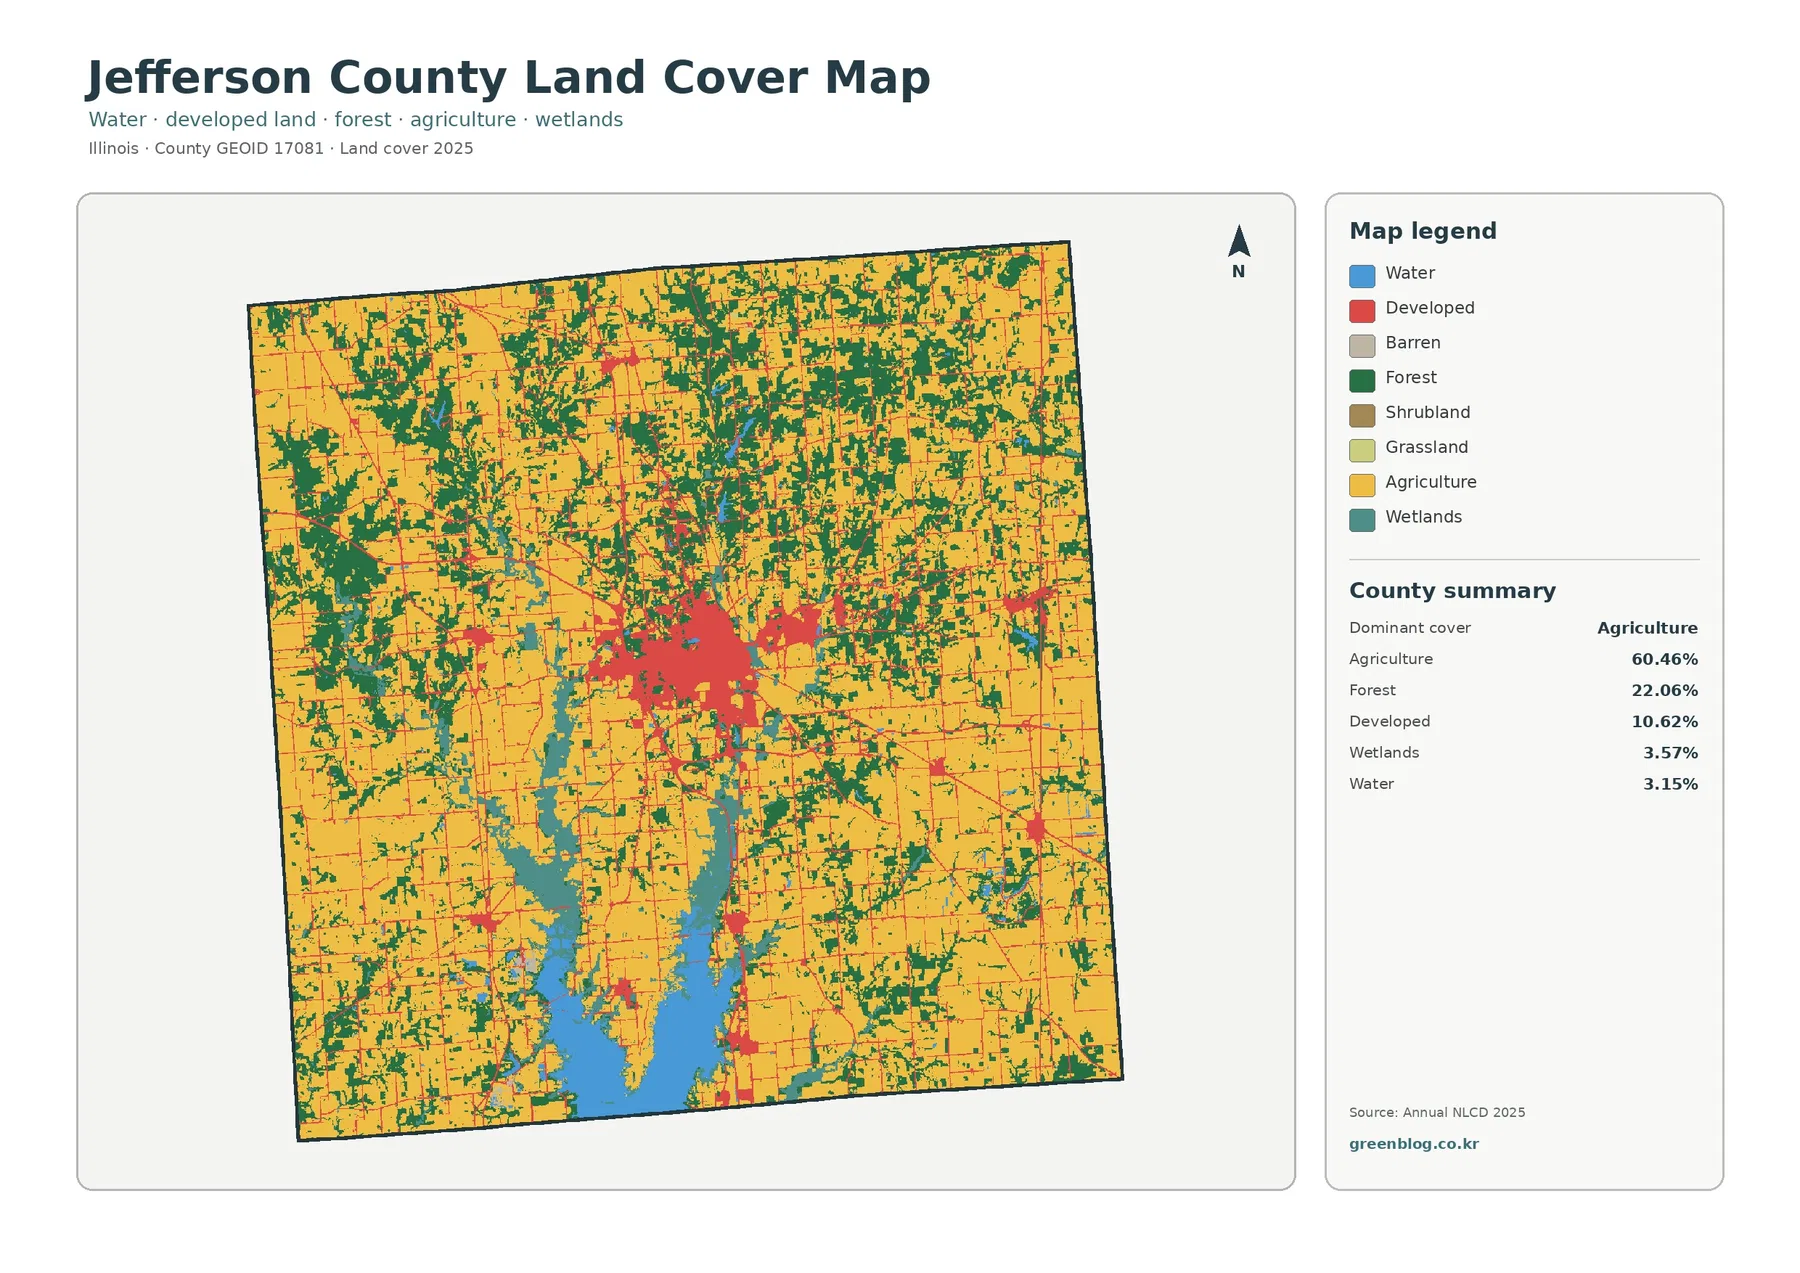
Forest makes up 22.06%, and its distribution is broad rather than confined to a single edge. Larger green areas occur in the northwest and north-central parts of the county, with additional wooded bands through the west and east. Around the central developed area, forest breaks into smaller fragments. In the south, wooded cover often appears beside water and wetland classes, adding another layer to the county’s land-cover contrast.
Southern water bodies make the lower half of the county look different from the farm-dominated north and east
Water represents 3.15% of the countywide summary, but its location gives it much greater visual importance. Large blue shapes occupy the southern half, including one broad water body near the center-south and another elongated feature farther southwest. These areas divide agricultural cover and sit close to forest and wetland patches, creating some of the most complex edges on the map.
Wetlands account for 3.57%. They appear around parts of the southern water features and also as narrower teal bands in the north and center. Some follow the same general corridors as forest or water, while others cut through agricultural blocks. The map therefore shows wet ground in several different settings instead of one single wetland zone.
These classes should be read as mapped surface cover. A wetland-colored pixel does not establish a legal wetland boundary, and open water on a 30-meter raster is not a parcel survey. The maps are useful for county-scale context, watershed reference, and visual comparison. More detailed local data are needed for regulatory, engineering, or site-specific decisions.
A simpler forest-and-farmland view shows how wooded patches divide the agricultural matrix
With most developed detail reduced, the forest-and-farmland map makes the relationship between the two largest classes much easier to follow. Agricultural cover still dominates large areas, but forest repeatedly interrupts the field pattern. The largest wooded pieces in the northwest and north-central area are easy to distinguish, and the east contains additional connected-looking green bands.
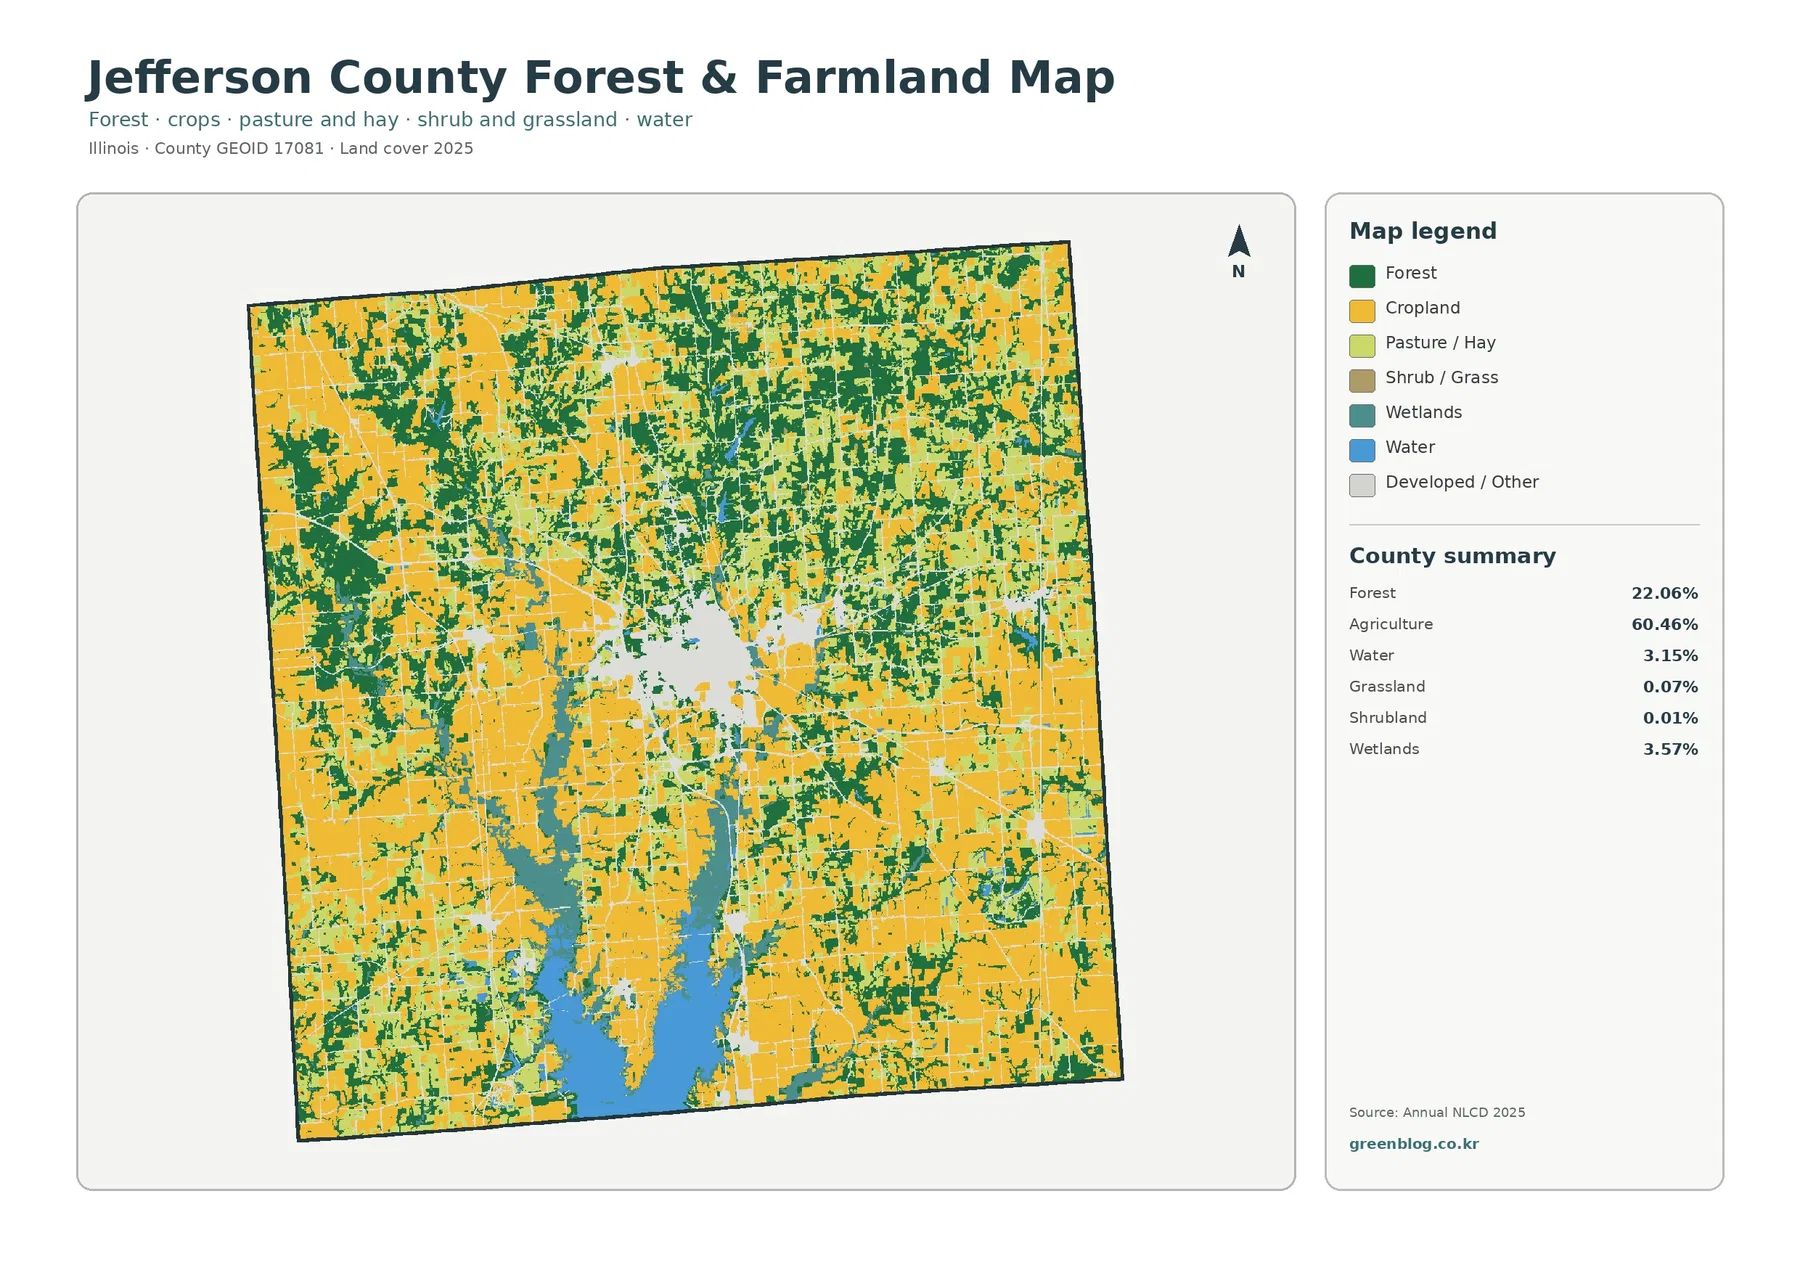
This view also makes the southern half easier to interpret. Fields remain extensive, yet they are interrupted by water, wetlands, and forest much more often near the large southern water bodies. A presentation focused on agriculture and forest can use this map first, then return to the general map to restore the developed and wetland classes that complete the county’s surface pattern.
Impervious cover isolates the hard-surface core of the central developed area
Impervious surface means pavement, rooftops, parking areas, and other hard materials that do not readily absorb water. Jefferson County’s mean impervious value is 2.55%, and 1.15% of the county is mapped at 50% impervious or greater. Those numbers are much smaller than the 10.62% developed-land share because developed classes can also contain lawns, trees, soil, and other permeable surfaces.
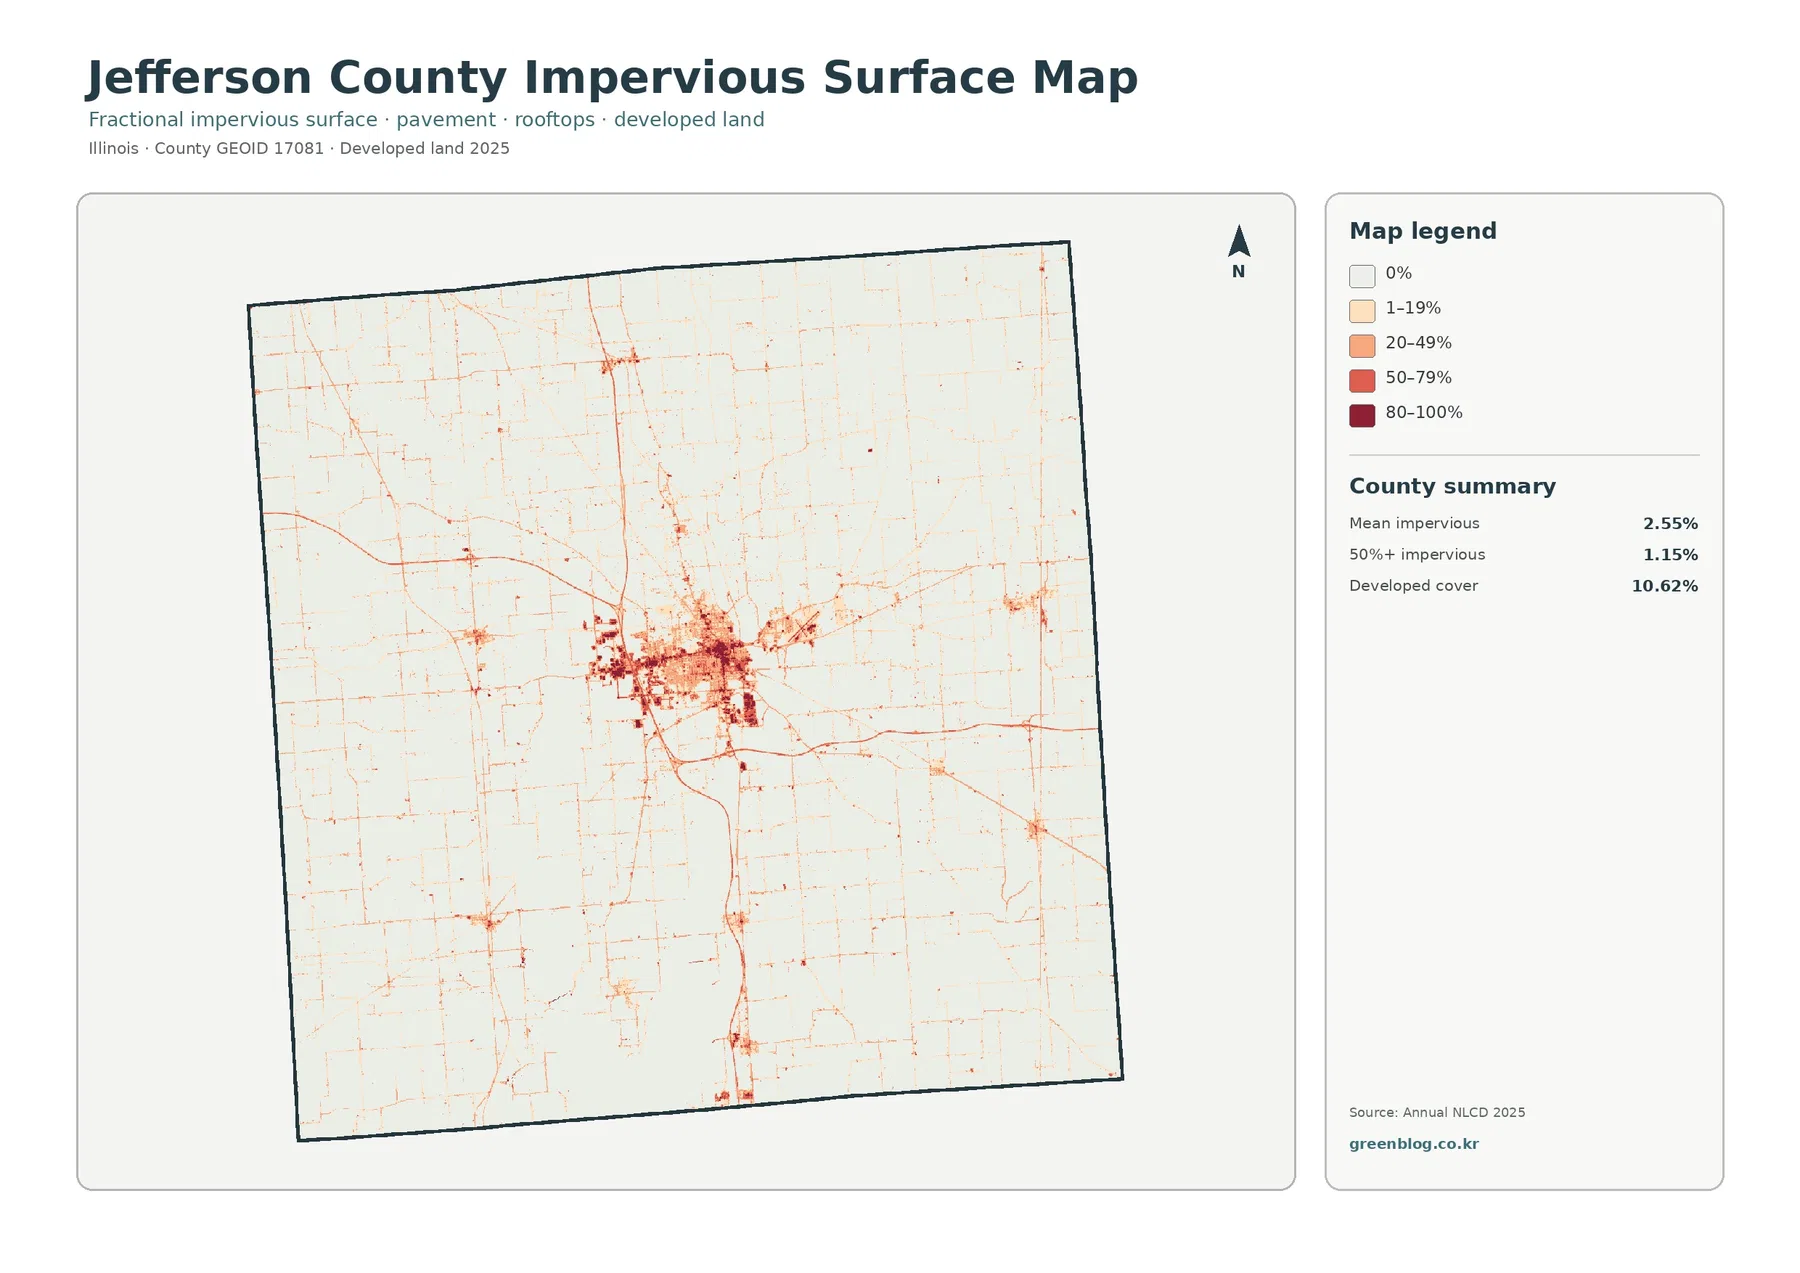
The map narrows the developed pattern to its hardest surfaces. Dark red values are tightly clustered near the center, with road lines extending north, east, south, and west. Smaller dark nodes appear at a few separated settlements. Most agricultural and forested land remains very light, so the contrast between the built core and the rural parts of the county is stronger here than on the general land-cover map.
The 1985–2025 comparison is driven mainly by the 10.69% “other class difference” category
The change map reports an overall class difference of 14.10%. Cells classified to developed account for 1.68%, forest loss for 0.67%, agricultural loss for 0.89%, and other class difference for 10.69%. Because the other category represents most of the total, the countywide number is not a simple measure of urban growth, forest clearing, or farm conversion.
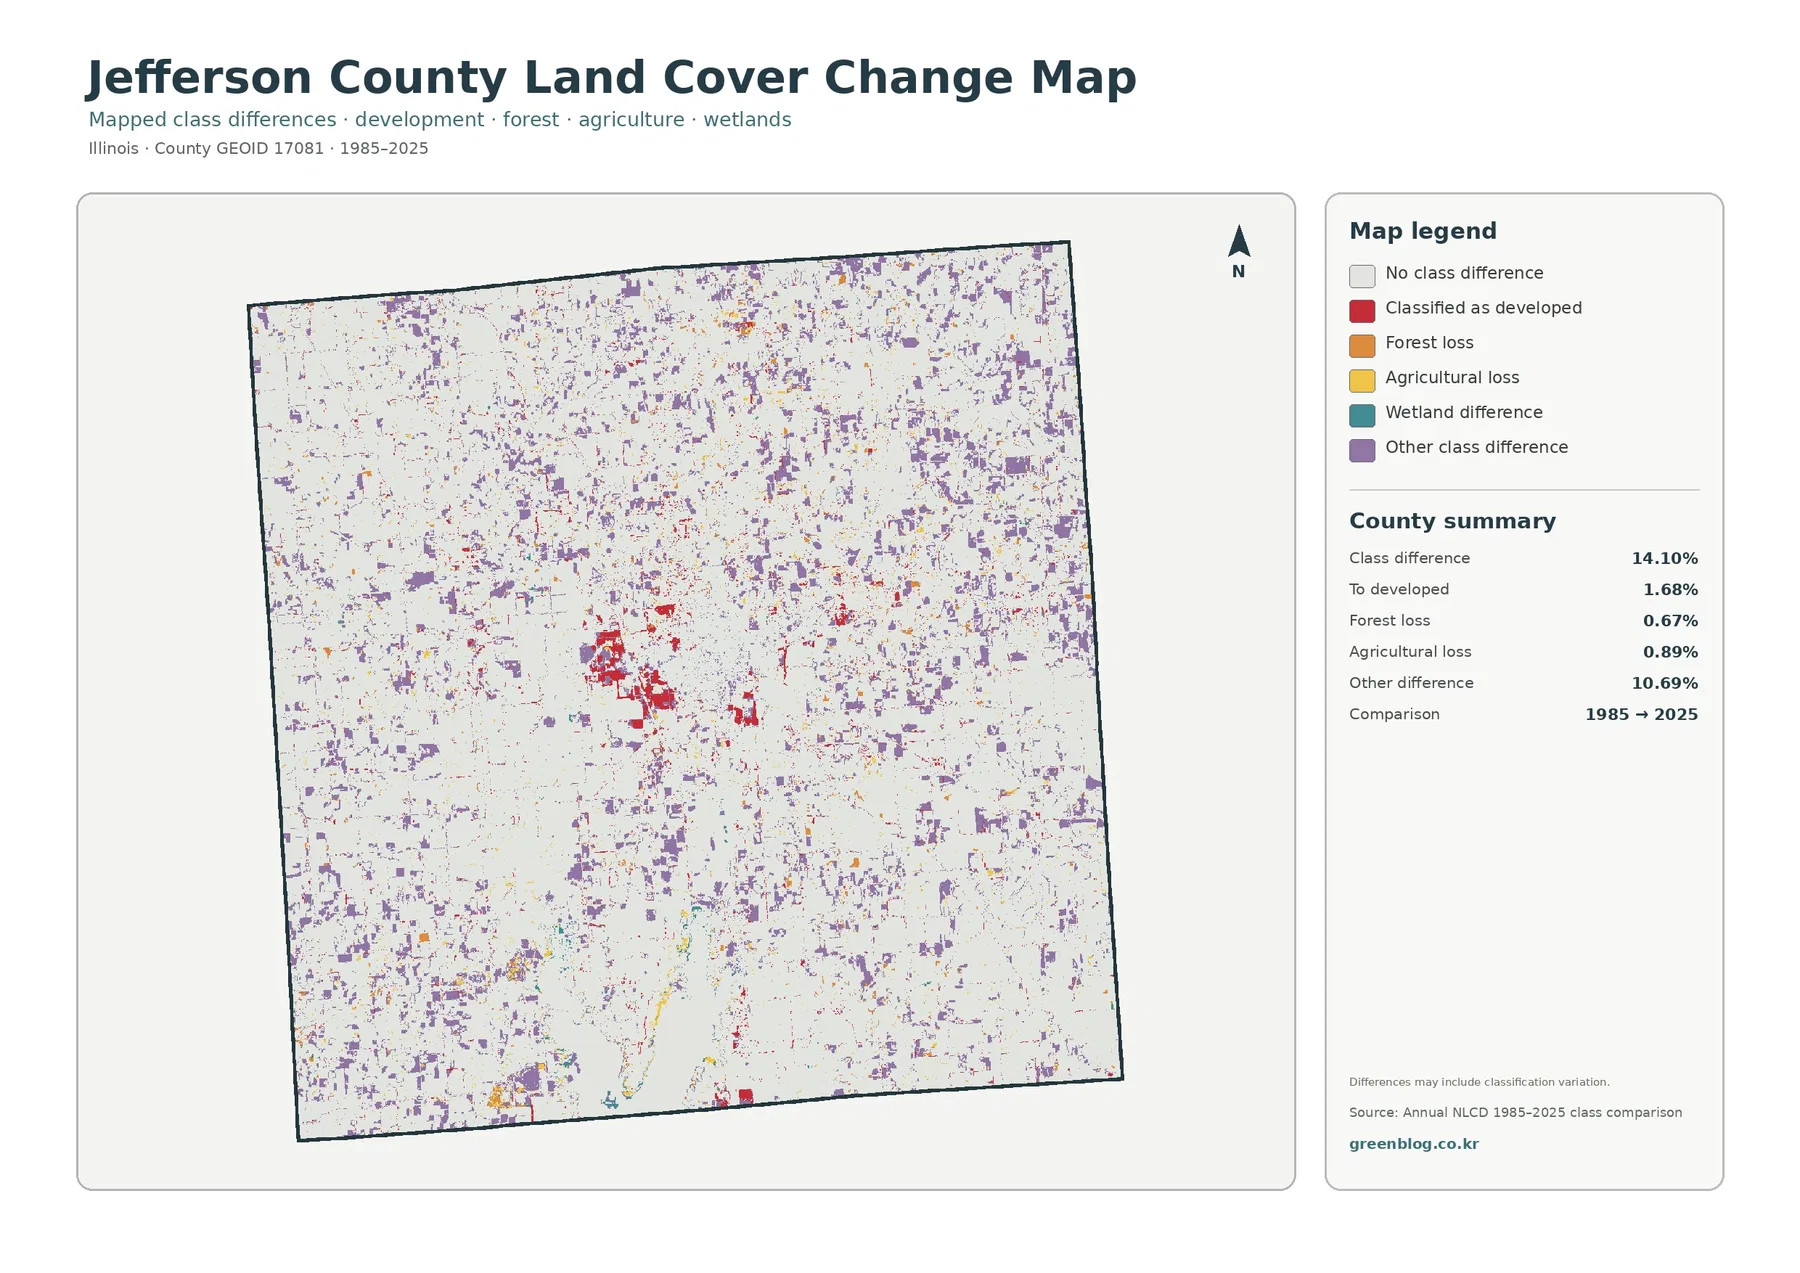
Purple other-class differences are scattered through the north, east, south, and interior. Red developed differences are more concentrated around the present central built cluster and along a few linear connections. Forest-loss and agricultural-loss colors appear in smaller pieces. That distribution supports a cautious interpretation: several kinds of classification differences contribute to the total, and no single category explains the map.
Different map views are useful for different questions about the same county
If the goal is to describe the county in one image, start with the general land-cover map. It shows the agricultural majority, the central development cluster, distributed forest, southern water, and wetland patches together. For an agriculture-and-forest comparison, the second map is easier because it reduces competing developed colors and makes the wooded pattern more visible.
The impervious map works best when the question is where pavement and rooftops are concentrated. It makes the central core much more obvious than the developed class alone. The change map should be kept separate from present-day cover because it compares two endpoints. Pairing the current map with the historical comparison in a presentation helps viewers understand that one describes today’s mapped classes while the other marks differences.
Thirty-meter raster cells simplify narrow roads, wetland margins, and fragmented forest edges
Annual NLCD products are commonly represented with roughly 30-meter raster cells. A raster divides the surface into a grid and assigns each cell a representative class or value. If one cell contains cropland, a road, and a strip of trees, the mapped result must still simplify that mixed ground into a limited classification or impervious percentage.
This matters in Jefferson County because many forest fragments are narrow, road lines are thin, and wetland margins around southern water bodies are irregular. The map should not be used as a parcel survey. Forest colors do not define ownership or protection status, wetland colors do not establish regulatory limits, and developed classes do not define zoning.
The 2025 map is also a snapshot of one classification year. Construction, crop rotation, vegetation management, water levels, and other changes after the observation period are not automatically included. Likewise, the 1985–2025 map compares two endpoints and cannot reconstruct every intermediate event. These maps are most reliable for county-scale pattern comparison and for identifying places where more detailed information may be needed.
Frequently Asked Questions
What is the largest 2025 land-cover class in Jefferson County?
Agriculture is the largest at 60.46%, followed by forest at 22.06%, developed land at 10.62%, wetlands at 3.57%, and water at 3.15%. The central built cluster and southern water bodies create strong local contrasts within the agricultural majority.
Why is developed land 10.62% while mean impervious cover is only 2.55%?
Developed land-cover classes can include lawns, trees, soil, and other permeable surfaces. Hard surfaces are concentrated in the central built area and roads, so the countywide impervious mean is much lower than the developed-land share.
Does the 14.10% 1985–2025 class difference equal physical land-use change?
Not necessarily. Real surface change may be included, but imagery, vegetation, moisture, mixed pixels, and classification methods can also create differences. Other class difference accounts for 10.69%.
Map File Information
The download combines four original JPG maps for Jefferson County: 2025 land cover, forest and farmland, impervious/developed land, and the 1985–2025 land-cover class comparison.
- Included Versions: Land Cover Map, Forest & Farmland Map, Impervious/Developed Land Map, and 1985–2025 Land Cover Change Map
- File Type: One ZIP containing four JPG files
- Intended Use: agriculture and forest comparison, southern water and wetland review, built-surface patterns, class-change reference, teaching, and presentations
Related Maps
- Adams County Illinois Land Cover Map
- Alexander County Illinois Land Cover Map
- Bond County Illinois Land Cover Map
Sources and references
- MRLC Annual NLCD Data – official access point for Annual NLCD land-cover and impervious-surface products.
- USGS Annual NLCD Land Cover Classification – official documentation for land-cover classes and raster interpretation.
- U.S. Census Bureau TIGER/Line Shapefiles – official geographic boundary source for Jefferson County.
Green Map creates custom-edited map images using open geographic data sources such as geoBoundaries, Natural Earth, OpenStreetMap, and government open data. These maps are edited visual materials, not raw data files, and are provided for education, documents, presentations, and graphic reference.