Bradley County is easiest to understand when Cleveland is treated as the center of the map rather than simply one label among many. The county map places the courthouse, sheriff’s office, emergency medical facility, and Cleveland State Community College around the central urban area, while Charleston sits well to the northeast and McDonald lies near the southwestern side. The same four subjects shown in the article—county layout, city distribution, water, and elevation—are available from this page as high-resolution A3 JPG files in one ZIP download.
The maps also show why a single road map does not tell the whole story. I-75 follows the western side of the county, several numbered routes converge on or pass through Cleveland, and a set of long, narrow ridges runs generally from southwest to northeast. Creeks occupy many of the lower corridors between those ridges, so the road, water, and elevation maps explain different parts of the same landscape.
The elevation layer is especially useful for Bradley County because the supplied map reports an actual range of about 206 to 448 meters and a mean near 261 meters. The relief is not a smooth rise from one side to the other; instead, repeated ridges and valleys create narrow bands of higher and lower ground. That pattern helps explain why settlements, roads, and streams often look elongated rather than evenly spread across the county.
Table of Contents
Cleveland anchors the county road pattern
On the general county map, Cleveland occupies the broad central area and connects visually with East Cleveland and South Cleveland. Hopewell appears northwest of the city, Wildwood Lake lies to the south, McDonald is near the southwest side, and Charleston is separated from the main Cleveland cluster near the northeastern edge. That arrangement gives the county a clear central city with several outer reference points rather than a set of equally sized towns.
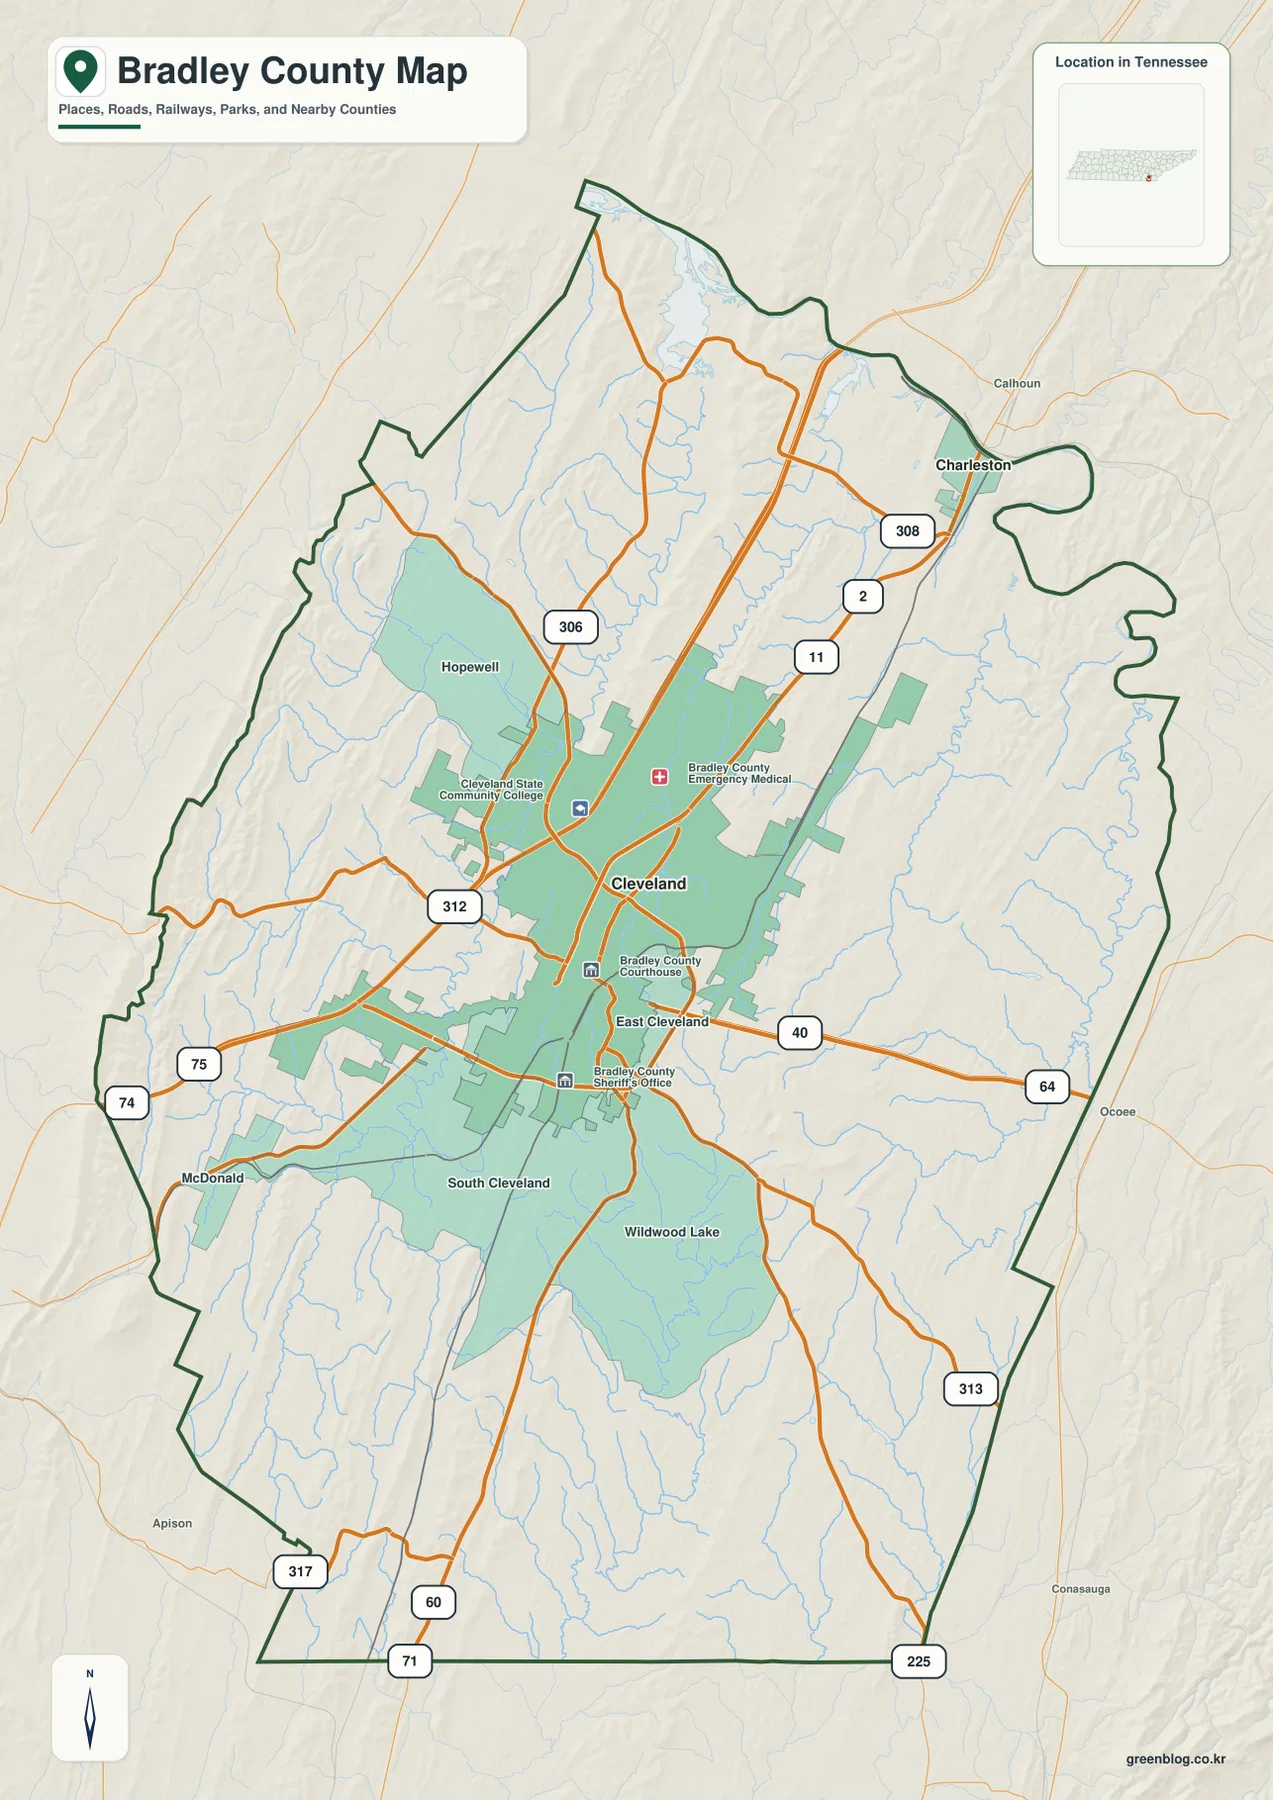
I-75 is the most obvious north–south highway on the western side. Other numbered routes shown on the map include 74 and 312 west of Cleveland, 306 to the northwest, 11 and 2 toward the northeast, 308 near Charleston, 40 and 64 east of the Cleveland area, and 313, 225, 60, 71, and 317 toward the southern half. The purpose of this map is not turn-by-turn navigation, but those route numbers make the larger directions of travel easy to recognize.
Public-facility symbols add useful context around Cleveland. The Bradley County Courthouse and sheriff’s office identify the administrative center, while the emergency medical and college labels help distinguish the built-up central area from the less densely labeled outer parts of the county. A reader using the map for a report or classroom handout can therefore mark Cleveland first and then add the outer communities without losing the county’s basic structure.
The thick county outline matters near the edges. Roads and streams continue beyond the boundary, and nearby place names can appear just outside Bradley County. Reading the boundary before assigning a road, creek, or settlement to the county prevents the edge of the map from being mistaken for the end of the real feature.
Charleston marks a separate northeastern city point
The city map simplifies the page by ranking only the major city labels included in this layer. Cleveland is marked number 1 near the middle of the county and Charleston number 2 near the northeast. The printed city index shows 48,829 beside Cleveland and 956 beside Charleston; because the map itself does not state the reference year, those figures are best treated as annotations supplied with the city layer rather than as claims about the current population.
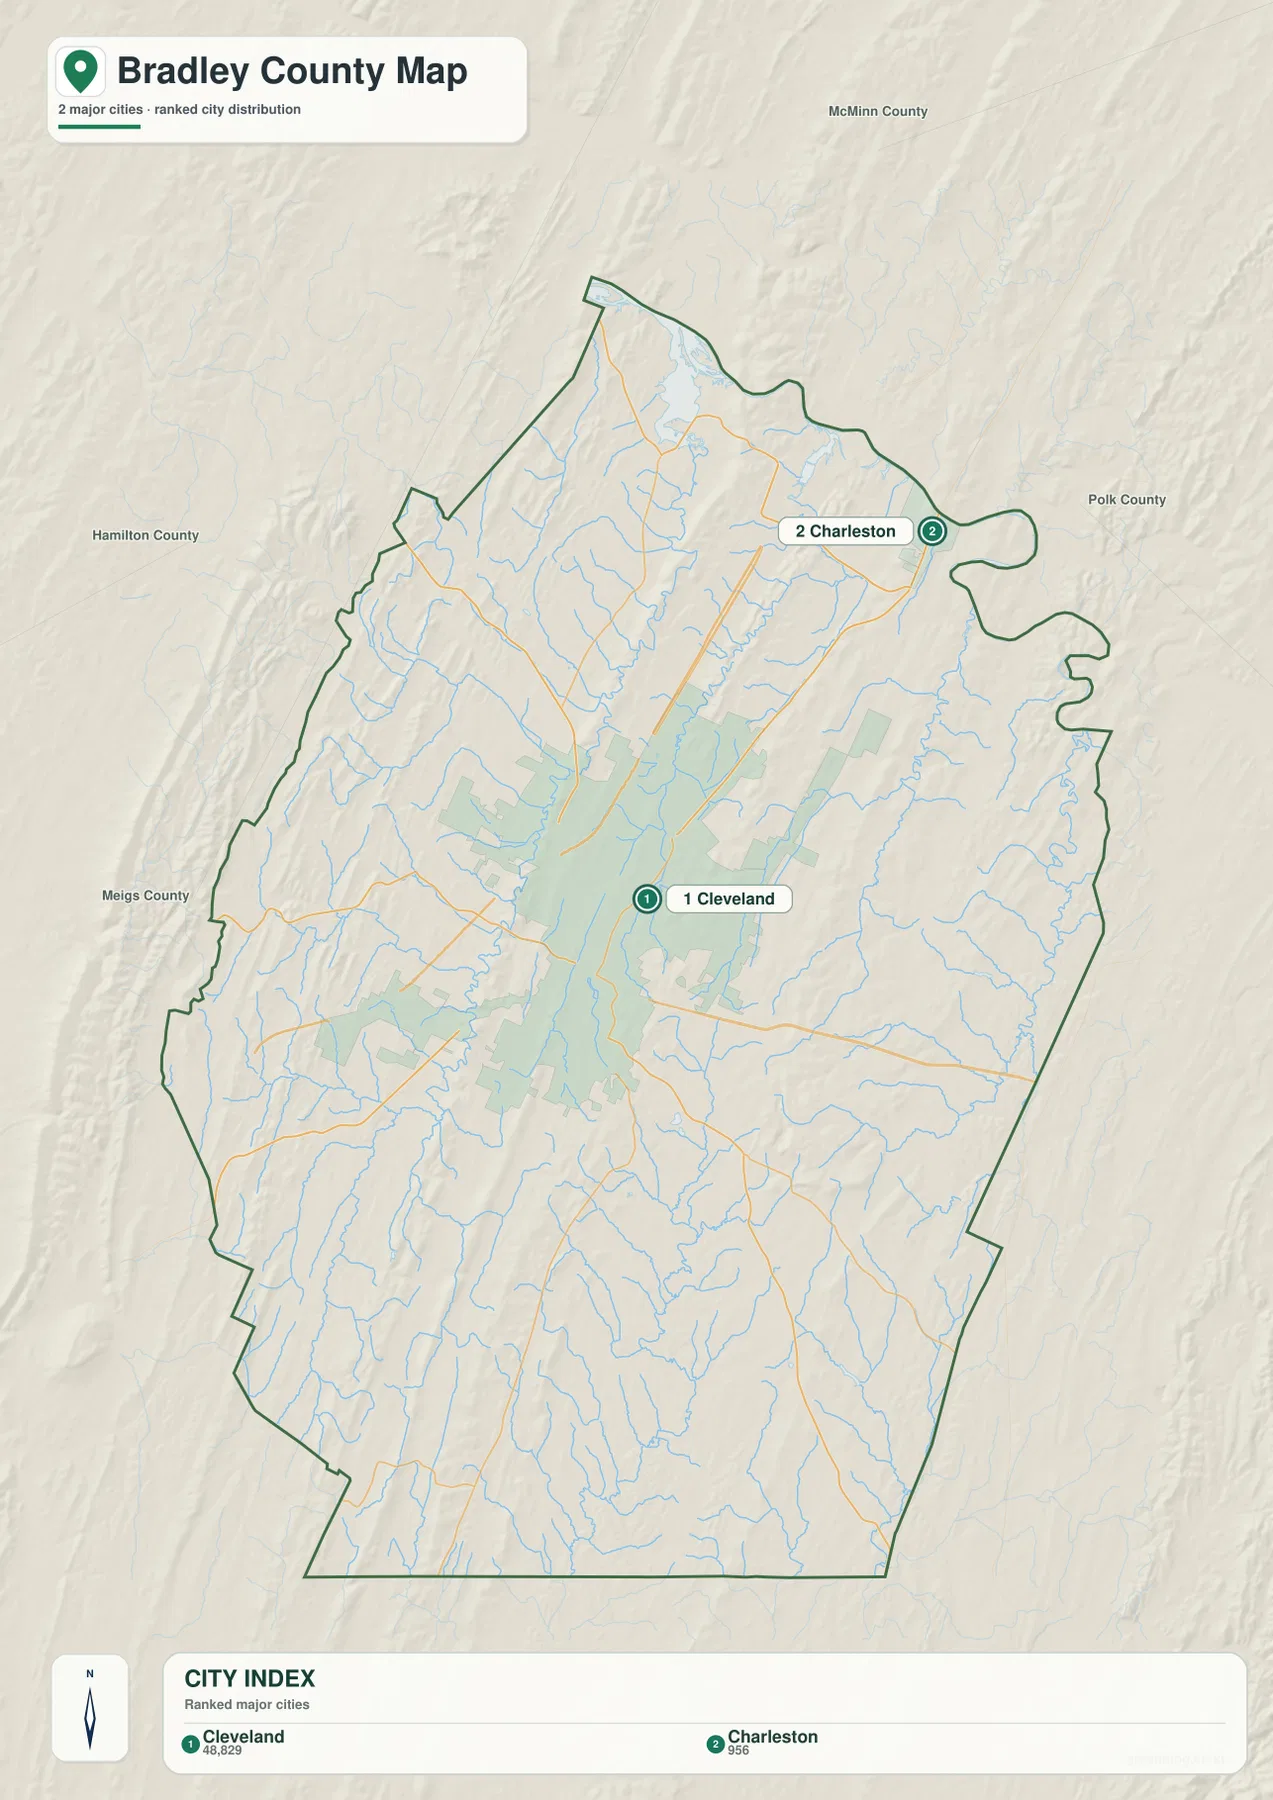
Their positions are as important as the ranking. Cleveland sits within the broadest area of urban shading and road connections, while Charleston is detached from that central concentration. Showing both points gives a much better sense of the county’s length and orientation than using Cleveland alone.
The surrounding labels on this map include McMinn County to the north, Polk County to the east, and Hamilton and Meigs counties to the west side of the view. These neighboring names are useful for orientation because they show where Bradley County sits within southeastern Tennessee. The city map is not a route-distance diagram, so travel mileage and driving time should be taken from current transportation tools rather than estimated from the spacing of the city markers.
Creeks trace the valleys between the ridges
The terrain-and-water map removes much of the urban emphasis and makes the drainage network the main subject. Candies Creek is prominent on the western side, Lick Creek appears in the north, S. Mouse Creek and Simpson Pond are labeled toward the northeast, and Chatata Creek runs through the eastern part of the county. Farther east, S. Chestuee Creek follows another long corridor close to the county boundary.
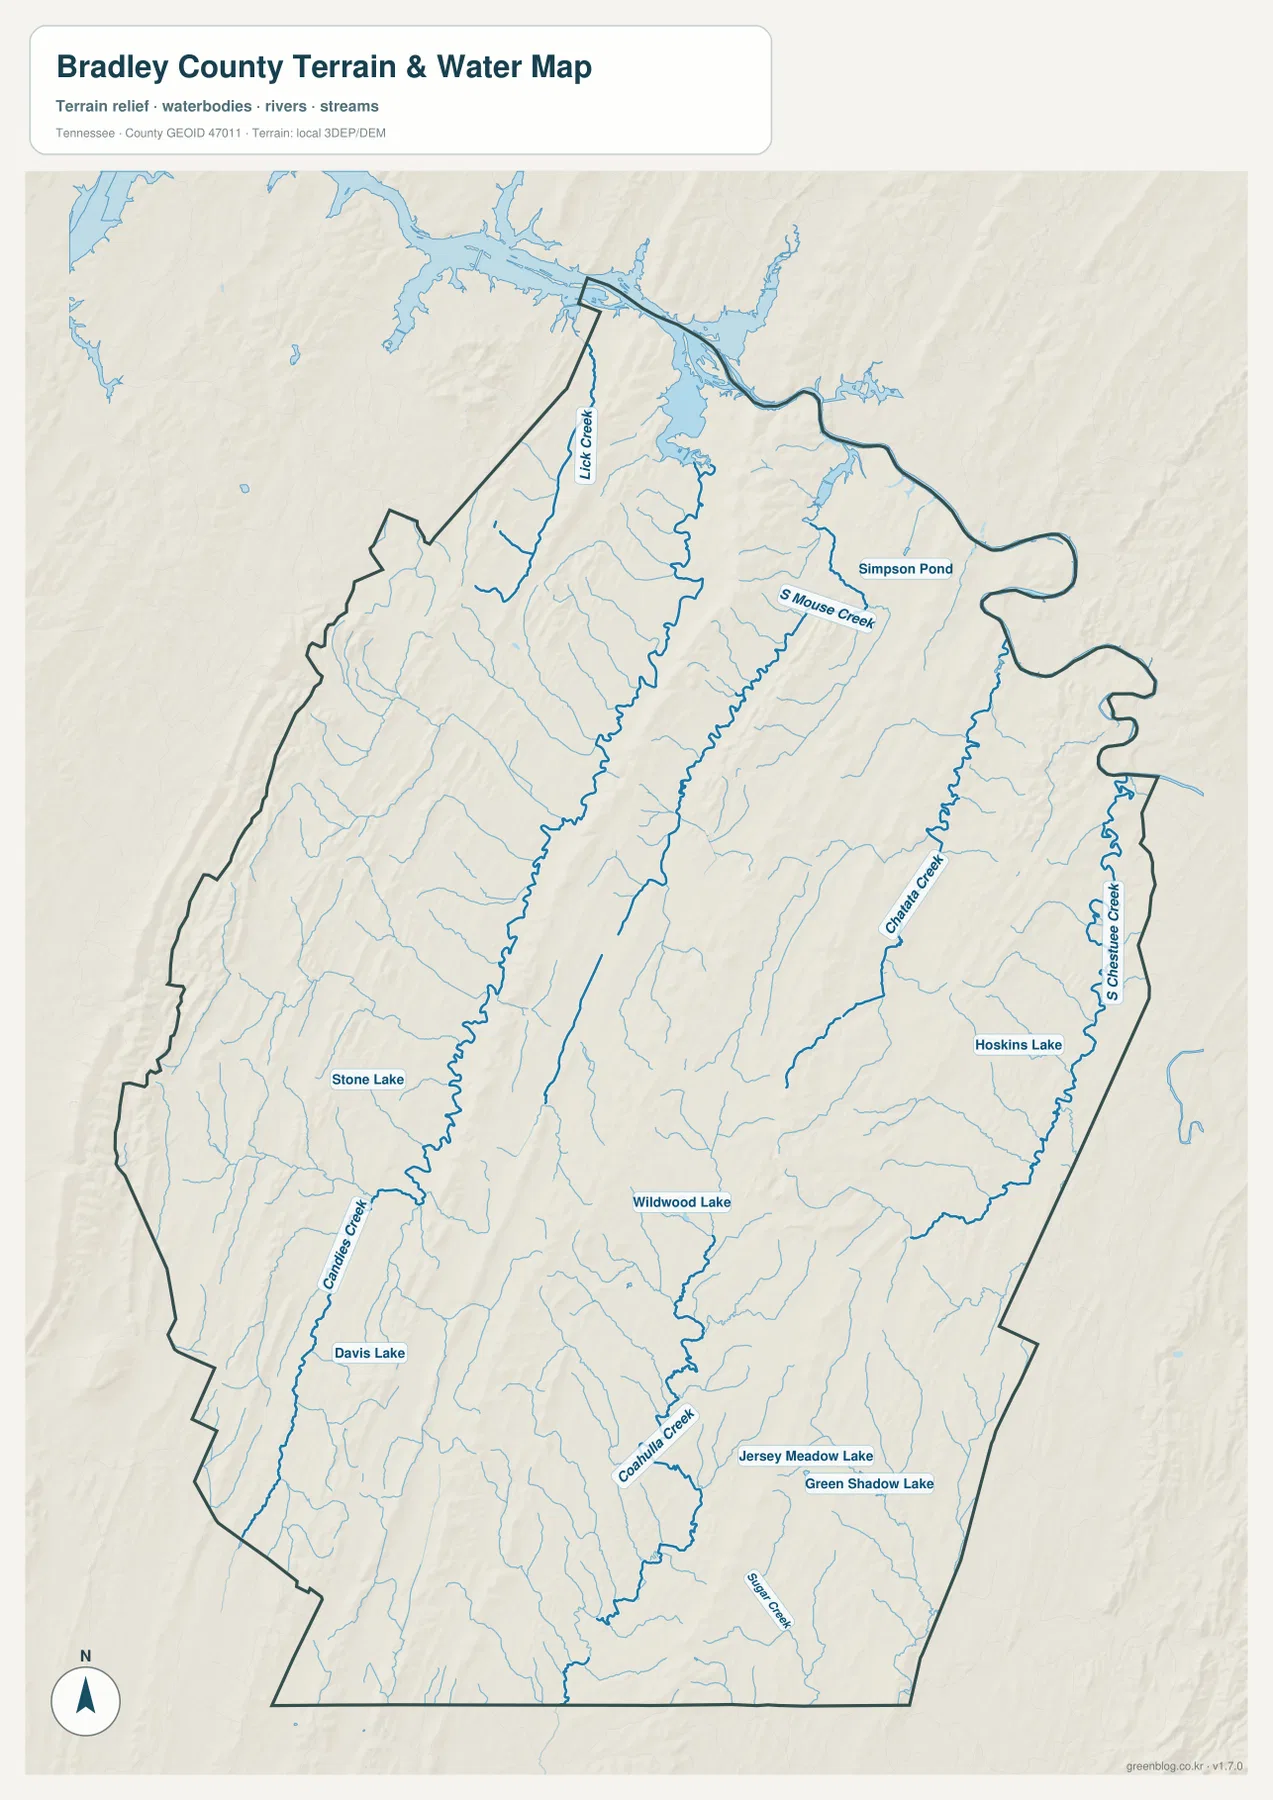
Several smaller named water bodies are also visible. Stone Lake and Davis Lake appear in the western half, Wildwood Lake is near the center-south, Hoskins Lake is farther east, and Jersey Meadow Lake and Green Shadow Lake are shown in the southern part of the map. Coahulla Creek and Sloan Creek add more detail to the southern drainage network.
The water lines often follow long corridors that resemble the direction of the ridges on the elevation map. That does not mean every stream follows exactly the same bearing, but the repeated northeast–southwest structure is clear enough to compare across the two maps. A creek that looks like a simple blue line on the general map becomes more meaningful when its position between higher ridges is visible.
This layer should be used as a reference map for named streams, ponds, and lakes. It is not a flood-hazard map, parcel map, boating chart, or live water-level product. For those purposes, the relevant water-management or emergency agency should be consulted separately.
Elevation reveals a repeated ridge-and-valley surface
Bradley County’s elevation map reports an actual range of roughly 206 to 448 meters, with a mean around 261 meters. Greens represent lower terrain and the yellow-to-brown shades mark higher ground. The strongest relief appears along the western side and in several narrow interior ridges rather than as one large mountain block.
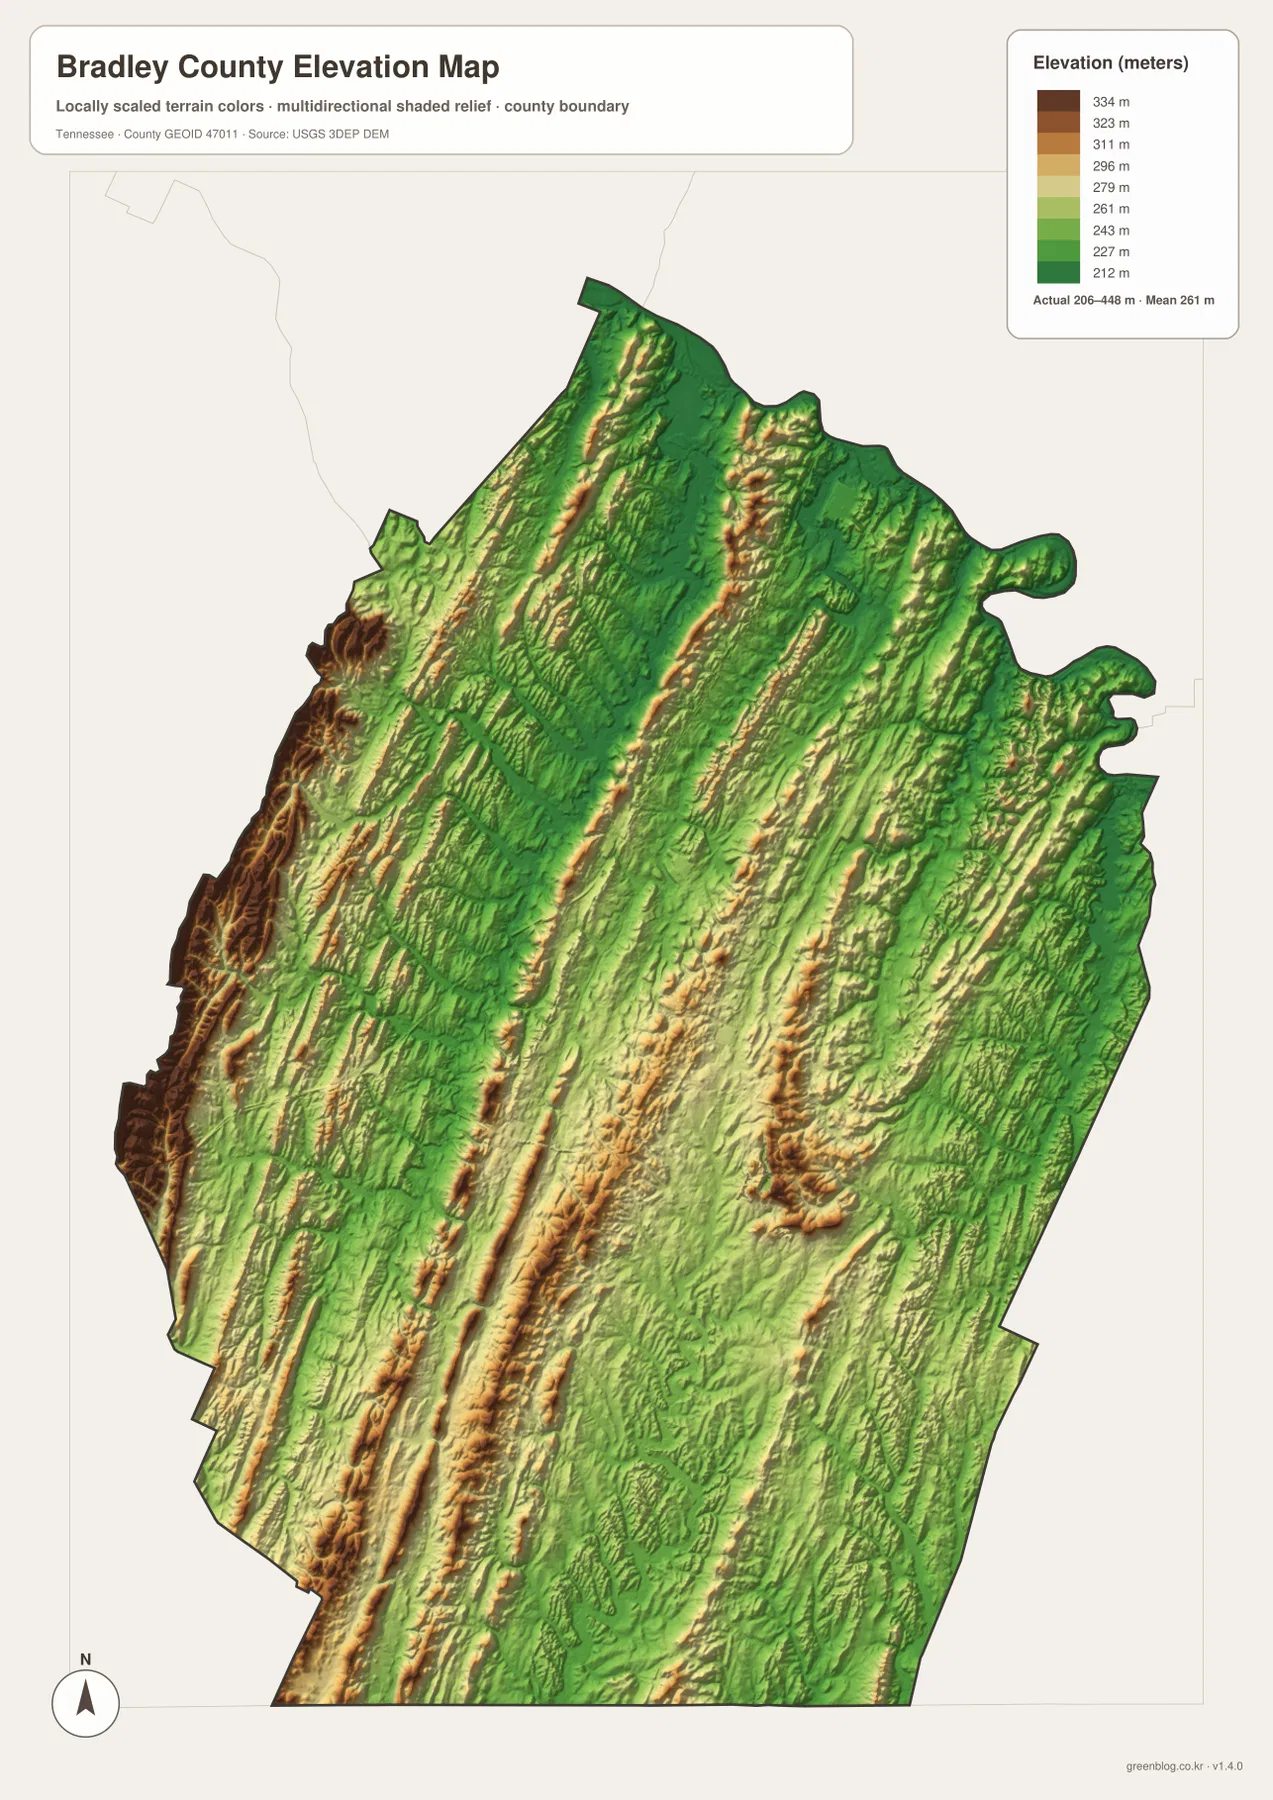
Long bands of higher terrain run through the county, separated by greener low areas. Some of the ridges continue for much of the north–south length of the map, and smaller ridges repeat on the eastern side as well. The result is a textured landscape in which the direction of the terrain is often more obvious than the absolute elevation number.
That relief helps explain the shape of the drainage network. Candies Creek, Chatata Creek, and other streams occupy lower corridors while the higher ridges form elongated divides between them. It also helps explain why major roads do not form a perfect rectangular grid: routes can follow lower passages for long stretches and cross ridges only where the terrain allows a practical connection.
The elevation surface is intended for county-scale comparison. It should not be treated as survey-grade elevation, an engineering model, or a substitute for field measurements. For classroom, publishing, and general geographic use, however, it clearly shows the contrast between the higher ridges and lower creek valleys.
Reading I-75 together with the east–west routes
I-75 gives Bradley County a strong western transportation reference, but Cleveland’s position becomes clearer when the east–west and diagonal routes are added. The 40 and 64 shields appear east of Cleveland, 11, 2, and 308 lead toward the Charleston side, while 60, 71, 225, and 313 help define the southern approaches. The exact functional names of every route are less important here than the way the road network fans out from the central urban area.
Comparing those lines with the elevation layer is useful because some roads run along the lower spaces between ridges while others cross the relief. A route that looks almost direct on the county map may still pass through rolling terrain or make adjustments around higher ground. For real driving decisions, current interchange, construction, bridge, and closure information should come from navigation services and transportation agencies.
For a clean printed explanation, one practical sequence is to mark Cleveland, trace I-75, add the main routes toward Charleston and the eastern side, and then place one or two major creeks and ridge bands. That produces a map that is easier to read than one covered with every local street, while still showing why Bradley County’s internal connections have the shape they do.
County edges connect to several neighboring directions
The supplied city layer visibly labels McMinn, Polk, Hamilton, and Meigs counties around Bradley County. The existing county material also identifies Whitfield and Murray counties in Georgia along the southern side, placing Bradley County close to the Tennessee–Georgia line. This wider setting matters when a road or stream reaches the border because the feature usually continues into the next jurisdiction.
The county outline should therefore be treated as an administrative boundary, not as a physical wall. Streams cross it, roads cross it, and communities near the edge may have everyday connections on both sides. When comparing Bradley County with a neighboring county map, start with the shared boundary and then follow the same route or waterway across the two pages.
From Cleveland roads to creek valleys: choosing the right file
Use the county map when you need cities, major roads, facilities, and the boundary together. The city map is better when the goal is simply to show where Cleveland and Charleston sit relative to each other. The water map is the clearest choice for named creeks and lakes, while the elevation map is the best way to show the long ridges and lower valleys.
The downloadable archive contains four high-resolution JPG files matching those subjects. They are suitable for A3 printing, presentation graphics, classroom use, and personal annotation. Keeping the layers separate also makes it easier to use a clean terrain map for one project and a road-and-place map for another without forcing all information onto the same sheet.
Frequently Asked Questions
Why is Cleveland much more prominent than Charleston on the city map?
Cleveland is shown near the middle of the county inside the largest urbanized area and road concentration, while Charleston is a smaller, separate city point near the northeastern side. The city index reinforces that contrast, although its printed population values should be treated as map annotations because the image does not state a reference year.
Which waterways are easiest to identify on the supplied map?
Candies Creek on the west, Lick Creek in the north, Chatata Creek and S. Chestuee Creek on the east, and Coahulla Creek farther south are among the clearest labels. Wildwood Lake, Davis Lake, Stone Lake, Hoskins Lake, Jersey Meadow Lake, and Green Shadow Lake provide additional water references.
What elevation range does the Bradley County map show?
The supplied elevation map states an actual range of about 206 to 448 meters and a mean of about 261 meters. The main visual feature is a series of elongated higher ridges separated by lower green valleys; the layer is appropriate for general geographic comparison, not survey or engineering measurements.
Map File Information
Download the Bradley County county, city, water, and elevation maps as high-resolution A3 JPG files.
- Included Files: County, city, water, and elevation maps
Related Maps
- Campbell County Tennessee map | Jellico Mountain and I-75
- Bedford County Tennessee Map
- Bledsoe County Map
Sources and references
Tennessee State Library and Archives: Bradley County fact sheet – county history and administrative background.
U.S. Census Bureau TIGER/Line – official geographic reference for boundaries, roads, and place data.
USGS National Hydrography – official reference for streams and mapped water features.
USGS 3D Elevation Program – official elevation and terrain reference.
Green Map creates custom-edited map images using open geographic data sources such as geoBoundaries, Natural Earth, OpenStreetMap, and government open data. These maps are edited visual materials, not raw data files, and are provided for education, documents, presentations, and graphic reference.