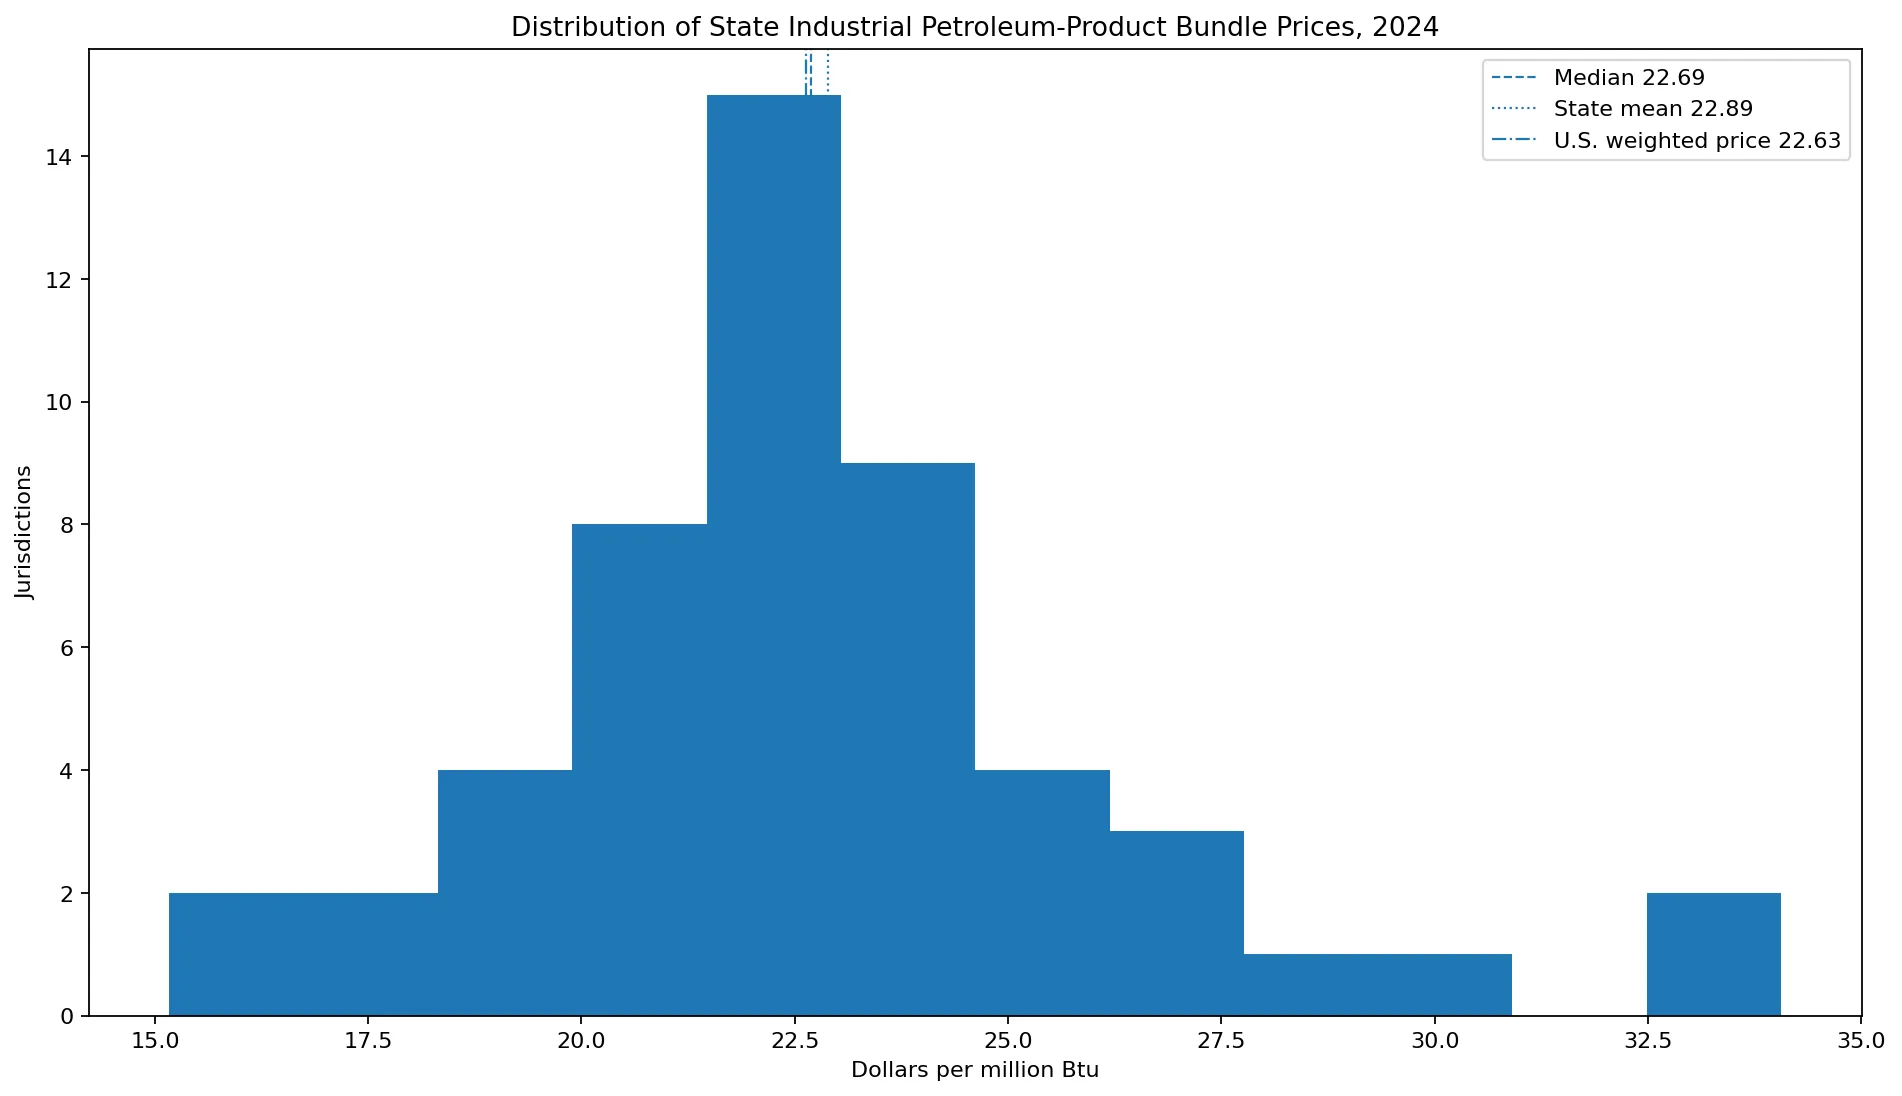
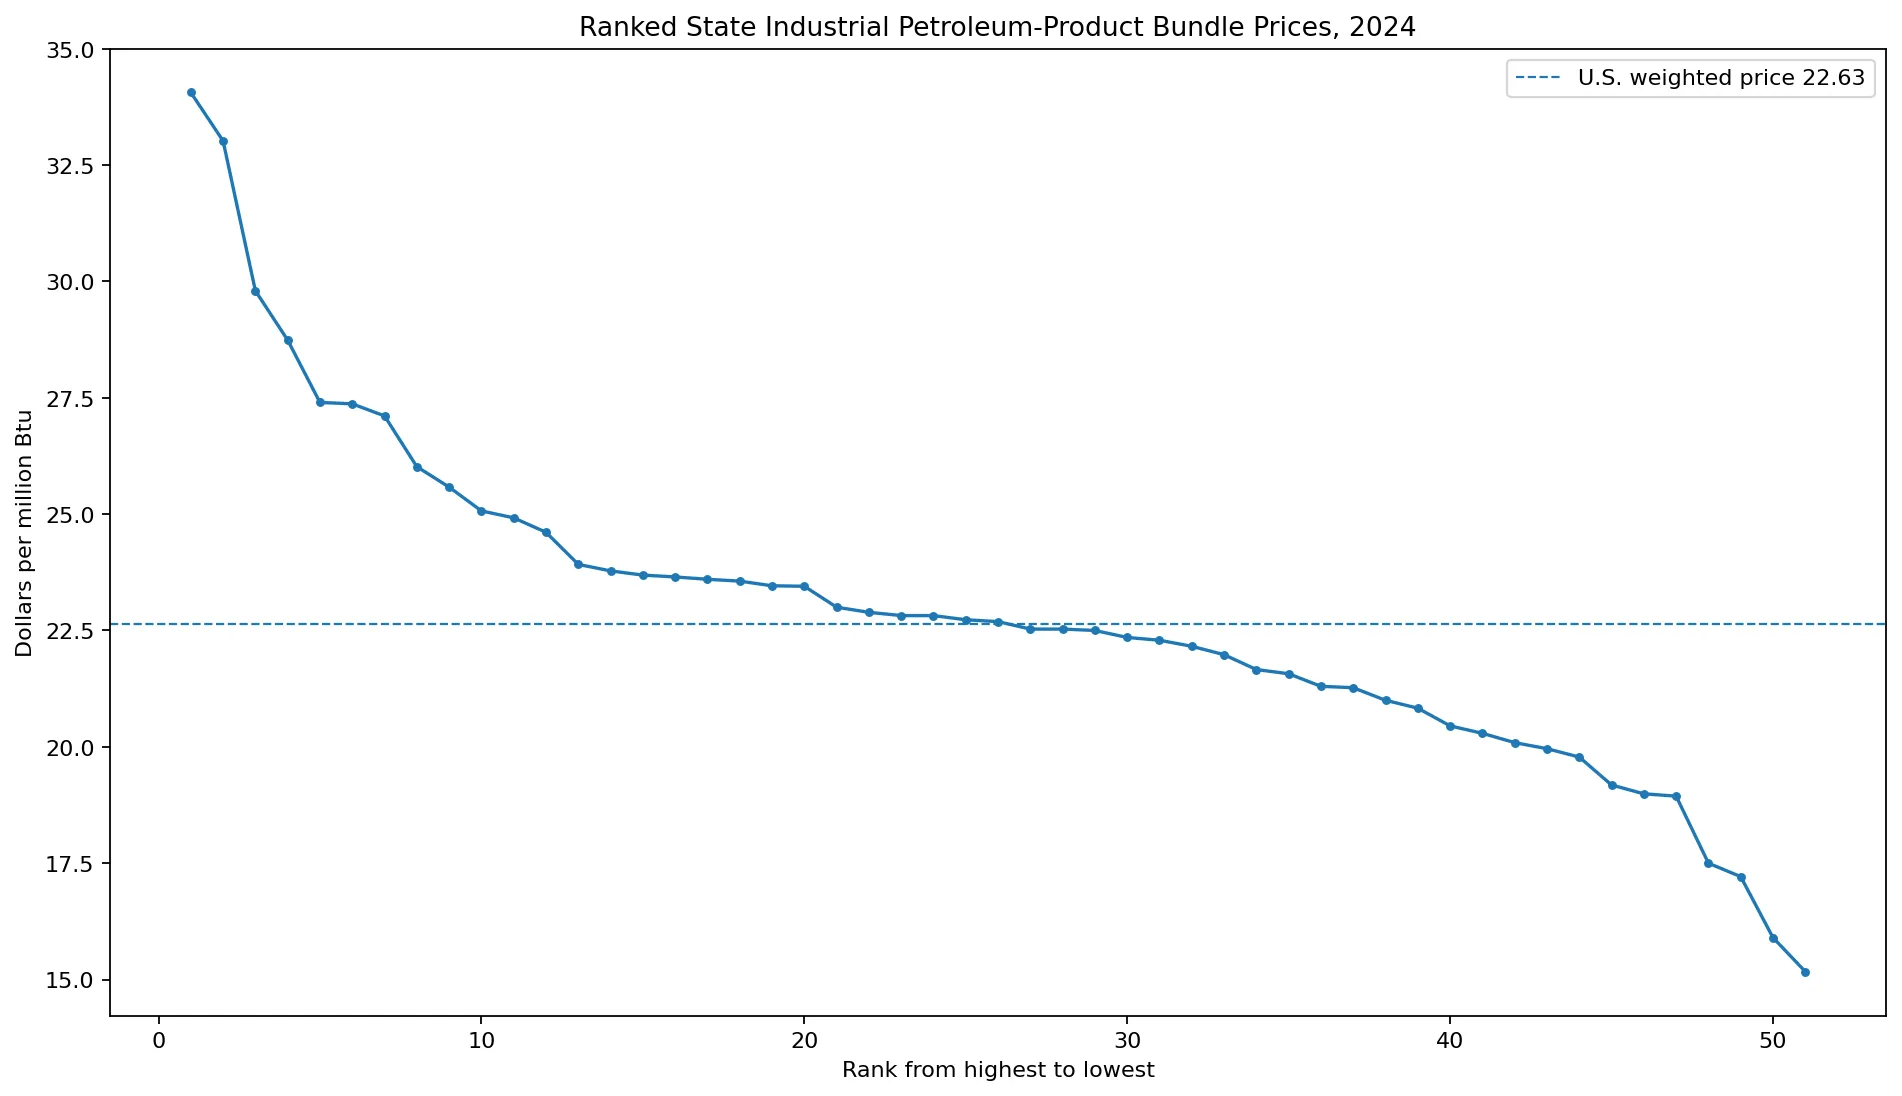
The 2024 industrial-sector average price for a specific bundle of petroleum products varied substantially across U.S. states. The bundle combines asphalt and road oil, kerosene, lubricants, petroleum coke, and EIA’s separate “other petroleum products” category. North Dakota had the highest state value at $34.06 per million Btu, followed by California at $33.02, Colorado at $29.80, and New Mexico at $28.74. Kentucky was lowest at $15.17. The unweighted mean across the 50 states and D.C. was about $22.89, the median was $22.69, and EIA’s U.S. value was $22.63/MMBtu.
The long official name describes an important accounting concept: this is a consumption-weighted average price for a combined petroleum-product group, not a simple arithmetic average of five product prices. EIA’s P1ICD variable divides the group’s industrial-sector expenditures by the group’s industrial-sector energy consumption and converts the result to dollars per million Btu. A state’s result therefore depends on both the prices of the component products and the quantities of those products used by industry.
Table of Contents
Which petroleum products are included
In EIA Table E5, the petroleum column labeled “Other” is broader than the ordinary-language phrase other petroleum products. Its footnote says the category includes asphalt and road oil, kerosene, lubricants, petroleum coke, and the separately defined “other petroleum products” category. These component products serve very different industrial purposes, so the combined indicator should be read as a bundle rather than as the market price of one commodity.
Asphalt and road oil are closely linked to paving and construction. Kerosene can be used for heating or specialized industrial purposes. Lubricants support machinery and equipment. Petroleum coke can be used as an industrial fuel or feedstock in certain processes, while the residual other-petroleum category includes products such as petrochemical feedstocks. The industrial mix of these products can differ sharply from one state to another.
The scope is also narrower than all industrial petroleum. Distillate fuel oil, hydrocarbon gas liquids, motor gasoline, and residual fuel oil appear separately in Table E5. The P1ICD bundle is one component of the broader industrial petroleum total, so its state rankings should not be presented as rankings of all petroleum costs faced by industry.
The price is weighted by expenditures and energy consumption
EIA’s price-and-expenditure variable definitions specify P1ICD as P1ICV divided by P1ISB, multiplied by 1000. P1ICV is the combined industrial expenditure for asphalt and road oil, kerosene, lubricants, other petroleum products, and petroleum coke. P1ISB is the energy consumption associated with that same group.
This calculation gives more influence to products with larger energy consumption and expenditure in a state. If asphalt dominates the bundle in one state, asphalt economics can have a large effect on the combined price. If petroleum coke or petrochemical feedstocks are more important somewhere else, the state result can reflect a very different product mix.
That is why the state value cannot be reconstructed by taking five published product prices and calculating a simple mean. Product quantities matter. A shift toward a higher-priced component can lift the bundle average even if no individual product price changes, while a shift toward a lower-priced component can move the average in the opposite direction.
North Dakota and California are above $30/MMBtu
North Dakota leads at $34.06/MMBtu and California follows at $33.02. They are the only two jurisdictions above $30. Colorado is third at $29.80, New Mexico fourth at $28.74, Hawaii fifth at $27.40, Utah at $27.37, and Oklahoma at $27.11.
North Dakota is $11.43 above the U.S. value of $22.63 and $18.89 above Kentucky, the lowest state. The maximum is about 2.25 times the minimum. That is a large spread for a state energy-price series, but it does not mean every industrial petroleum purchase in North Dakota costs more than twice the corresponding purchase in Kentucky.
The difference can reflect both price levels and composition. A state with a large share of a relatively expensive product in this bundle can show a high P1ICD value. The data do not by themselves identify which component explains North Dakota’s or California’s position; that requires separate consumption and expenditure series for asphalt, kerosene, lubricants, petroleum coke, and the other-petroleum category.
Kentucky is lowest, followed by South Carolina and Montana
Kentucky has the lowest value at $15.17/MMBtu. South Carolina follows at $15.90, Montana at $17.21, the District of Columbia at $17.50, Vermont at $18.94, Michigan at $18.99, and Rhode Island at $19.18. Indiana and New York are also below $20.
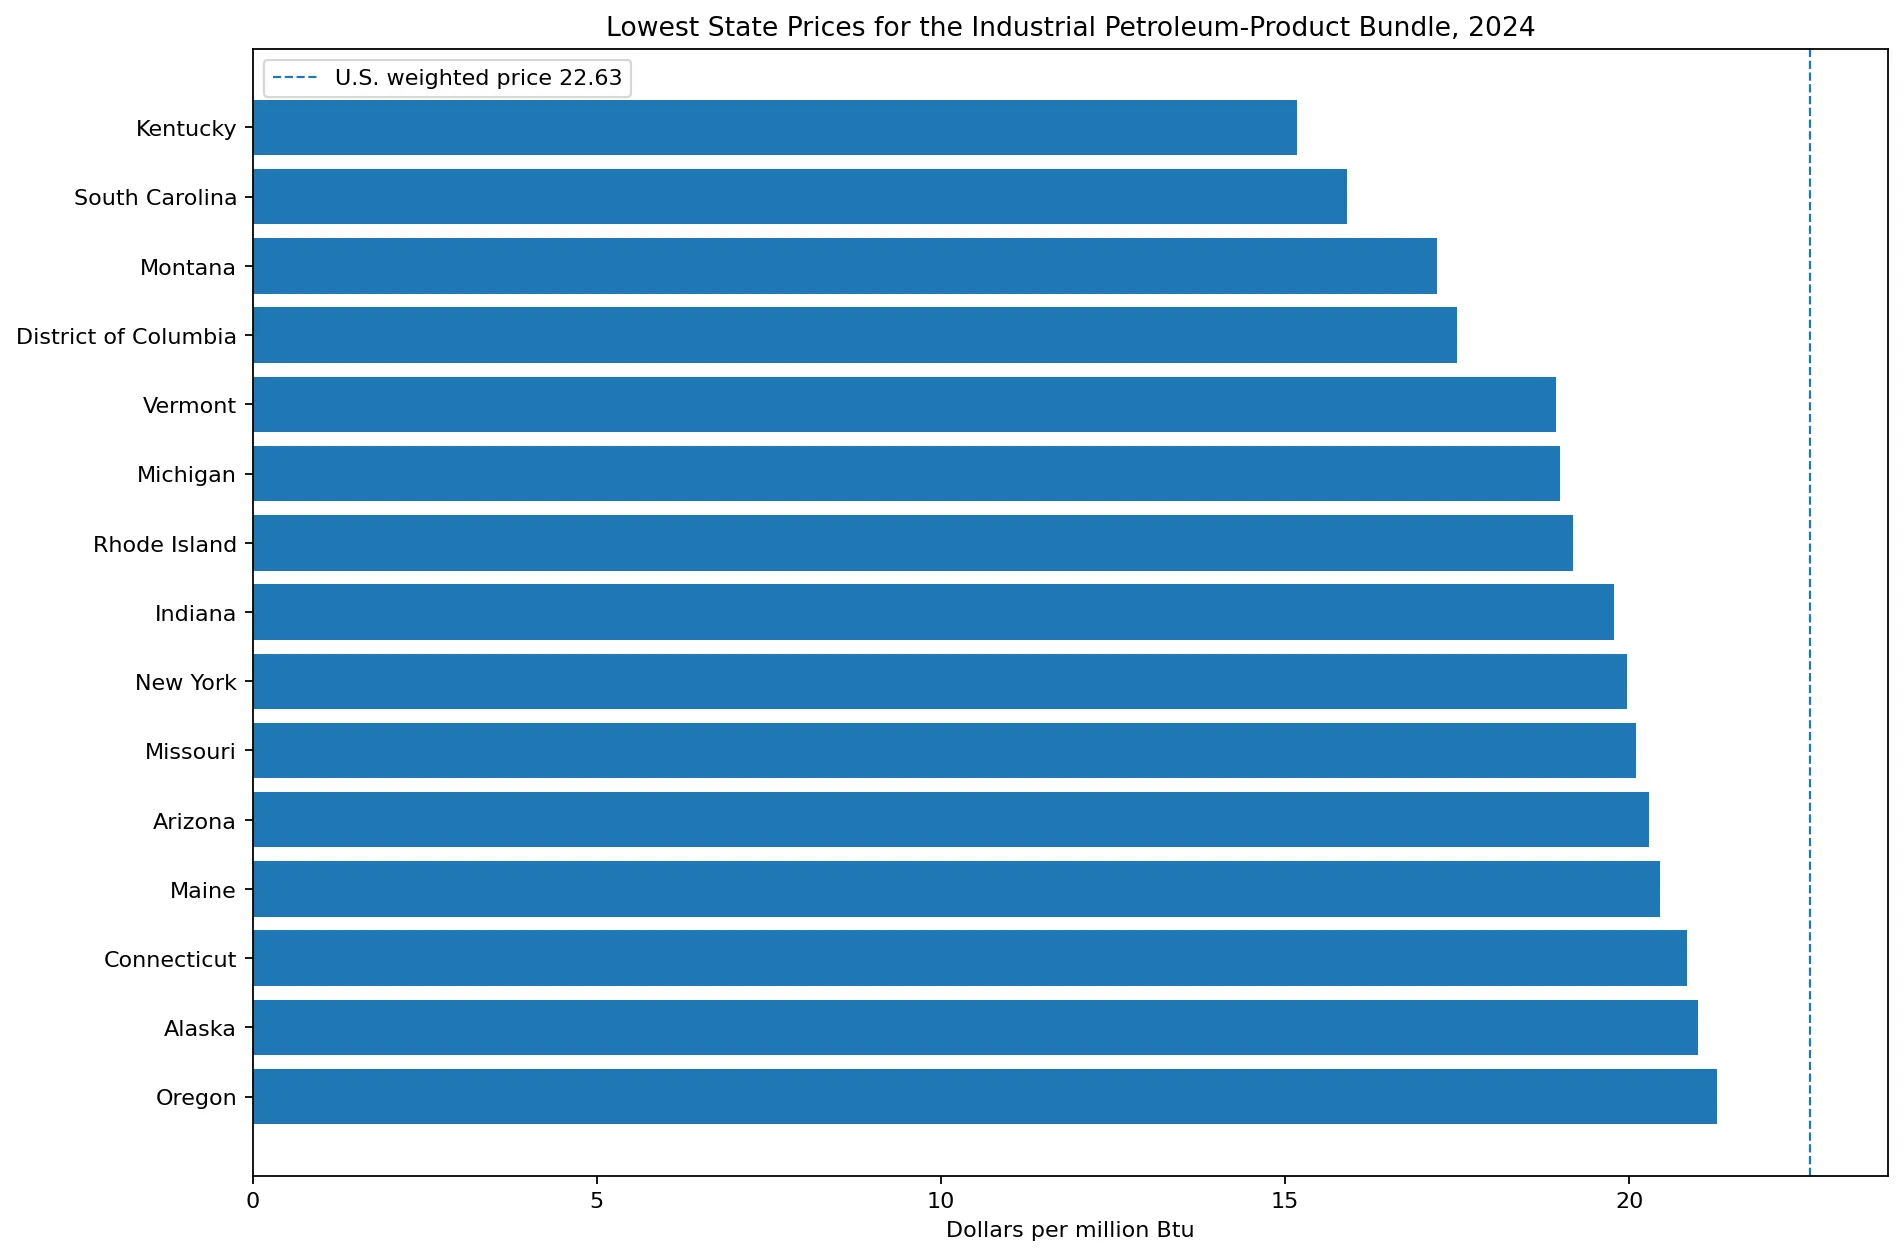
A low bundle price is not an overall measure of low industrial energy costs. Industry may consume much larger quantities of electricity, natural gas, distillate fuel oil, HGL, coal, or other energy sources. If the P1 product group is small in a state’s industrial energy balance, its price has only a limited effect on total energy spending.
Why the U.S. value differs from the simple state average
EIA Table E5 reports a U.S. price of $22.63/MMBtu for this industrial petroleum bundle. The unweighted arithmetic average of the 51 state and D.C. values is about $22.89. The small difference is not a discrepancy; the statistics are constructed differently.
The U.S. P1ICD value is derived from national expenditures and national energy consumption for the product group. In effect, states and product mixes with larger consumption carry more weight. A simple state average gives North Dakota, California, Kentucky, and D.C. exactly the same one-observation weight regardless of how much of the product group their industries consume.
The median of $22.69 answers another question: it marks the middle jurisdiction when states are sorted by price. For a typical state-level observation, the median is useful. For the effective average price paid across the nation’s industrial consumption of this petroleum group, EIA’s $22.63 U.S. value is the appropriate reference.
Product composition can move the state price
The product-mix effect is central to interpreting P1ICD. A single-product series such as asphalt price mainly reflects that product’s price methodology. P1ICD, by contrast, combines multiple products. The same state can move higher or lower because component prices change, because industrial consumption shifts among products, or because both happen at the same time.
That is especially important for year-to-year comparisons. If a state’s P1ICD rises from one year to the next, the result does not automatically mean all five component prices increased. A higher share of a costly component could raise the weighted average. Conversely, a larger share of a lower-priced product could hold down the average even if another product becomes more expensive.
Industrial structure therefore matters. A state with strong petrochemical activity can have a different petroleum-product mix from a state where road construction or machinery-related lubricant use is relatively more important. P1ICD compresses those different mixes into one comparable energy-price measure.
This is not the same as the industrial total-petroleum price
Table E5 also provides a broader industrial petroleum total. That series adds distillate fuel oil, HGL, motor gasoline, residual fuel oil, and this P1 bundle. The two columns can differ substantially. California’s P1ICD bundle price is $33.02/MMBtu, while its industrial total-petroleum price is $29.01.
North Dakota provides an even stronger example. It ranks first in the P1 bundle at $34.06, but its industrial total-petroleum price is $21.86. The difference reflects the broader mix of petroleum products used by industry. Calling the P1 value a state’s overall industrial petroleum price would therefore be inaccurate.
Most jurisdictions cluster in the low-to-mid $20s
The first quartile of the 51 observations is about $20.92 and the third quartile is about $23.85. Half of the jurisdictions lie inside that relatively narrow $2.94 interval. The full range is much wider because North Dakota and California extend the upper tail while Kentucky and South Carolina extend the lower tail.
Ten jurisdictions are at or above $25/MMBtu and nine are below $20. Most of the remaining observations fall between $20 and $25. Looking only at the maximum and minimum can therefore overstate how dispersed the majority of states are.
How to verify the EIA definition
EIA Table E5 presents 2024 industrial-sector energy prices for coal, natural gas, petroleum, biomass, electricity, and total energy. Its petroleum footnote defines the “Other” column as asphalt and road oil, kerosene, lubricants, petroleum coke, and the separate “other petroleum products” category.
The 2024 SEDS price and expenditure variable definitions identify P1ICD and give the formula P1ICV ÷ P1ISB × 1000. The same appendix defines P1ICV as the sum of industrial expenditures for the five component product groups.
All 51 jurisdictions in 2024
The table below lists the 50 states and the District of Columbia from the highest to the lowest P1ICD value. Every jurisdiction has a positive 2024 price and the unit is dollars per million Btu.
| Rank | State | Code | Year | $/MMBtu |
|---|---|---|---|---|
| 1 | North Dakota | ND | 2024 | 34.06 |
| 2 | California | CA | 2024 | 33.02 |
| 3 | Colorado | CO | 2024 | 29.80 |
| 4 | New Mexico | NM | 2024 | 28.74 |
| 5 | Hawaii | HI | 2024 | 27.40 |
| 6 | Utah | UT | 2024 | 27.37 |
| 7 | Oklahoma | OK | 2024 | 27.11 |
| 8 | Nebraska | NE | 2024 | 26.02 |
| 9 | Illinois | IL | 2024 | 25.58 |
| 10 | Alabama | AL | 2024 | 25.07 |
| 11 | Massachusetts | MA | 2024 | 24.92 |
| 12 | Kansas | KS | 2024 | 24.61 |
| 13 | New Hampshire | NH | 2024 | 23.92 |
| 14 | North Carolina | NC | 2024 | 23.78 |
| 15 | Tennessee | TN | 2024 | 23.69 |
| 16 | Maryland | MD | 2024 | 23.65 |
| 17 | Iowa | IA | 2024 | 23.60 |
| 18 | Pennsylvania | PA | 2024 | 23.56 |
| 19 | Washington | WA | 2024 | 23.46 |
| 20 | South Dakota | SD | 2024 | 23.45 |
| 21 | Nevada | NV | 2024 | 23.00 |
| 22 | West Virginia | WV | 2024 | 22.89 |
| 23 | Virginia | VA | 2024 | 22.82 |
| 24 | Wisconsin | WI | 2024 | 22.82 |
| 25 | Wyoming | WY | 2024 | 22.73 |
| 26 | Arkansas | AR | 2024 | 22.69 |
| 27 | New Jersey | NJ | 2024 | 22.53 |
| 28 | Ohio | OH | 2024 | 22.53 |
| 29 | Texas | TX | 2024 | 22.50 |
| 30 | Delaware | DE | 2024 | 22.35 |
| 31 | Minnesota | MN | 2024 | 22.29 |
| 32 | Florida | FL | 2024 | 22.16 |
| 33 | Idaho | ID | 2024 | 21.98 |
| 34 | Mississippi | MS | 2024 | 21.66 |
| 35 | Louisiana | LA | 2024 | 21.57 |
| 36 | Georgia | GA | 2024 | 21.30 |
| 37 | Oregon | OR | 2024 | 21.27 |
| 38 | Alaska | AK | 2024 | 21.00 |
| 39 | Connecticut | CT | 2024 | 20.83 |
| 40 | Maine | ME | 2024 | 20.45 |
| 41 | Arizona | AZ | 2024 | 20.29 |
| 42 | Missouri | MO | 2024 | 20.09 |
| 43 | New York | NY | 2024 | 19.96 |
| 44 | Indiana | IN | 2024 | 19.78 |
| 45 | Rhode Island | RI | 2024 | 19.18 |
| 46 | Michigan | MI | 2024 | 18.99 |
| 47 | Vermont | VT | 2024 | 18.94 |
| 48 | District of Columbia | DC | 2024 | 17.50 |
| 49 | Montana | MT | 2024 | 17.21 |
| 50 | South Carolina | SC | 2024 | 15.90 |
| 51 | Kentucky | KY | 2024 | 15.17 |
Frequently Asked Questions
Which state had the highest 2024 price for this industrial petroleum-product bundle?
North Dakota was highest at $34.06/MMBtu, followed by California at $33.02.
Which products are included in the P1ICD bundle?
It includes asphalt and road oil, kerosene, lubricants, petroleum coke, and EIA’s separate other petroleum products category.
Is P1ICD a simple average of five product prices?
No. EIA divides combined industrial expenditures for the product group by the group’s industrial energy consumption, producing a consumption-weighted average price.
What was the U.S. price in 2024?
EIA Table E5 reports $22.63/MMBtu for the United States. It is not the simple arithmetic mean of the 51 state and D.C. prices.
Related Articles
Green Map creates custom-edited map images using open geographic data sources such as geoBoundaries, Natural Earth, OpenStreetMap, and government open data. These maps are edited visual materials, not raw data files, and are provided for education, documents, presentations, and graphic reference.