The World Bank indicator TM.VAL.TRVL.ZS.WT measures travel services as a percentage of commercial service imports. This dataset contains the latest non-empty observation for 198 countries and territories. Across those latest observations, the median is 20.25%, while the middle half lies between roughly 10.44% and 29.88%. The key limitation is timing: the observations are not all from 2025. There are 96 observations from 2025, 66 from 2024 and 14 from 2023, with a smaller group of countries represented by older values. The map therefore shows the latest available value by economy rather than a synchronized 2025 ranking.
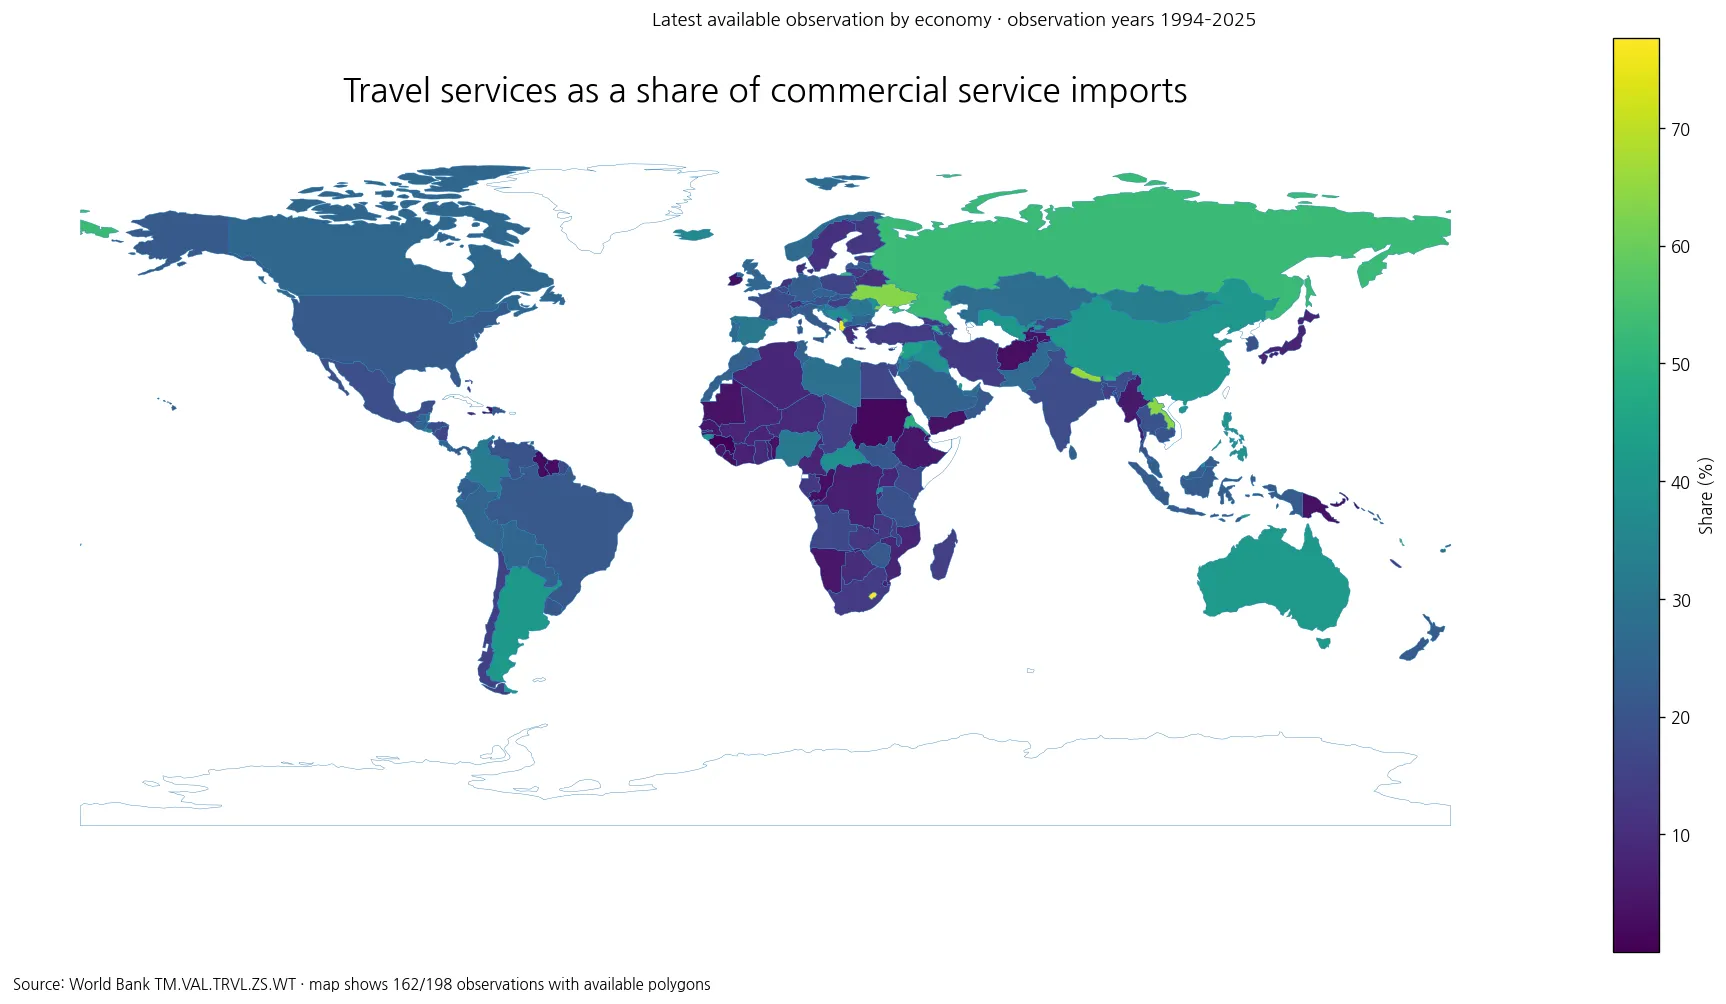
Table of Contents
The indicator compares composition, not the absolute size of travel spending
Travel services in the balance-of-payments framework cover goods and services acquired for own use or to give away during visits abroad. The World Bank expresses this travel-services item as a share of commercial service imports supplied by nonresidents to residents. A value of 30% means that travel services account for 30% of commercial service imports. It does not say that travel spending equals 30% of all imports, nor does it report visitor arrivals, nights, or the absolute monetary value of travel-service imports.
That distinction matters because a percentage can change through either side of the ratio. A country can have substantial travel-service imports and still show a modest share if its imports of transport, finance, telecommunications, professional services or other commercial services are even larger. Another country can show a high share with a much smaller absolute amount if the rest of its service-import basket is limited. The map is best read as a picture of service-import composition rather than a league table of tourism scale.
The latest-observation series mixes years from 1994 through 2025
Of the 198 observations, 96 are dated 2025 and 66 are dated 2024, giving 162 observations from those two recent years. Another 14 are from 2023. There are 7 observations from 2020–2022 and 15 whose latest available value predates 2020. The oldest value in the file is from 1994. This is a direct consequence of collecting the most recent non-empty observation for each economy rather than requiring a single common year.
The mixed-year coverage is useful for a broad world view, but it changes how rankings should be interpreted. A high latest value from 2022 is not directly contemporaneous with a 2025 value from another country. The two numbers can still show the last reported position of each economy, but they should not be used as evidence that one economy currently exceeds another in the same year. For a cleaner cross-section, the 2025-only subset below is more appropriate.
| Highest latest observations | Observation year | Share (%) |
|---|---|---|
| Lesotho | 2025 | 77.67 |
| Albania | 2025 | 76.74 |
| Nepal | 2024 | 65.76 |
| Lao PDR | 2024 | 64.25 |
| Ukraine | 2024 | 63.47 |
| Kosovo | 2025 | 55.87 |
| Lebanon | 2023 | 55.83 |
| Curacao | 2023 | 53.00 |
| Russian Federation | 2025 | 52.70 |
| Vanuatu | 2022 | 51.51 |
| Lowest latest observations | Observation year | Share (%) |
|---|---|---|
| Guinea | 2022 | 0.01 |
| Sudan | 2022 | 1.56 |
| Guyana | 2023 | 2.03 |
| Suriname | 2025 | 2.55 |
| Haiti | 2024 | 2.58 |
| Congo, Rep. | 2021 | 2.79 |
| Afghanistan | 2020 | 2.88 |
| Liberia | 2024 | 3.02 |
| Ireland | 2024 | 3.03 |
| Djibouti | 2024 | 3.05 |
Among the 96 economies observed in 2025, the median was 21.69%
Restricting the comparison to 2025 leaves 96 economies. Their mean share is 24.22% and their median is 21.69%. The interquartile range is approximately 15.17% to 30.11%. The median is slightly above the 20.25% median calculated across all latest observations, but that difference should not be treated as a global time trend because the set of economies is not identical.
Within the 2025 subset, Lesotho records 77.67% and Albania 76.74%, followed by Kosovo at 55.87%, the Russian Federation at 52.70% and Armenia at 50.29%. At the other end, Suriname is at 2.55%, Tajikistan at 3.55% and Luxembourg at 4.18%. These values identify the relative weight of travel services inside commercial service imports, not the size of the underlying economy or the number of international trips.
| Highest 2025 observations | Year | Share (%) |
|---|---|---|
| Lesotho | 2025 | 77.67 |
| Albania | 2025 | 76.74 |
| Kosovo | 2025 | 55.87 |
| Russian Federation | 2025 | 52.70 |
| Armenia | 2025 | 50.29 |
| Timor-Leste | 2025 | 44.85 |
| Kuwait | 2025 | 44.47 |
| Qatar | 2025 | 42.69 |
| Australia | 2025 | 41.85 |
| Argentina | 2025 | 41.52 |
| Lowest 2025 observations | Year | Share (%) |
|---|---|---|
| Suriname | 2025 | 2.55 |
| Tajikistan | 2025 | 3.55 |
| Luxembourg | 2025 | 4.18 |
| Congo, Dem. Rep. | 2025 | 6.40 |
| Japan | 2025 | 7.32 |
| Grenada | 2025 | 7.38 |
| Montenegro | 2025 | 8.52 |
| Singapore | 2025 | 8.81 |
| Burundi | 2025 | 9.26 |
| Ghana | 2025 | 9.32 |
Neighboring countries can have very different service-import structures
The spatial pattern is not a simple regional block. Among the 162 observations that match the available country polygons, the mapped median for Africa is about 9.32%, but Lesotho is a major exception. Lesotho and South Africa are neighbors and both have 2025 observations, yet their shares are 77.67% and 13.18%, respectively. That is a large contrast within the same local geography.
Similar contrasts appear elsewhere. Albania is at 76.74% in 2025 while neighboring Montenegro is at 8.52%. China records 40.99% and India 17.64% in the same year. Argentina is at 41.52% compared with Chile at 14.77%. These examples are useful because the year is aligned within each pair. They demonstrate that geography alone does not determine the ratio. The dataset does not identify the causes of the differences, so the map should not be used to attribute them to policy, income, tourism preference or any other factor without additional evidence.
The boundary file used for the static map contains country polygons for 162 of the 198 source observations. Many of the unmatched rows are small islands or territories that are absent from the low-resolution base map. Their values remain in the source tables and summary statistics, and they are not replaced by zero. As a result, continent summaries based on mapped polygons are descriptive aids rather than complete regional benchmarks.
A high percentage means travel services are relatively important within commercial service imports
A high ratio indicates that travel services occupy a large slice of the commercial service-import basket. It can be economically meaningful because it describes composition, but it is not a direct measure of how much money residents spend abroad. A small economy with a narrow set of other service imports may produce a high percentage with a modest absolute amount. A large economy may spend far more on travel in absolute terms but show a lower share because it imports many other services.
The 2025 values for the United States, Canada and Mexico illustrate the point: 21.84%, 25.52% and 18.32%, respectively. These are shares, not totals. The Republic of Korea records 19.46% in 2025, close to the 20.25% median of all latest observations. That placement says where travel services sit within its service-import mix; it does not indicate the number of travelers or the monetary value of travel imports.
The map cannot be used as a trend chart
Because observation years differ across economies, a single latest-value map cannot show whether a country is moving upward or downward through time. A 2025 observation and a 2016 observation represent different moments. Connecting them as if they were one cross-section would confuse data availability with economic change. Measuring a trend requires repeated observations for the same economy under the same indicator definition.
The older rows should therefore remain explicitly dated rather than estimated forward. The file contains historical latest values for some economies because no newer non-empty observation was returned. The analysis does not impute a 2025 number, carry an old percentage forward as a new estimate, or treat a missing year as zero. Preserving the original year is essential to keep the map honest.
Travel-service shares answer a different question from visitor counts or tourism receipts
Several tourism-related indicators can look similar while measuring different things. Visitor arrivals count people or trips. Tourism receipts measure money received from nonresident visitors. Travel-service imports measure residents’ acquisition of goods and services during visits abroad in the balance of payments. The present indicator then divides that travel-services value by commercial service imports. Combining these measures without checking definitions, direction of flow and denominator can produce misleading comparisons.
A useful workflow is to read the map in three steps. First, identify broad concentrations, outliers and sharp differences between neighbors. Second, check the observation year attached to each value. Third, use the same-year subset when making direct cross-country rankings. This keeps the wide 198-economy coverage while preventing an old observation from being presented as if it were a 2025 measurement.
The most informative next step is a country-level time series
A time-series extension would allow the share to be tracked within each country, rather than comparing mixed latest years. It could answer whether travel services are becoming more or less important inside commercial service imports and whether the post-pandemic recovery changed the composition. That analysis would need annual observations from the same World Bank indicator and should preserve gaps instead of interpolating them without evidence.
A second extension would pair the percentage with the absolute value of travel-service imports and total commercial service imports for the same year. That would separate composition from scale. Countries with the same percentage could then be distinguished by the size of the underlying flows, while countries with very different percentages could be checked for denominator effects. The current map deliberately stays with the verified ratio and does not infer those missing quantities.
Frequently Asked Questions
What does the travel-services share measure?
World Bank indicator TM.VAL.TRVL.ZS.WT measures travel-service imports as a percentage of commercial service imports. It is a composition ratio, not a visitor count or an absolute spending measure.
Are all observations on the map from 2025?
No. The 198 latest observations range from 1994 to 2025. 96 are from 2025 and 66 from 2024 because the dataset keeps the latest available value for each economy.
Does a higher share mean a country has more outbound travelers?
No. A higher percentage means travel services occupy a larger share of commercial service imports. Traveler numbers and absolute travel spending require different indicators.
Related Articles
Green Map creates custom-edited map images using open geographic data sources such as geoBoundaries, Natural Earth, OpenStreetMap, and government open data. These maps are edited visual materials, not raw data files, and are provided for education, documents, presentations, and graphic reference.