Residential end-use energy consumption totaled 11210868 billion Btu across the 50 states and the District of Columbia in 2024. California was highest at 863076 billion Btu, followed by Texas at 802809 and New York at 743592. Illinois recorded 551736 and Florida 548280 billion Btu. The ten largest jurisdictions accounted for about 51.1% of the combined total, showing that a large share of household energy use is concentrated in the biggest state markets.
The word “end-use” is essential. In EIA’s State Energy Data System, residential end-use energy consumption includes fuels used directly in homes plus electricity sold to ultimate residential customers. It excludes electrical system energy losses incurred in generation, transmission, and distribution. That means the measure is not the same as total residential energy consumption, which adds those upstream electricity losses back to end use.
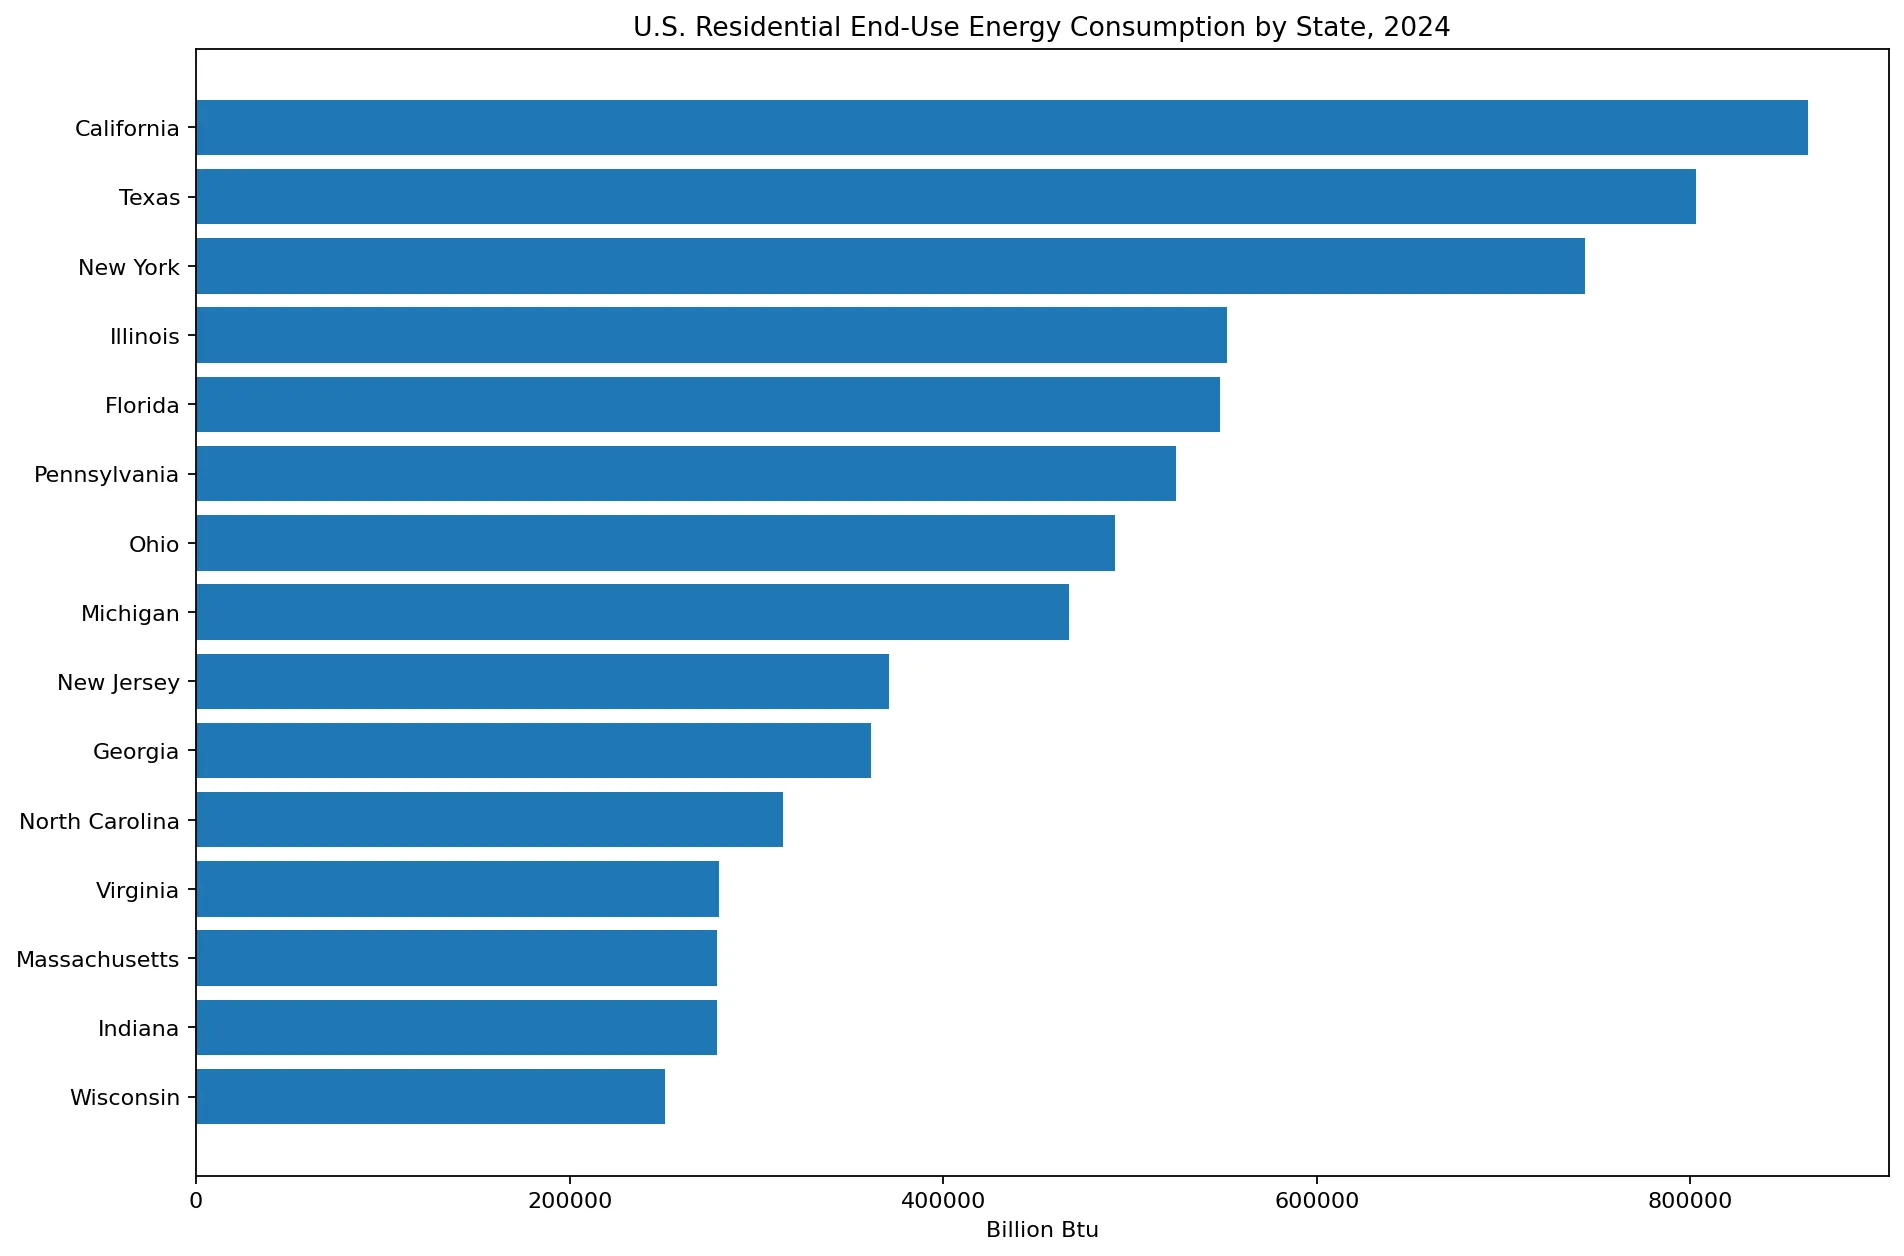
Table of Contents
What residential end-use energy consumption includes
EIA Table C5 breaks residential energy consumption into coal, natural gas, petroleum products, biomass, geothermal, solar, electricity, end use, electrical system energy losses, and total energy. End use is the energy that reaches the residential sector in forms households actually consume. It includes direct fuel use and electricity sales to ultimate customers. Natural gas includes supplemental gaseous fuels that are commingled with natural gas, while petroleum covers products such as distillate fuel oil, hydrocarbon gas liquids, and kerosene.
Electricity requires special treatment because the energy system consumes much more primary energy to produce and deliver electricity than the electrical energy that ultimately reaches homes. End-use consumption counts the electricity sold to residential customers. It does not assign the generation, transmission, and distribution losses to the household as if they were consumed inside the home. EIA reports those losses in a separate column and adds them to end use only when calculating total residential energy consumption.
SEDS also adjusts for double counting of supplemental gaseous fuels. These gases can appear within natural gas and within the fossil fuels from which they are derived, so simply adding every displayed fuel component can overstate consumption. The published end-use value is the appropriate comparison measure because it incorporates EIA’s accounting adjustments.
California leads the 2024 end-use ranking
California records 863076 billion Btu of residential end-use energy consumption, the highest value in the dataset. Texas follows at 802809 billion Btu and New York at 743592. Together, the three largest jurisdictions account for about 21.5% of the 51-jurisdiction total.
Illinois ranks fourth at 551736 billion Btu, narrowly ahead of Florida at 548280. Pennsylvania records 524821, Ohio 491798, Michigan 467596, New Jersey 371025, and Georgia 361476. The first ten jurisdictions together represent about 51.1% of national state-and-D.C. residential end-use consumption.
These are absolute energy volumes, not efficiency scores. Large populations and large numbers of occupied homes naturally push a state upward in an absolute ranking. Climate, housing type, household size, heating fuel, cooling demand, appliance use, and electrification also affect energy demand. A smaller state can have high energy use per household while still appearing low in total consumption.
End use and total residential energy are different statistics
The distinction is visible in EIA Table C5. California has about 863.1 trillion Btu of residential end use and about 284.0 trillion Btu of electrical system losses, producing total residential energy consumption of about 1147.1 trillion Btu. Texas has about 802.8 trillion Btu of end use but roughly 711.2 trillion Btu of electrical system losses, producing a total of about 1514.0 trillion Btu.
As a result, California ranks above Texas for residential end-use consumption, while Texas ranks above California when total residential energy consumption includes electrical system losses. The change in order is not a contradiction; it reflects two different accounting boundaries. End use is closer to energy delivered to and directly consumed by households. Total energy adds the upstream energy losses associated with electricity service.
Electrical system energy losses include losses in electricity generation, transmission, and distribution, plant use, and unaccounted-for losses. These are real energy-system requirements, but they do not occur as direct household consumption. Analysts interested in household demand often prefer end use, while analysts interested in the full energy-system burden of serving residential demand may prefer total energy.
The top ten jurisdictions account for just over half
The cumulative distribution rises quickly through the largest states. California alone represents about 7.7% of the total, the top three about 21.5%, the top five about 31.3%, and the top ten about 51.1%. The remaining 41 jurisdictions share the other half.
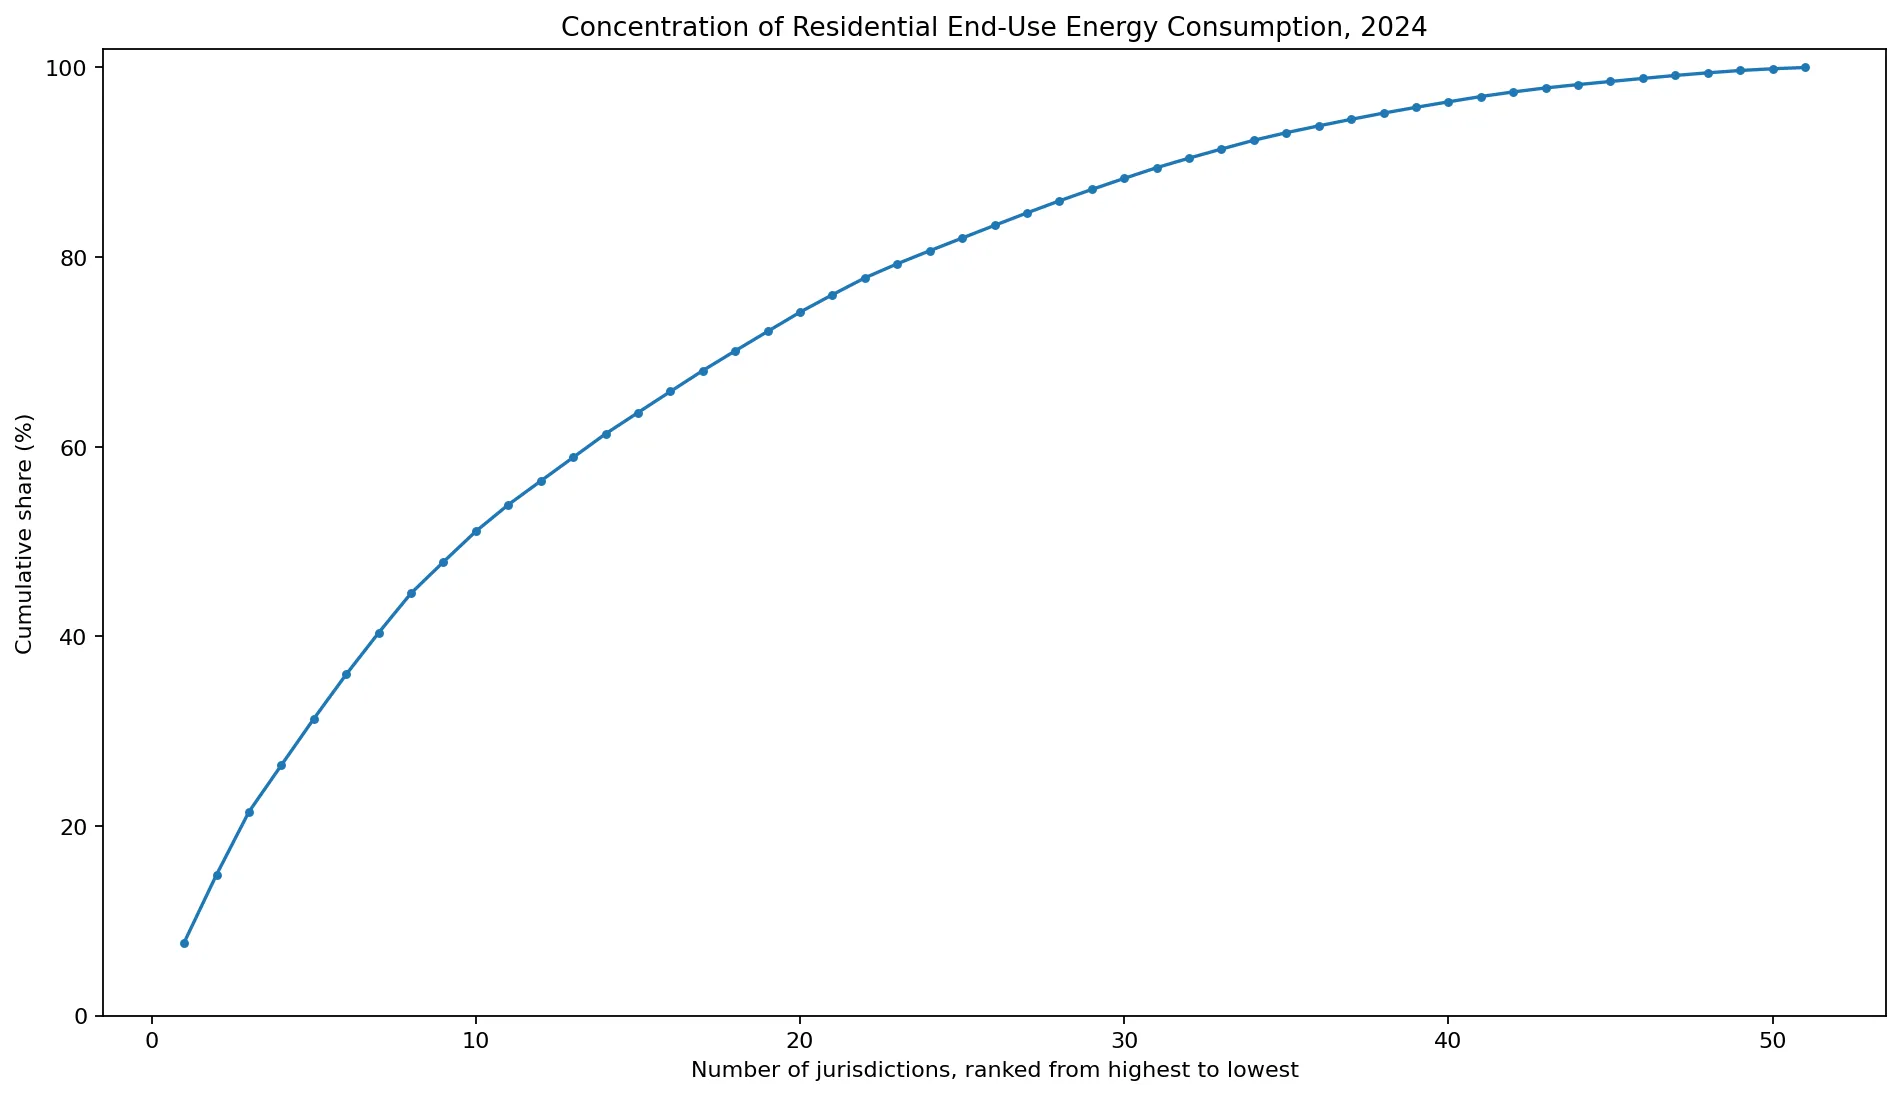
Population concentration explains part of this structure, but residential energy demand is not simply proportional to population. Heating and cooling requirements vary by climate, detached homes and apartments have different energy profiles, and state fuel mixes range from natural-gas-heavy systems to electricity-heavy systems. Those factors can move states above or below what population alone would suggest.
The median is well below the mean
The unweighted mean across 51 jurisdictions is about 219821 billion Btu, while the median is 150203. The middle half of observations lies between about 70990 and 279042 billion Btu. The mean is pulled upward by the very large values for California, Texas, New York, and several other populous states.
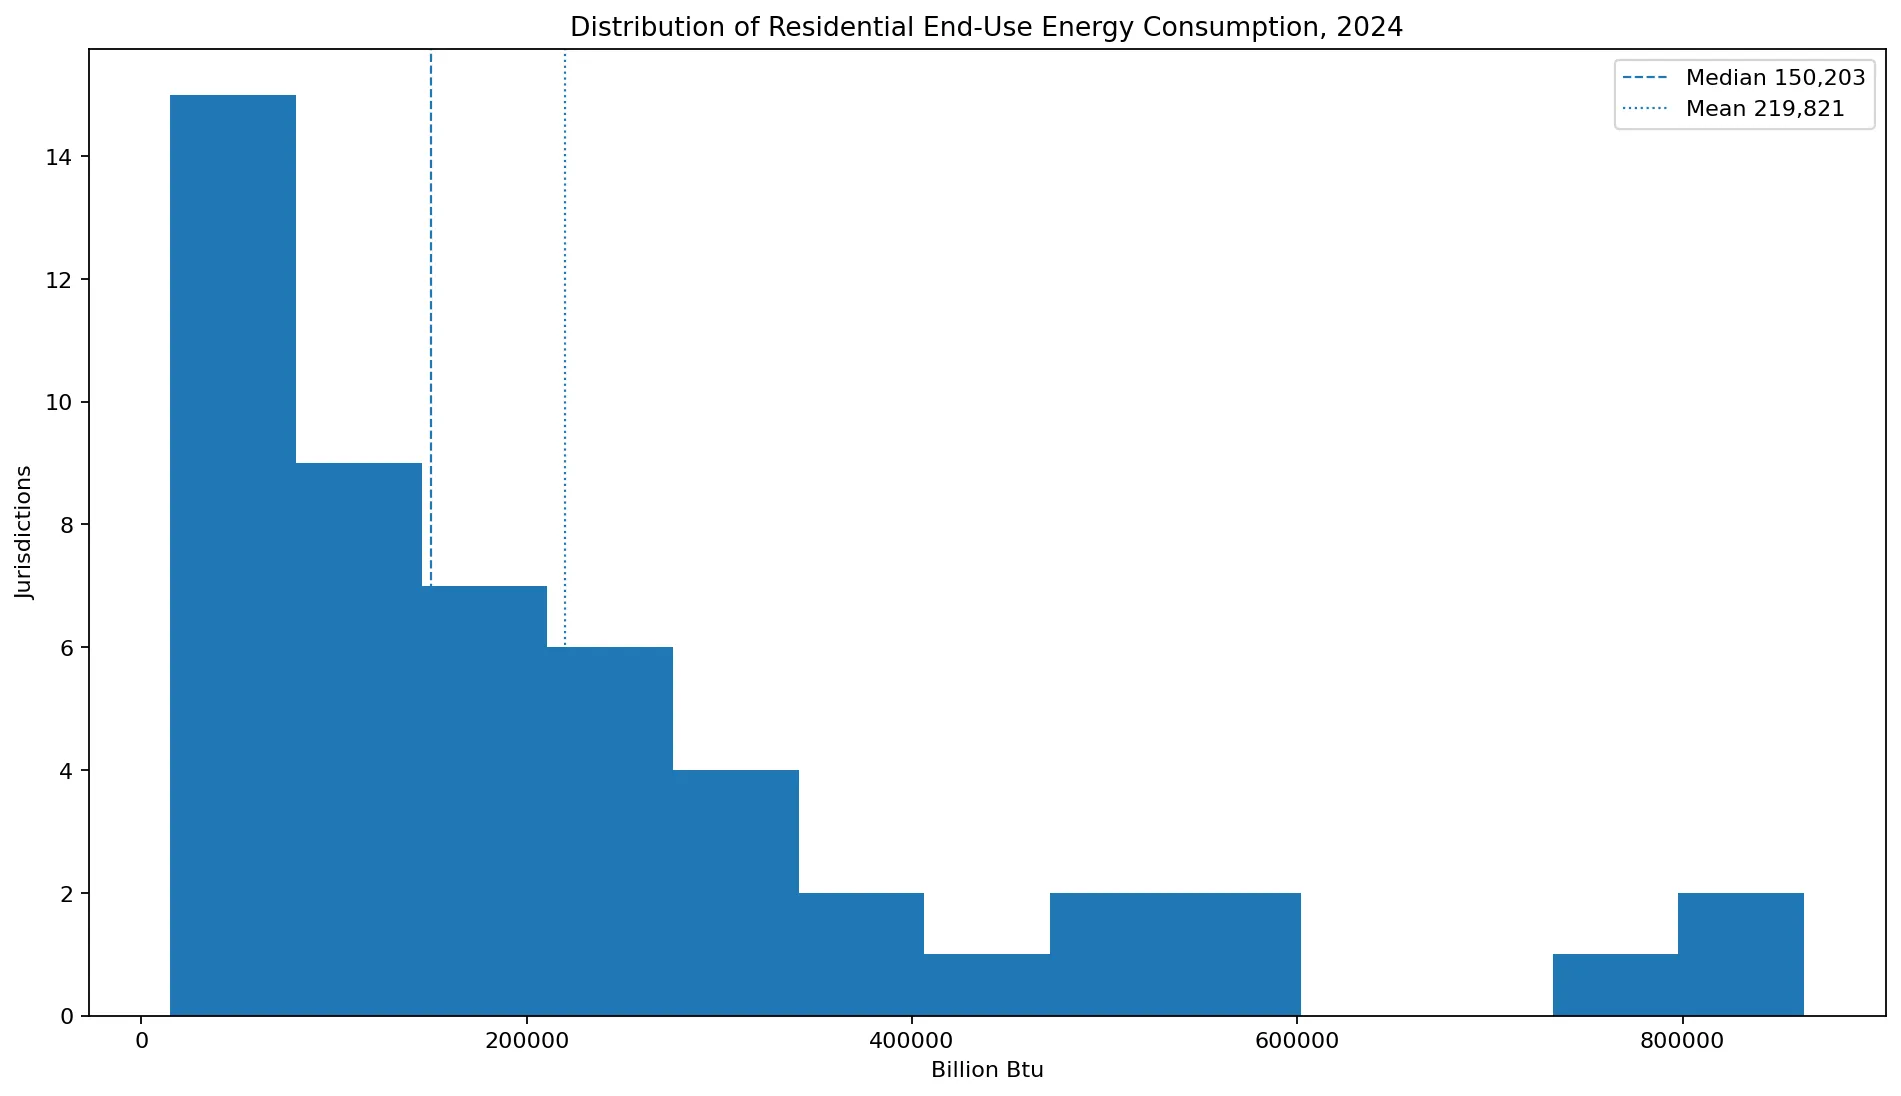
For a description of the middle jurisdiction, the median is more informative than the mean alone. For the size of the national residential market, the sum and concentration shares are more relevant. Those statistics answer different questions and should not be substituted for one another.
Hawaii and the District of Columbia are smallest in absolute terms
Hawaii has the smallest value at 15161 billion Btu. The District of Columbia follows at 20216, Wyoming at 27597, Vermont at 31126, Delaware at 35214, North Dakota at 35885, South Dakota at 36985, and Alaska at 39464 billion Btu.
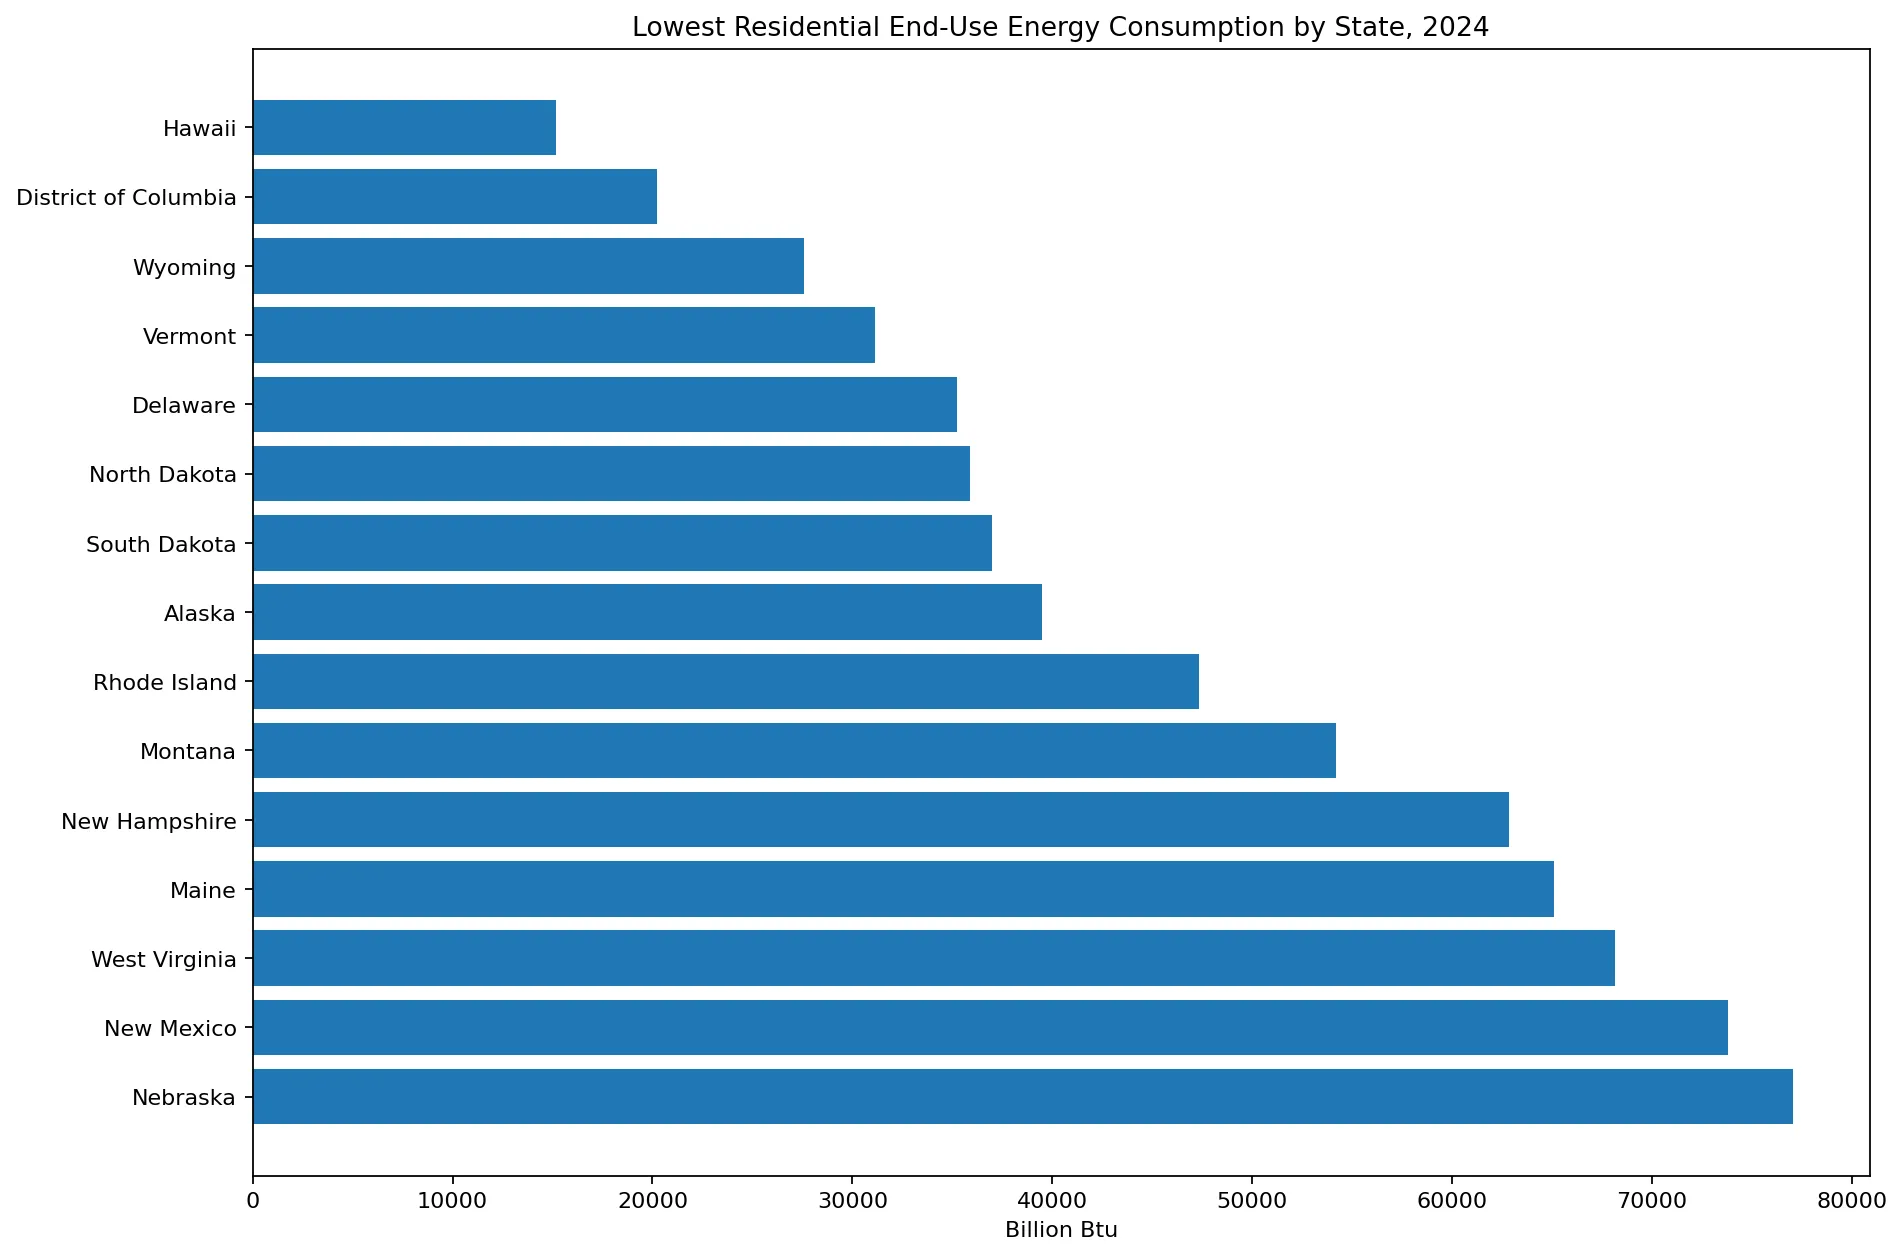
A low absolute total should not be interpreted as evidence of superior residential energy efficiency. Population, number of households, housing stock, urban form, and climate differ enormously across these jurisdictions. Per-capita, per-household, or per-square-foot indicators are better suited to questions about energy intensity.
Why combining direct fuels and electricity matters
Homes use multiple forms of energy. A residence can consume natural gas for space heating and water heating, electricity for cooling and appliances, propane or heating oil in some regions, wood in others, and small amounts of solar or geothermal energy. Looking at electricity alone would miss large direct-fuel differences between states.
SEDS converts these energy forms to a common Btu basis and then sums them within the end-use accounting boundary. That makes cross-state comparisons possible even when fuel mixes differ. The total Btu value, however, does not tell us energy cost or carbon emissions. Prices and emission factors differ by fuel, so expenditure and emissions require separate datasets.
How to use the EIA tables together
EIA Table C5 shows 2024 residential energy consumption by fuel and separates End use, Electrical system energy losses, and Total. Table C11 ranks total energy consumption by end-use sector and therefore uses the broader total measure that includes electricity-system losses. Reading both tables prevents the common mistake of treating end use and total residential energy as interchangeable.
All 51 jurisdictions in 2024
The table below lists all 50 states and the District of Columbia from the largest to the smallest residential end-use energy consumption. Values are billion Btu and retain the annual EIA observations supplied for 2024.
| Rank | State | Code | Year | Billion Btu |
|---|---|---|---|---|
| 1 | California | CA | 2024 | 863076 |
| 2 | Texas | TX | 2024 | 802809 |
| 3 | New York | NY | 2024 | 743592 |
| 4 | Illinois | IL | 2024 | 551736 |
| 5 | Florida | FL | 2024 | 548280 |
| 6 | Pennsylvania | PA | 2024 | 524821 |
| 7 | Ohio | OH | 2024 | 491798 |
| 8 | Michigan | MI | 2024 | 467596 |
| 9 | New Jersey | NJ | 2024 | 371025 |
| 10 | Georgia | GA | 2024 | 361476 |
| 11 | North Carolina | NC | 2024 | 314209 |
| 12 | Virginia | VA | 2024 | 280195 |
| 13 | Massachusetts | MA | 2024 | 279144 |
| 14 | Indiana | IN | 2024 | 278939 |
| 15 | Wisconsin | WI | 2024 | 251212 |
| 16 | Washington | WA | 2024 | 249621 |
| 17 | Minnesota | MN | 2024 | 246915 |
| 18 | Missouri | MO | 2024 | 233874 |
| 19 | Tennessee | TN | 2024 | 229592 |
| 20 | Colorado | CO | 2024 | 227813 |
| 21 | Arizona | AZ | 2024 | 206554 |
| 22 | Maryland | MD | 2024 | 198826 |
| 23 | Connecticut | CT | 2024 | 166811 |
| 24 | South Carolina | SC | 2024 | 153519 |
| 25 | Alabama | AL | 2024 | 150266 |
| 26 | Oklahoma | OK | 2024 | 150203 |
| 27 | Kentucky | KY | 2024 | 147421 |
| 28 | Louisiana | LA | 2024 | 142430 |
| 29 | Oregon | OR | 2024 | 134990 |
| 30 | Iowa | IA | 2024 | 130580 |
| 31 | Utah | UT | 2024 | 126764 |
| 32 | Kansas | KS | 2024 | 112928 |
| 33 | Nevada | NV | 2024 | 107798 |
| 34 | Arkansas | AR | 2024 | 103733 |
| 35 | Mississippi | MS | 2024 | 89486 |
| 36 | Idaho | ID | 2024 | 80657 |
| 37 | Nebraska | NE | 2024 | 77047 |
| 38 | New Mexico | NM | 2024 | 73831 |
| 39 | West Virginia | WV | 2024 | 68149 |
| 40 | Maine | ME | 2024 | 65096 |
| 41 | New Hampshire | NH | 2024 | 62873 |
| 42 | Montana | MT | 2024 | 54183 |
| 43 | Rhode Island | RI | 2024 | 47352 |
| 44 | Alaska | AK | 2024 | 39464 |
| 45 | South Dakota | SD | 2024 | 36985 |
| 46 | North Dakota | ND | 2024 | 35885 |
| 47 | Delaware | DE | 2024 | 35214 |
| 48 | Vermont | VT | 2024 | 31126 |
| 49 | Wyoming | WY | 2024 | 27597 |
| 50 | District of Columbia | DC | 2024 | 20216 |
| 51 | Hawaii | HI | 2024 | 15161 |
Frequently Asked Questions
What is residential end-use energy consumption?
It is the energy directly used in homes plus electricity sold to residential ultimate customers. It excludes electrical system energy losses from generation, transmission, and distribution.
Which state had the highest residential end-use energy consumption in 2024?
California was highest at 863076 billion Btu, followed by Texas at 802809 and New York at 743592.
Is end-use consumption the same as total residential energy consumption?
No. Total residential energy consumption adds electrical system energy losses to end-use consumption.
Does this ranking measure residential energy efficiency?
No. It ranks absolute energy volumes and is strongly affected by population and number of households. Per-household or per-capita measures are better for intensity comparisons.
Related Articles
Green Map creates custom-edited map images using open geographic data sources such as geoBoundaries, Natural Earth, OpenStreetMap, and government open data. These maps are edited visual materials, not raw data files, and are provided for education, documents, presentations, and graphic reference.