Natural gas and other gases used for electricity generation were highly concentrated in a relatively small group of U.S. states in 2025. Across the 50 states and the District of Columbia, the EIA operational series totals 13591978.1 thousand Mcf. Texas leads with 2170151.68 thousand Mcf, about 16.0% of the combined total. Florida follows with 1402462.567, Pennsylvania with 1036156.894, Ohio with 583406.717, and Louisiana with 546282.508 thousand Mcf.
This series measures a physical volume of fuel, not electricity generation and not heat content. Its unit is thousand Mcf. Because one Mcf is 1000 cubic feet, one thousand Mcf equals one million cubic feet. The 51-jurisdiction total can therefore also be read as about 13.592 trillion cubic feet. A Btu-based series can produce slightly different shares because natural gas and other gases do not have exactly the same heat content in every place and period.
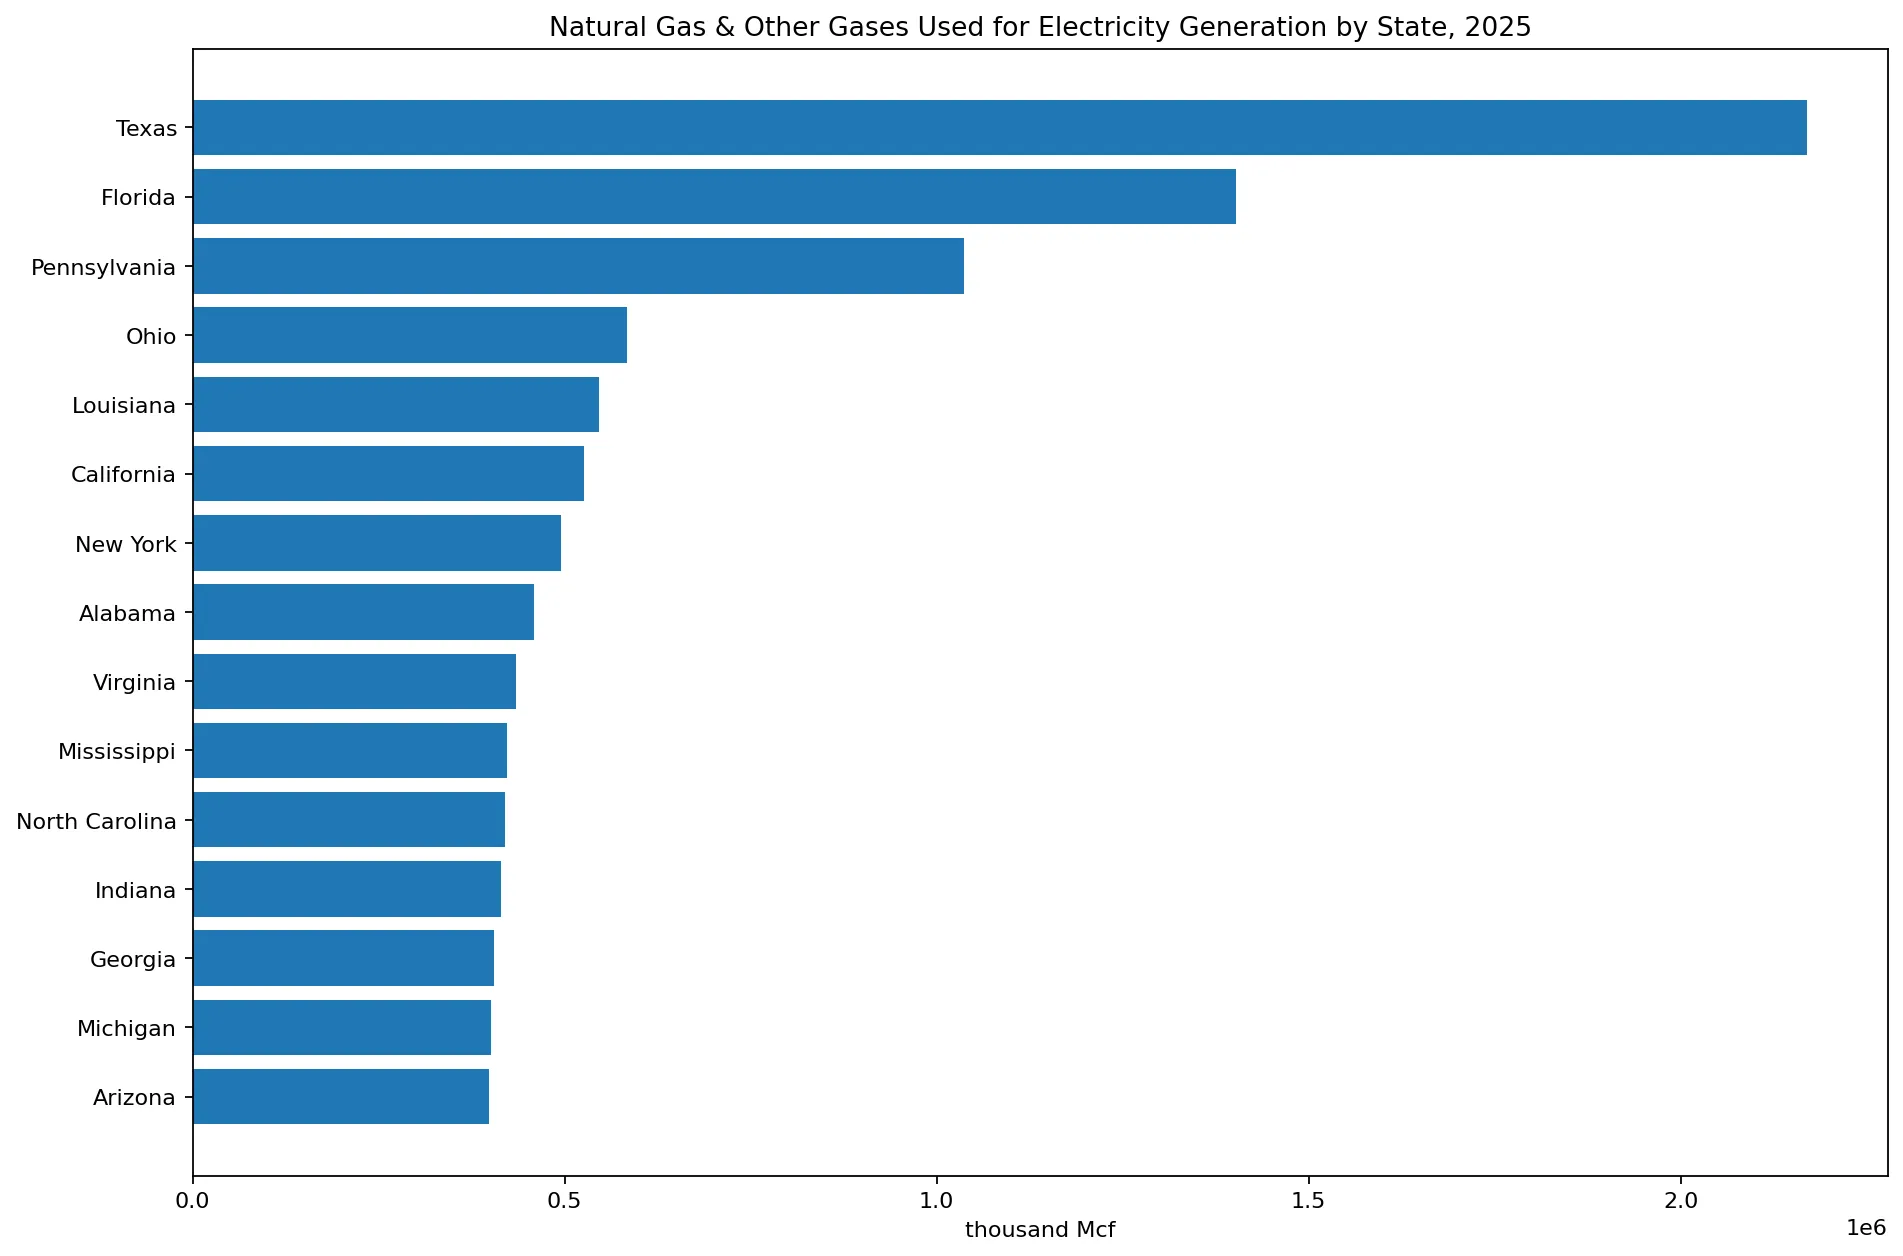
Table of Contents
What the physical-unit series measures
EIA’s electric power operational dataset includes generation, fuel consumption, useful thermal output, and related measures by energy source and sector. The indicator used here is Consumption of Fuels for Electricity Generation (Physical Units) for natural gas & other gases. It describes the volume of those gases consumed to generate electricity. It does not represent all natural gas used in homes, commercial buildings, factories, pipelines, or other end-use activities.
The wording natural gas & other gases is deliberate. EIA describes other gases as including blast furnace gas and other manufactured or waste gases derived from fossil fuels. Natural gas is the dominant component of the combined category, but the series is broader than natural gas alone. Keeping the original scope matters when comparing this dataset with a natural-gas-only publication.
Fuel volume is also different from electricity output. Two power systems can consume the same physical amount of gas and produce different electricity because fuel heat content, plant efficiency, combined-cycle technology, ambient conditions, and operating patterns differ. The state ranking therefore describes gas volume entering electricity generation, not megawatthours produced.
Texas uses about 2.17 trillion cubic feet
Texas records 2170151.68 thousand Mcf, equivalent to about 2.170 trillion cubic feet. Florida is second at roughly 1.402 trillion cubic feet and Pennsylvania third at about 1.036 trillion cubic feet. Texas alone represents about 16.0% of the 51-jurisdiction total, while the top three together account for about 33.9%.
Ohio, Louisiana, California, New York, Alabama, Virginia, and Mississippi complete the top ten. Those ten jurisdictions account for about 59.4% of all natural gas and other gases consumed for electricity generation in this dataset. The top five alone account for 42.2%. This concentration shows that absolute gas demand for power generation is not evenly distributed across the country.
A large volume does not identify a single cause. Large electricity demand, extensive combined-cycle capacity, high utilization of gas-fired plants, regional fuel availability, weather, retirement of coal units, and the size of other generating sources can all shape a state’s result. This one-year physical-volume series documents the outcome, not the causal mechanism.
The top ten account for nearly three fifths of the total
The cumulative pattern is steep at the top. Texas contributes 16.0%, the first three jurisdictions 33.9%, the first five 42.2%, and the first ten 59.4%. The remaining 41 jurisdictions share about 40.6%. For pipeline, storage, and gas-to-power analysis, those absolute concentrations can matter even when a state’s electricity mix is diversified.
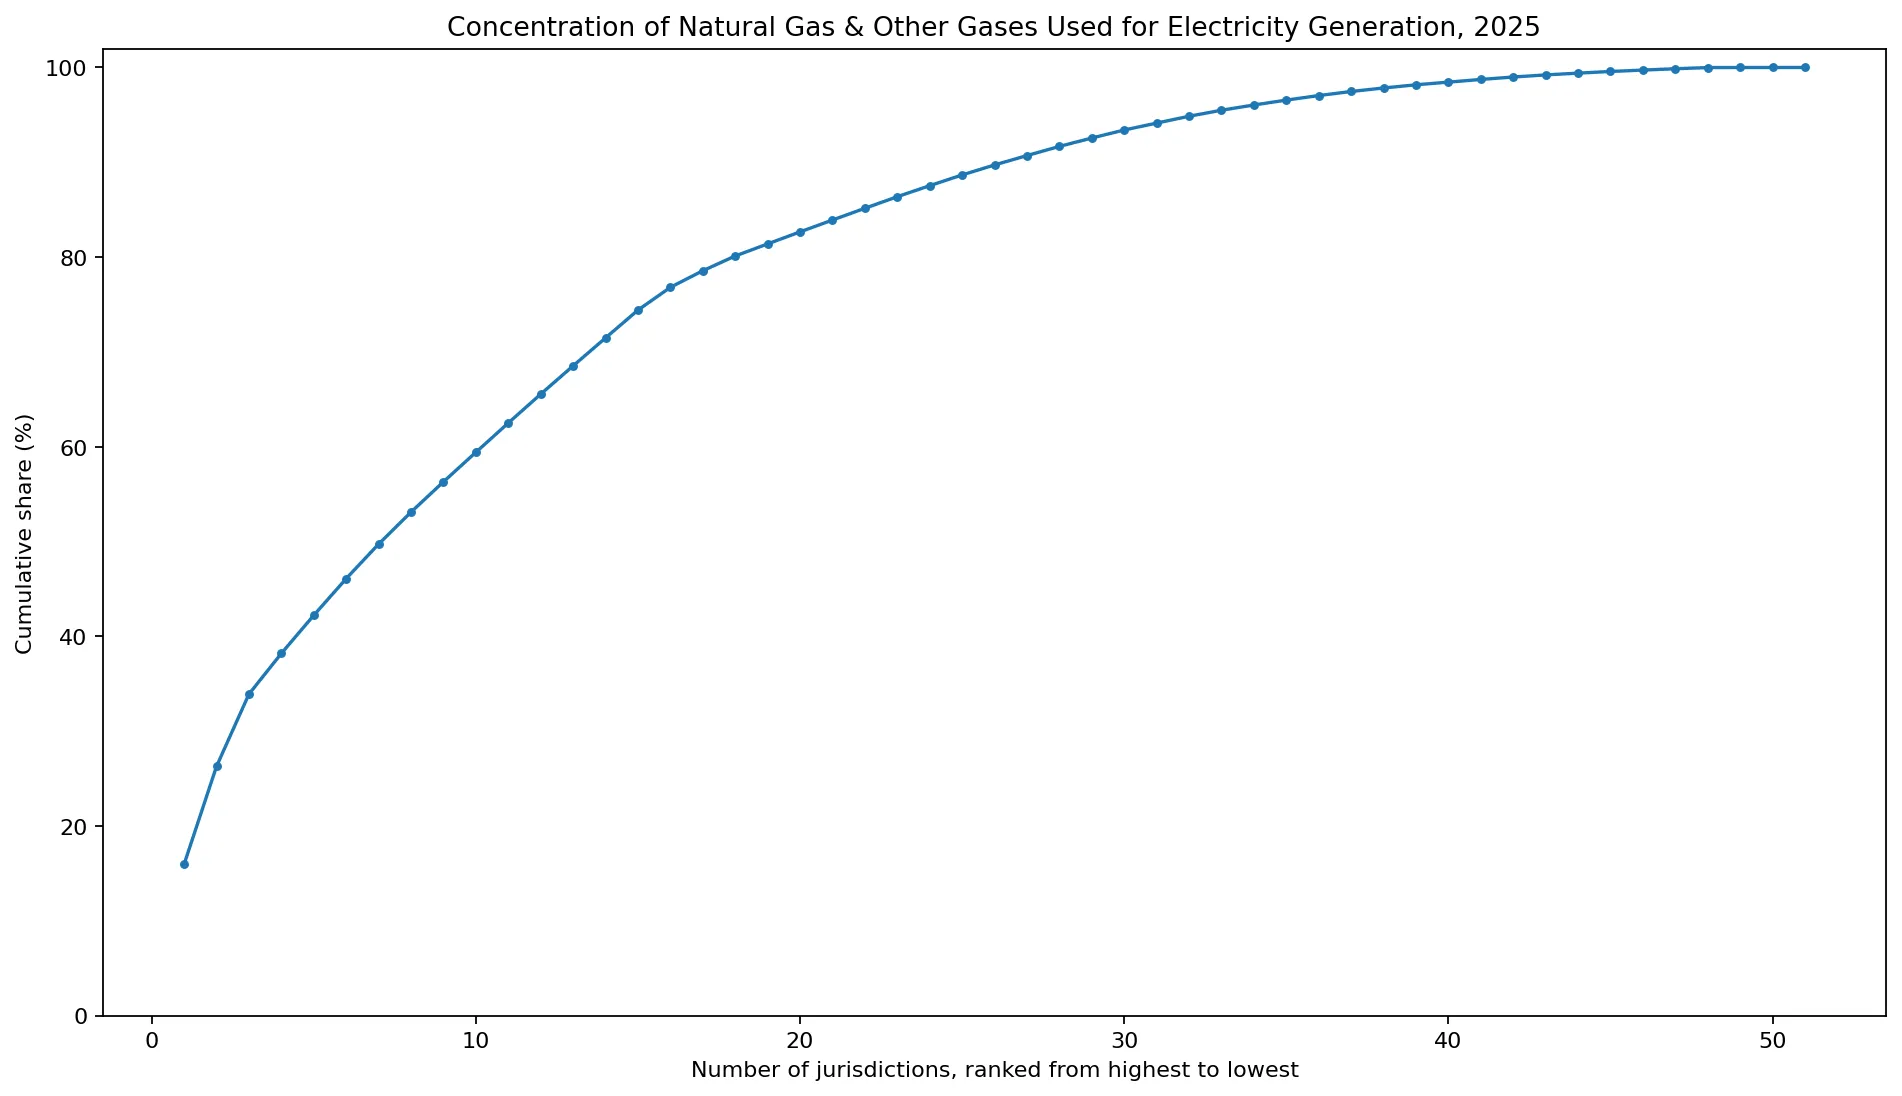
Concentration should not be confused with dependence. A state can consume a large physical volume of gas for generation while also producing substantial nuclear, coal, hydro, wind, or solar electricity. A gas share of the generation mix requires a denominator such as total generation or total generation fuel use. The chart here measures only absolute physical volume.
The median is far below the mean
The unweighted mean across the 51 jurisdictions is about 266509 thousand Mcf, while the median is about 142772. The mean is roughly 1.87 times the median because Texas, Florida, Pennsylvania, and several other large values stretch the upper tail. The middle 50% of jurisdictions lie between about 47841 and 402944 thousand Mcf.
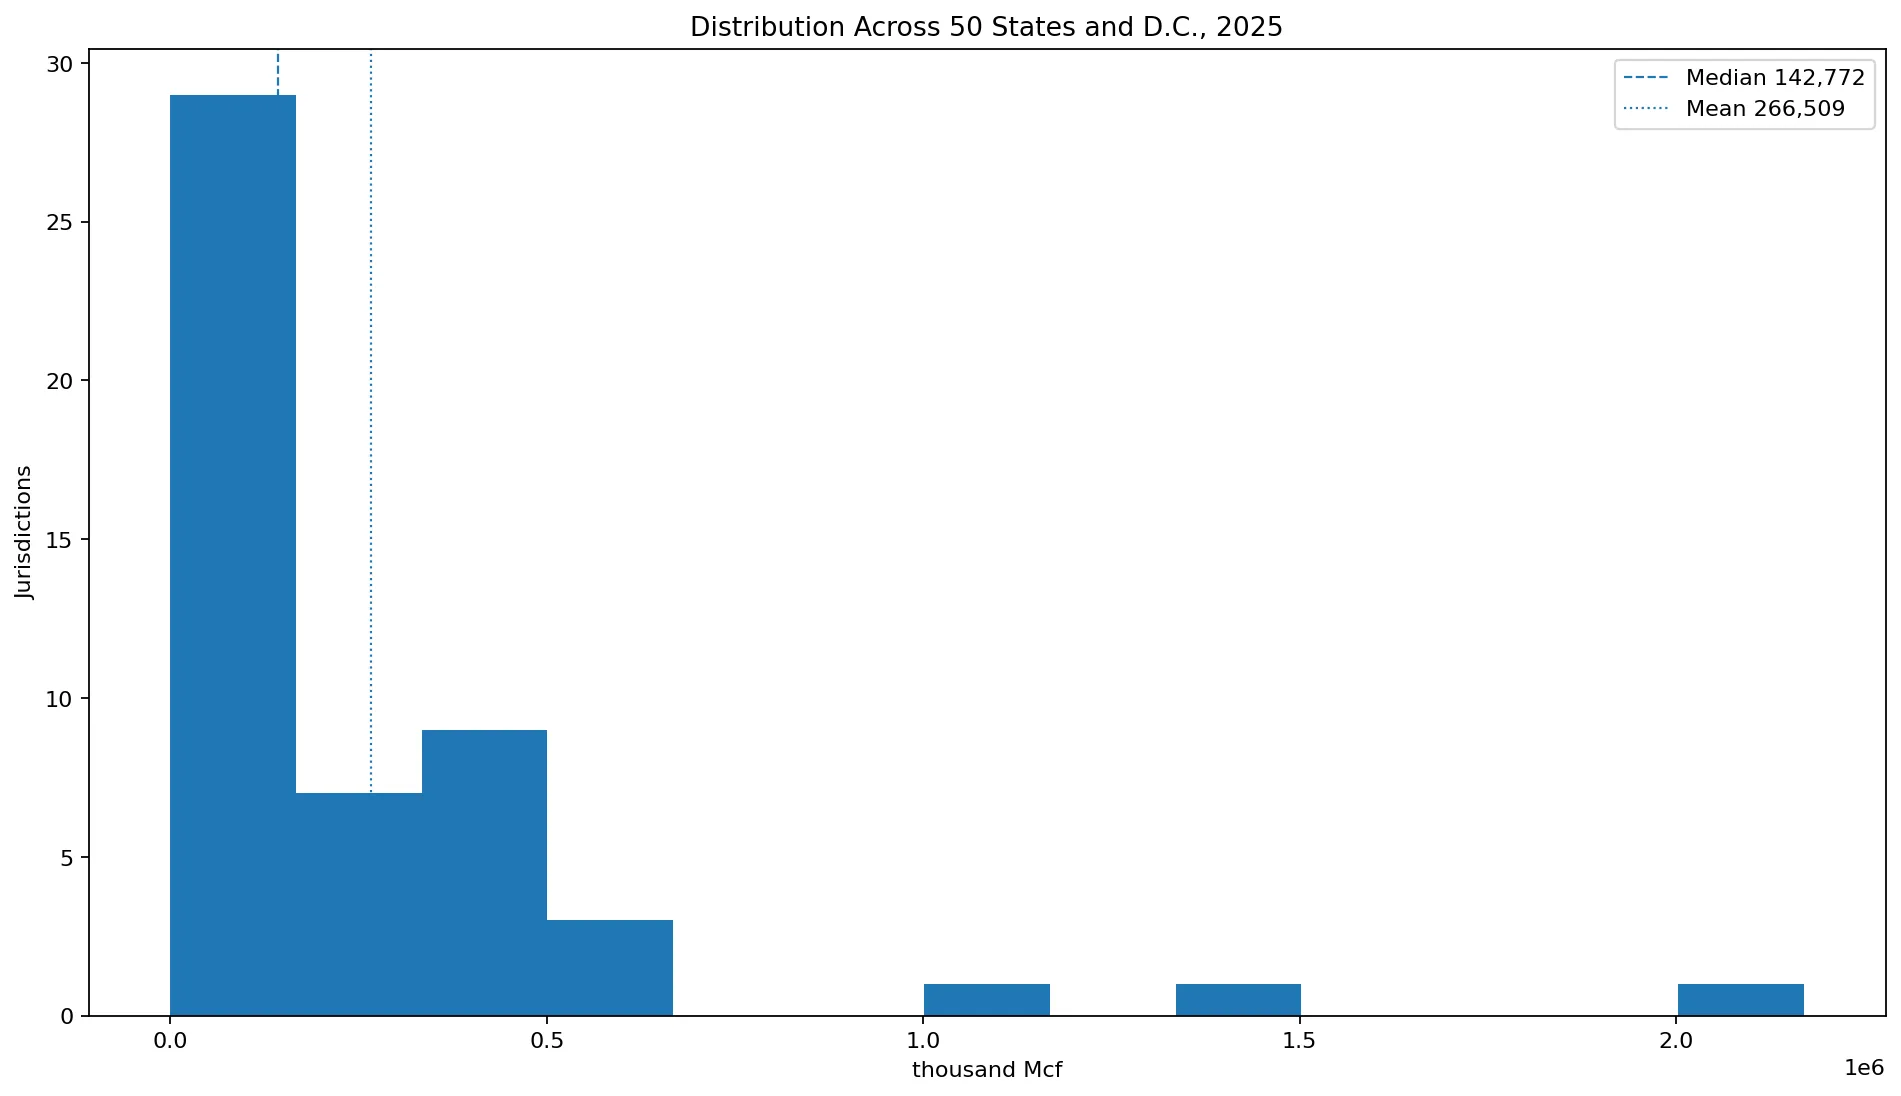
For describing a typical jurisdiction, the median is more useful than the mean alone. For national gas demand, the sum and the cumulative shares are more useful. A single average cannot show both the typical state and the concentration of the largest power markets, so the three statistics should be read together.
Hawaii is recorded at zero in this series
Hawaii is the only jurisdiction recorded at 0.000 thousand Mcf in the 2025 state slice. The other 50 jurisdictions have positive values. The zero is retained because it is the published observation in this EIA series rather than a missing value that has been filled during analysis.
That zero should not be expanded into a claim that Hawaii consumers used no electricity that could have originated from gas somewhere else. The measure is about fuel consumed for electricity generation within the scope of the state operational series. Electricity imports, other generating fuels, and the electricity ultimately consumed by customers are separate questions.
Physical volume and Btu answer different questions
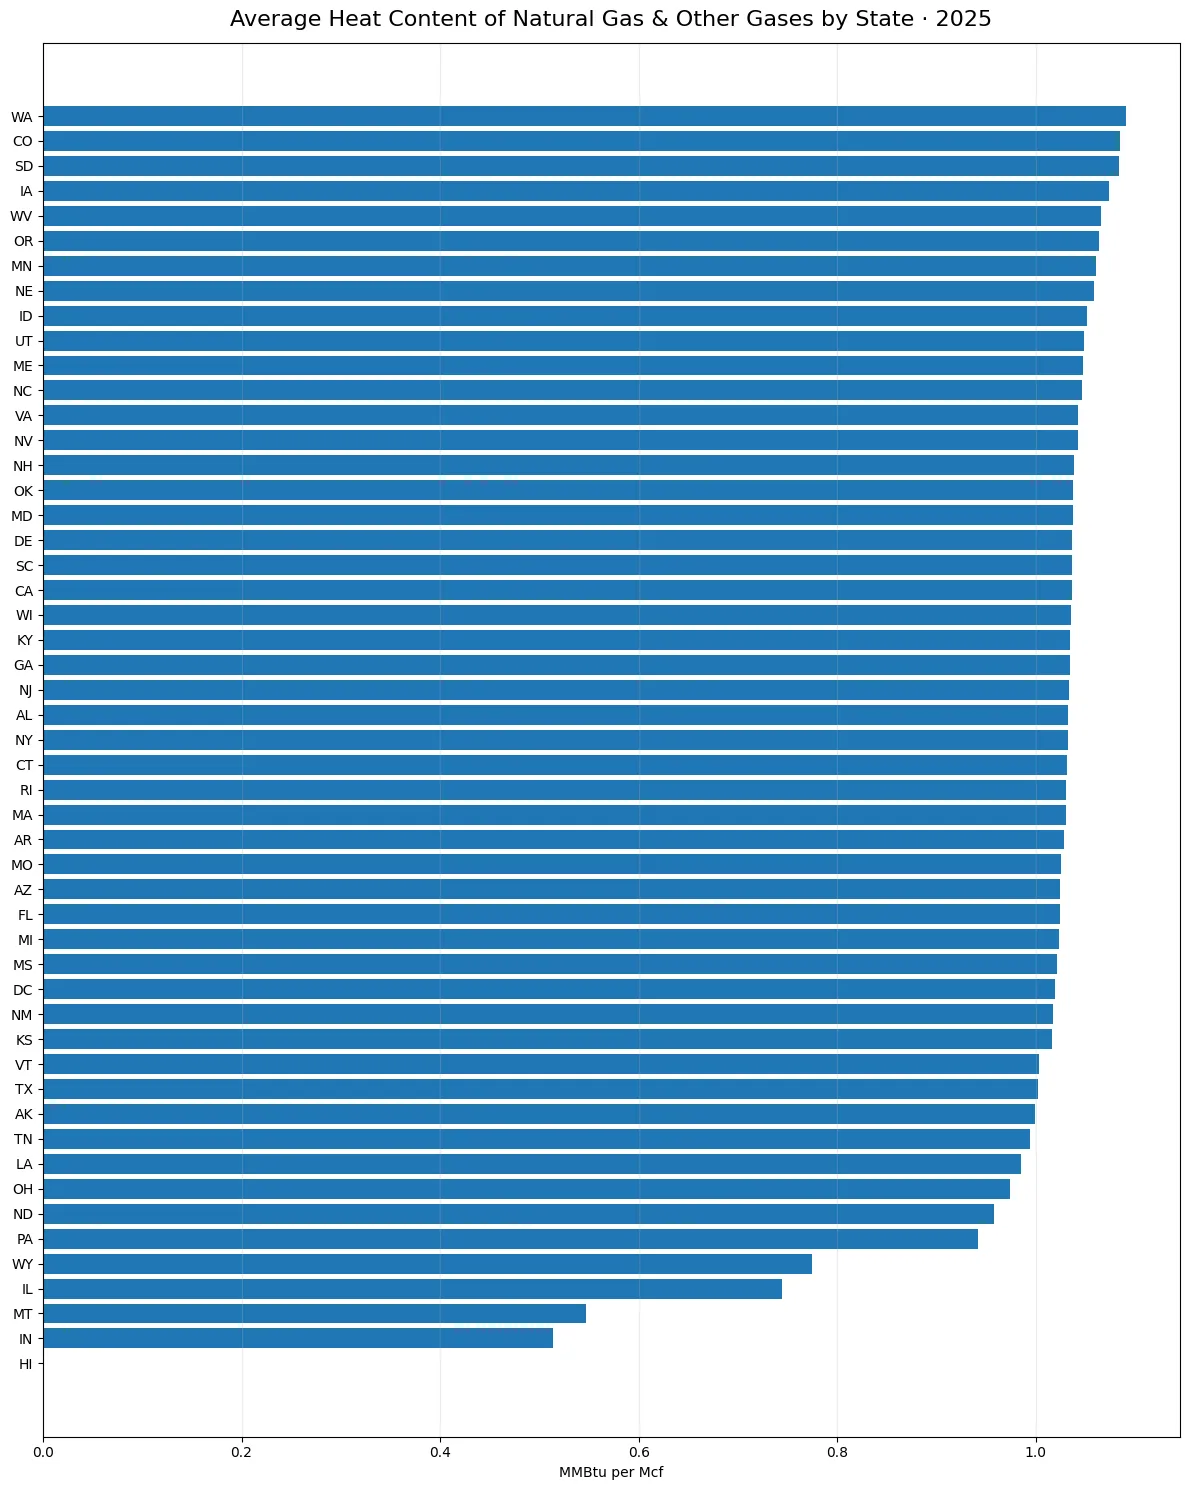
Natural gas statistics are commonly published both in cubic-foot units and in Btu. Cubic-foot measures describe physical volume. Btu measures describe energy content. A thousand cubic feet of gas can contain different amounts of energy depending on composition, and the other-gases component can differ further from pipeline-quality natural gas.
As a result, a state’s share of national physical volume does not have to equal its share of national heat content. Physical units are useful for questions about gas flow, fuel supply, pipeline scale, and volumes burned. Btu is more appropriate when comparing natural gas with coal, petroleum, nuclear energy, or renewable sources in a common energy unit.
The ranking is not an efficiency ranking
More gas consumption does not by itself imply lower generation efficiency. Efficiency analysis requires fuel heat input and electricity output together, often expressed through heat rate. Physical volume alone does not adjust for heat-content differences and therefore is even less suitable as a stand-alone efficiency metric.
A state with modern, efficient combined-cycle plants can still consume a very large gas volume if electricity demand and plant utilization are high. Conversely, a state with little gas-fired generation may rank low regardless of the efficiency of its individual plants. The strength of this dataset is geographic comparison of fuel volume, not evaluation of plant performance.
The lowest values are much smaller than the leading states
At the low end, Hawaii is recorded at zero, Vermont at 8.58 thousand Mcf, the District of Columbia at 981.085, Nebraska at 16863.941, South Dakota at 19079.409, and Montana at 20079.749. The gap between Texas and these small-volume jurisdictions is enormous, reinforcing the strongly skewed distribution.
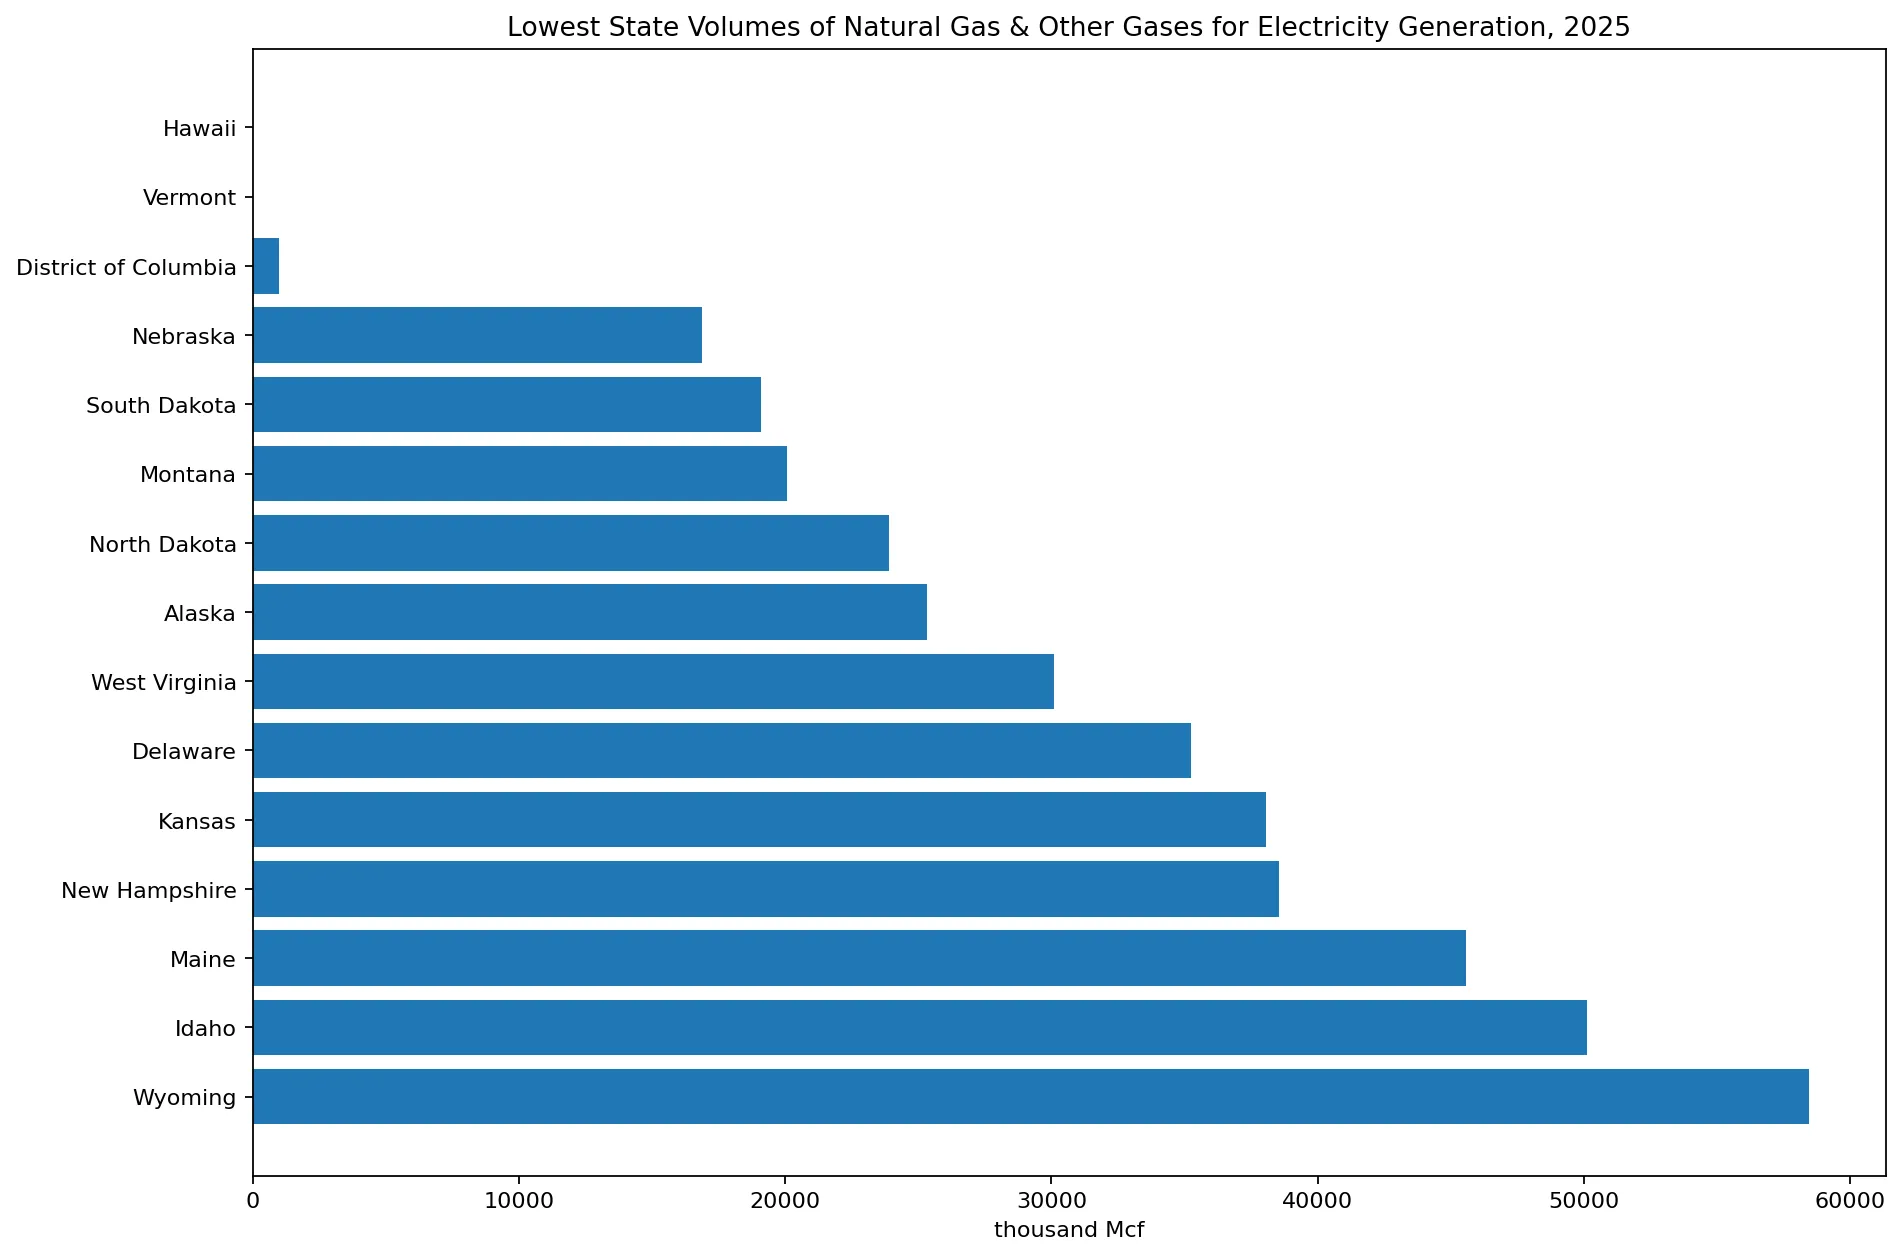
Low absolute volume does not necessarily mean low electricity consumption. A jurisdiction may rely on other fuels, import electricity, have limited in-state generation, or have a generation fleet that uses little gas. Those explanations need generation-mix and power-flow data and should not be inferred from the gas-volume series alone.
Where to go for plant-level detail
EIA’s Form EIA-923 detailed data provide monthly and annual information on generation, fuel consumption, fuel stocks, and related operations at the plant and operator level. The broader Electricity Data page also organizes fuel-consumption statistics by energy source and sector.
Those sources are useful when a state total needs to be separated by plant, technology, or fuel. The state series used here is best for a consistent 2025 geographic comparison, while EIA-923 can answer the more detailed question of which plants account for that state total.
All 51 jurisdictions in 2025
The table below lists the 50 states and the District of Columbia from the largest to the smallest 2025 volume. The unit is thousand Mcf, and Hawaii’s zero is retained as reported in the EIA series.
| Rank | State | Code | Year | thousand Mcf |
|---|---|---|---|---|
| 1 | Texas | TX | 2025 | 2170151.68 |
| 2 | Florida | FL | 2025 | 1402462.567 |
| 3 | Pennsylvania | PA | 2025 | 1036156.894 |
| 4 | Ohio | OH | 2025 | 583406.717 |
| 5 | Louisiana | LA | 2025 | 546282.508 |
| 6 | California | CA | 2025 | 525712.057 |
| 7 | New York | NY | 2025 | 495139.084 |
| 8 | Alabama | AL | 2025 | 458834.786 |
| 9 | Virginia | VA | 2025 | 434451.308 |
| 10 | Mississippi | MS | 2025 | 422829.591 |
| 11 | North Carolina | NC | 2025 | 419853.943 |
| 12 | Indiana | IN | 2025 | 413954.976 |
| 13 | Georgia | GA | 2025 | 405237.126 |
| 14 | Michigan | MI | 2025 | 400651.178 |
| 15 | Arizona | AZ | 2025 | 398650.112 |
| 16 | Oklahoma | OK | 2025 | 326318.268 |
| 17 | Illinois | IL | 2025 | 238003.037 |
| 18 | New Jersey | NJ | 2025 | 211765.282 |
| 19 | Wisconsin | WI | 2025 | 172852.764 |
| 20 | Arkansas | AR | 2025 | 172383.845 |
| 21 | Nevada | NV | 2025 | 169911.845 |
| 22 | Connecticut | CT | 2025 | 168430.714 |
| 23 | South Carolina | SC | 2025 | 166165.386 |
| 24 | Oregon | OR | 2025 | 157955.747 |
| 25 | Kentucky | KY | 2025 | 154286.035 |
| 26 | Colorado | CO | 2025 | 142771.555 |
| 27 | Tennessee | TN | 2025 | 134568.911 |
| 28 | Massachusetts | MA | 2025 | 131329.587 |
| 29 | Maryland | MD | 2025 | 120174.188 |
| 30 | Washington | WA | 2025 | 115137.586 |
| 31 | Minnesota | MN | 2025 | 99194.241 |
| 32 | New Mexico | NM | 2025 | 97982.007 |
| 33 | Utah | UT | 2025 | 86319.053 |
| 34 | Missouri | MO | 2025 | 75072.466 |
| 35 | Rhode Island | RI | 2025 | 70148.919 |
| 36 | Iowa | IA | 2025 | 65119.698 |
| 37 | Wyoming | WY | 2025 | 58448.055 |
| 38 | Idaho | ID | 2025 | 50123.294 |
| 39 | Maine | ME | 2025 | 45559.146 |
| 40 | New Hampshire | NH | 2025 | 38554.3 |
| 41 | Kansas | KS | 2025 | 38056.701 |
| 42 | Delaware | DE | 2025 | 35230.834 |
| 43 | West Virginia | WV | 2025 | 30108.037 |
| 44 | Alaska | AK | 2025 | 25321.602 |
| 45 | North Dakota | ND | 2025 | 23897.706 |
| 46 | Montana | MT | 2025 | 20079.749 |
| 47 | South Dakota | SD | 2025 | 19079.409 |
| 48 | Nebraska | NE | 2025 | 16863.941 |
| 49 | District of Columbia | DC | 2025 | 981.085 |
| 50 | Vermont | VT | 2025 | 8.58 |
| 51 | Hawaii | HI | 2025 | 0 |
Frequently Asked Questions
Which state used the most natural gas and other gases for electricity generation in 2025?
Texas was highest at 2170151.68 thousand Mcf, about 16.0% of the combined 51-jurisdiction volume.
What does thousand Mcf mean?
One Mcf is 1000 cubic feet. One thousand Mcf therefore equals one million cubic feet.
Does a high gas volume mean a high gas share of electricity generation?
Not necessarily. This series measures absolute physical volume. A gas-generation share requires total generation or another denominator.
Why can physical volume and Btu rankings differ?
Physical units measure gas volume, while Btu measures energy content. Heat content varies with gas composition, so state shares can differ slightly.
Related Articles
Green Map creates custom-edited map images using open geographic data sources such as geoBoundaries, Natural Earth, OpenStreetMap, and government open data. These maps are edited visual materials, not raw data files, and are provided for education, documents, presentations, and graphic reference.